 Open Access Article
Molecular dynamics simulations of Y(III) coordination and hydration properties
Xiaolin
Zhang
 a,
Fei
Niu
a,
Donghui
Liu
a,
Shimin
Yang
a,
Youming
Yang
*ab and
Zhifang
Tong
a
a,
Fei
Niu
a,
Donghui
Liu
a,
Shimin
Yang
a,
Youming
Yang
*ab and
Zhifang
Tong
a
aSchool of Metallurgy and Chemical Engineering, Jiangxi University of Science and Technology, Ganzhou 341000, China. E-mail: yanguming@126.com
bNational Engineering Research Center for Ionic Rare Earth, Ganzhou 341000, China
First published on 9th October 2019
Abstract
Y mainly exists in ionic rare-earth resources. During rare-earth carbonate precipitation, rare-earth ion loss in the precipitated rare-earth mother liquor often occurs due to CO32− coordination and Y(III) hydration. Microscopic information on the coordination and hydration of CO32− and H2O to Y(III) has not yet been elucidated. Therefore, in this study, the macroscopic dissolution of Y(III) in different aqueous solutions of Na2CO3 was studied. The radial distribution function and coordination number of Y(III) by CO32− and H2O were systematically analyzed using molecular dynamics (MD) simulations to obtain the complex ion form of Y(III) in carbonate solutions. Density functional theory (DFT) was used to geometrically optimize and calculate the UV spectrum of Y(III) complex ions. This spectrum was then analyzed and compared with experimentally determined ultraviolet-visible spectra to verify the reliability of the MD simulation results. Results showed that Y(III) in aqueous solution exists in the form of [Y·3H2O]3+ and that CO32− is present in the bidentate coordination form. In 0–0.8 mol L−1 CO32− solutions, Y(III) was mainly present as the 5-coordinated complex [YCO3·3H2O]+. When the concentration of CO32− was increased to 1.2 mol L−1, [YCO3·3H2O]+ was converted into a 6-coordinated complex [Y(CO3)2·2H2O]−. Further increases in CO32− concentration promoted Y(III) dissolution in solution in the form of complex ions. These findings can be used to explain the problem of incomplete precipitation of rare earths in carbonate solutions.
1. Introduction
The demand for elemental Y has increased yearly due to its excellent optical applications. Rare-earth carbonates are important inorganic salts used in the extraction and application of rare-earth elements.1 Y mainly exists in ionic rare-earth resources and xenotime, and the solubility of Y and Ln carbonates in water is merely 10−5 to 10−7 mol L−1; therefore, carbonate is used in the industry to precipitate rare-earth ions.2–4 However, rare-earth ions in the mother liquor are considerably lost due to the coordination and hydration in the carbonate solution. The microscopic information of the coordination and hydration by CO32− and H2O on rare-earth ions has not been elucidated.5,6From the 1970s to the 1990s, many scholars have researched the solubility and complex ion morphology of Ln elements in carbonate solution. The amount of Ln dissolved in Na2CO3 solution and the ion morphology are mainly related to the concentration of CO32−. Taketatsu7,8 studied the solubility of rare-earth elements in different concentrations of K2CO3 solution and showed that the dissolved amount of rare-earth elements in K2CO3 solution increases with the carbonate concentration and the atomic number (except for Ce, Y, and Sc). Tran9 investigated the geological migration of Ce in fractured carbonate rock formations and found that in a groundwater environment with pH 7–9, the main rare-earth carbonate complex ions are RECO3+ and RE(CO3)2−; complex ions, such as REHCO32+ and REOH2+, are nearly negligible. In a study on low concentration CO32− natural groundwater, Noack et al.10 found that heavy rare-earth elements (HREEs) are more easily coordinated with CO32− than light rare-earth elements (LREEs) and produce RE(CO3)2−. Johannesson11,12 researched the geochemical behavior of CO32− and RE3+ in Mono Lake water; the forms of rare-earth carbonate complex ions are RE(CO3)2− at 0.27 M CO32− in lake water and RECO3+ in lower-concentration CO32− groundwater. Philippini13,14 found that RE(CO3)2−, RE(CO3)33−, and other complex ions exist in aqueous solutions with different CO2−3 concentration gradients (0.1–1.5 mol L−1). In summary, the complexation mode and morphology of rare-earth ions change with the concentration of CO32−.
Reiller et al.15,16 performed inductive analysis of the existing migration law of Am and associated it with rare-earth elements; they concluded that when the pH of the solution is less than 7, between 7 and 8.5, and above 8.5, the main complex ions are RE3+, RECO3+ and RE(CO3)2−, and possibly RE(CO3)33− or higher-valence-state complex ions, respectively. Given similarities in the physicochemical properties of Am and rare-earth elements, Maloubier et al.17 investigated the results of Am migration studies and concluded that the main forms of rare-earth carbonate ions in a water environment with pH 7–9 are RECO3+ and RE(CO3)2−. This work thus indicated that the morphology of rare-earth complex ions is also related to the pH of the solution.
Using available crystallographic and spectral data, including ultraviolet-visible [UV-vis], near-infrared, and infrared spectra, Jeanvoine18 stated that all Ln(III) ions form tetra-carbonate ions in aqueous solution when carbonate ions are not restricted. Philippini et al.13,14 used electrophoretic mobility shift and time-resolved laser-induced fluorescence spectroscopy (TRLFS) to study several Ln(III)–carbonate complexes and concluded that light rare-earth Ln(III) ions can coordinate 4 carbonate ligands, whereas heavy rare-earth Ln(III) can only coordinate with 3. Modern research methods have enabled significant advances in the analysis of the forms of ions in rare-earth carbonate solutions,19 but nearly all available studies involved are extrapolated analyses of different rare-earth carbonates.20 The structures of rare-earth complex ions in carbonate aqueous solutions are complex and diverse, and their specific forms remain unclear; thus, difficulties have been encountered when directly using UV-vis, near-infrared, infrared, X-ray, and TRLFS to clarify the structure of rare earth-complex ions.21,22
Martelli et al.23 achieved remarkable results through polarization MD simulation studies and examined the structure and kinetics of tri-and tetra-carbonate complexes. Jeanvoine et al.18 used the density functional theory (DFT) method to study the bonding theory of Ln(III) tri- and tetra-carbonate ions and provided the following conclusions: (1) in the gas phase, the most stable structures are full bidentate and monodentate for tri-carbonate and tetra-carbonate complexes, respectively; (2) in the aqueous phase, when the interaction of water molecules is not explicitly considered in the continuous model, the full bidentate complexes are the most stable structures; and (3) Ln(III)–carbonate interactions mainly occur through ionic bonds.
After decades of development in the field of rare-earth metals, many scholars have studied the macroscopic dissolution of aqueous solutions in rare-earth elements in carbonates. However, studies on the microstructure and coordination behavior with CO2−3 and H2O in carbonate solution are scarce. Therefore, the coordination and hydration microscopic information of Ln(III) ions must be further examined.
Y and Ln do not belong to the same period in the periodic table of elements, and their atomic and ionic electronic layer structures considerably differ. However, the properties of Y are substantially similar to those of heavy rare-earth elements, and this similarity requires deep understanding. Therefore, the dissolution law of Y and the microscopic information of its coordination and hydration should be investigated. Motivated by previous studies on the dissolution of Ln elements and complex ion morphology, in the present work, we studied the microscopic interaction of Y with CO32− and H2O in aqueous carbonate solutions. We performed a dissolution experiment and considered the effect of CO32− coordination and hydration in a real solution using MD simulation. Then, we performed DFT quantum chemistry calculations, UV-vis spectral analysis, inversion, and in-depth analysis [Y(CO3)m·nH2O]3−2m of the morphology and ionic structure of Y to clarify its evolution mechanism in carbonate solution. The results of this work could explain the problem of rare-earth yield in ionic rare-earth precipitation.
2. Experimental materials and research methods
2.1 Experimental materials and equipment
The raw materials used in this experiment were obtained from a high-purity YCl3 solution produced by a rare-earth separation plant in Longnan county, Ganzhou. The main component of the YCl3 solution was prepared by oxalic acid precipitation, burning, HCl dissolution, and determined by ICP-MS and are shown in Table 1. Other chemical reagents used, such as Na2CO3 and H2O, were of analytical purity. The experimental equipment or instruments used in this work are shown in Table 2.| Y3+, mol L−1 | H+, mol L−1 | Density, g mL−1 | Rare earth impurities/REO (μg mL−1) | ||||||
|---|---|---|---|---|---|---|---|---|---|
| 0.3419 | <0.10 | 1.0568 | La2O3 | CeO2 | Pr6O11 | Nd2O3 | Sm2O3 | Eu2O3 | Gd2O3 |
| <10 | <10 | <10 | <10 | <10 | <10 | <10 | |||
| Tb2O3 | Dy2O3 | Ho2O3 | Er2O3 | Tm2O3 | Yb2O3 | Lu2O3 | |||
| <10 | <10 | <10 | <10 | <10 | <10 | <10 | |||
| Equipment | Type specification | Manufactures |
|---|---|---|
| High-speed centrifuge | TGL16MS | Yancheng Anxin Experimental Instrument Co., Ltd. |
| Computer server | IBM System X3850 X5 | International Business Machines Corporation |
| UV-visible spectrophotometer (UV-vis) | UV-5500PC | Shanghai yoke instrument Co., Ltd. |
| Inductively coupled plasma-optical emission spectroscopy (ICP-OES) | ULTIMA2 | HORIBA Jobin Yvon |
| pH meter | KL-009 | Xuzhou Yaming Instrument Co., Ltd. |
2.2 Research method
For the microscopic behavior of Y element in carbonate solution system, according to the instantaneous saturated solution of Y(III) in different concentrations of Na2CO3 solution, the SPC/E water model24 was used to calculate the MD of its real solution system. The radial distribution function (RDF) and coordination number of each ion pair in the carbonate solution system were calculated and analyzed, and the Y(III) coordination form considering CO32− was determined.
Geometric and energy optimization of Y3+, Cl−, H2O, and CO32− contained in the solution system were achieved by using the Forcite module in the calculation platform Materials Studio 8.0.25,26 The initial simulation model was a cube system established by the Amorphous cell module in Materials Studio 8.0. The water molecules and ions were randomly distributed in the system. The universal force field was used,27 and the system was geometrically optimized by the Smart method. The parameters were preset in the operation, the calculation step was 1 fs, the total calculation time was 500 ps, the temperature control setting mode was set to Andersen,28 the system temperature was based on 308 K, and the NVT ensemble was selected. The accuracy of the simulation calculations was set to fine. Calculation results were deemed credible when the temperature was stable within 308 K ± 10% and no large temperature disturbance could be observed.29,30 The YCl3–H2O solution system was simulated, and the parameters of each particle are listed under model a in Table 3. YCl3–Na2CO3 solution systems with Na2CO3 concentrations of 0.4, 0.8, 1.2, 1.6, and 2.0 mol L−1 were simulated. The parameters of the corresponding solution particle components are shown in models b, c, d, e, and f in Table 3.
| Model | Solution system | Projects | Composition of each particle of the model | ||||
|---|---|---|---|---|---|---|---|
| a | YCl3–H2O solution | Component | Y3+ | Cl− | CO32− | Na+ | H2O |
| Number | 5 | 15 | — | — | 4444 | ||
| ρ: 1.009 g mL−1 | Weight% | 0.5 | 0.7 | — | — | 98.8 | |
| b | YCl3–Na2CO3 solution | Component | Y3+ | Cl− | CO32− | Na+ | H2O |
| 0.4 mol L−1 Na2CO3 | Number | 1 | 3 | 24 | 48 | 4388 | |
| ρ: 1.075 g mL−1 | Weight% | 0.1 | 0.1 | 1.8 | 1.3 | 96.7 | |
| c | YCl3–Na2CO3 solution | Component | Y3+ | Cl− | CO32− | Na+ | H2O |
| 0.8 mol L−1 Na2CO3 | Number | 2 | 6 | 48 | 96 | 4312 | |
| ρ: 1.095 g mL−1 | Weight% | 0.2 | 0.3 | 3.5 | 2.7 | 93.3 | |
| d | YCl3–Na2CO3 solution | Component | Y3+ | Cl− | CO32− | Na+ | H2O |
| 1.2 mol L−1 Na2CO3 | Number | 3 | 9 | 72 | 144 | 4236 | |
| ρ: 1.115 g mL−1 | Weight% | 0.3 | 0.4 | 5.2 | 4.0 | 90.1 | |
| e | YCl3–Na2CO3 solution | Component | Y3+ | Cl− | CO32− | Na+ | H2O |
| 1.6 mol L−1 Na2CO3 | Number | 4 | 12 | 96 | 192 | 4160 | |
| ρ: 1.136 g mL−1 | Weight% | 0.4 | 0.5 | 6.8 | 5.2 | 87.1 | |
| f | YCl3–Na2CO3 solution | Component | Y3+ | Cl− | CO32− | Na+ | H2O |
| 2.0 mol L−1 Na2CO3 | Number | 5 | 15 | 120 | 240 | 4084 | |
| ρ: 1.156 g mL−1 | Weight% | 0.5 | 0.6 | 8.4 | 6.4 | 84.1 | |
3. Results and discussion
3.1 Instantaneous saturated dissolution of Y(III)
The instantaneous saturated molar concentrations of Y(III) in 50 mL of 0.4, 0.8, 1.2, 1.6, and 2.0 mol L−1 Na2CO3 solution at 35 °C are shown in Fig. 1.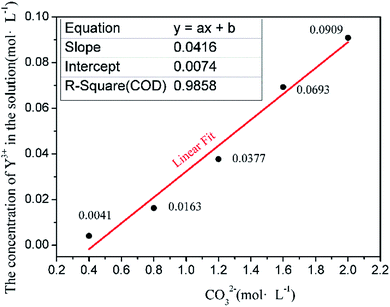 | ||
| Fig. 1 Concentration relationship between instantaneous saturation solubility of Y element with CO32−. | ||
The experiments confirm that the dissolution process of Y occurs in the Na2CO3 solution. A precipitate form when YCl3 is added to the Na2CO3 solution, but this solid is dissolved as the reaction proceeds, thus leaving a clear solution. At this time, Y(III) in the solution does not precipitate as a rare-earth carbonate but is dissolved in the Na2CO3 solution. However, when the added amount of Y(III) exceeds the instantaneous saturated dissolved amount, the solution no longer clears; instead, it assumes the form of a suspension. In this case, part of Y(III) in the solution is precipitated; the amount of dissolved rare-earth ions when the flocculent turbidity is produced is considered the instantaneous saturated dissolved amount. Fig. 1 shows that the instantaneous saturated dissolved amounts of Y in 0.4, 0.8, 1.2, 1.6, and 2.0 mol L−1 Na2CO3 solutions are 0.0041, 0.0163, 0.0377, 0.0693, and 0.0909 mol L−1, respectively. The relationship between the instantaneous saturated dissolved amount of Y and the concentration of CO32− in the base solution was analyzed, and Fig. 1 shows that the Y(III) instantaneous saturated dissolved amount has a linear relation with the concentration of CO32−. The equation describing this relationship is y = 0.0416x + 0.0074, and the R2 is 0.985. This result provides a basis for designing a model of a real solution with different concentrations of CO32−.
3.2 MD
The calculation formulas are as follows:
 | (1) |
 | (2) |
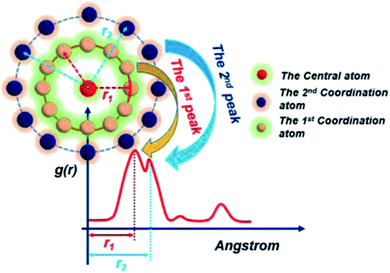
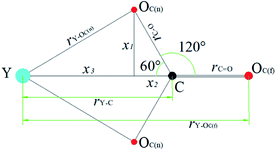
Before the results are described and discussed, a representation the RDF for the studied simulation system should be defined. OC(n) is an oxygen atom of carbonates in the first coordination shell of Y(III), and OC(f) is an oxygen atom farther away from Y(III) in the carbonates. In order to directly investigate the distribution of H2O around Y(III), H2O is considered a whole particle to analyze the RDF of H2O for Y(III) and calculate the coordination number. After each solution simulation is performed and the MD simulations are converged, the RDF and coordination number of Y3+–O, Y3+–H2O, and Y3+–Cl− are calculated separately. The simulation results are shown in Fig. 3–5.
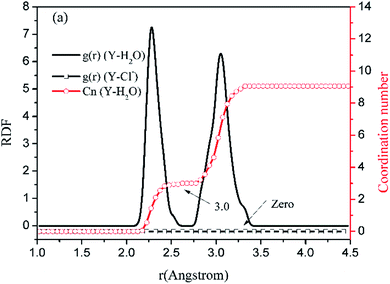 | ||
| Fig. 3 RDF and coordination number of each ligand for Y(III) in YCl3–H2O solution system. (Model a.) | ||
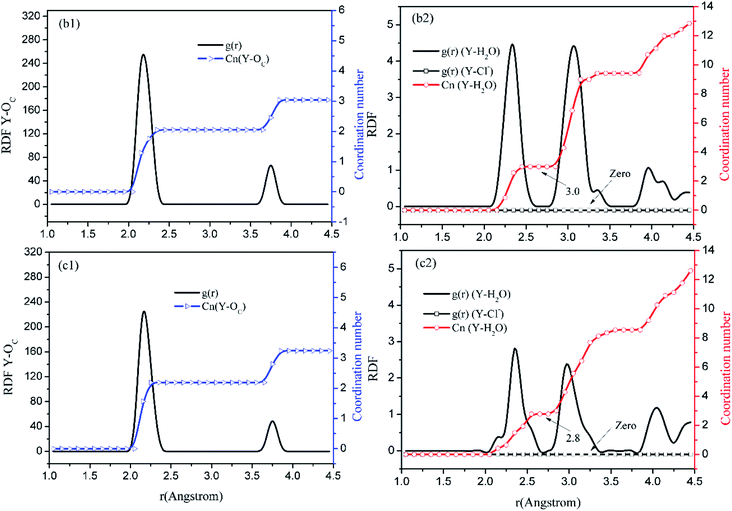 | ||
| Fig. 4 RDF and coordination number of each ligand for Y(III) in YCl3–H2O solution system. (Model b: b1 and b2; Model c: c1 and c2.) | ||
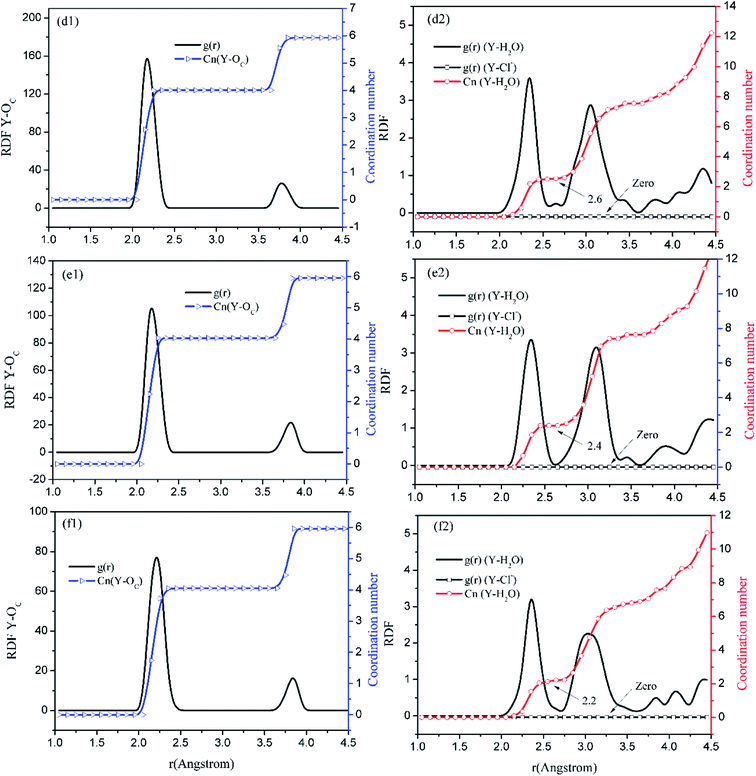 | ||
| Fig. 5 RDF and coordination number of each ligand for Y(III) in YCl3–H2O solution system. (Model d: d1 and d2; Model e: e1 and e2; Model f: f1 and f2.) | ||
Fig. 3–5 show the RDFs of Y3+ and OC(n), OC(f), H2O, and Cl−; the RDF directly reflects the microscopic information of the ions in the rare-earth carbonate solution system. According to the figures (a, b2, c2, d2, e2, and f2), the average coordination of Y3+ and Cl− has zero RDF intensity, and Y3+ and Cl− coordination does not occur. These results indicate that the interaction of Y3+ with Cl− in the solution may be negligible. The Y(III) short-range has two hydrated shells in the YCl3–H2O solution and the YCl3–Na2CO3 solution system; in the central ion close-range ordered layer, RDF counts all ordered short-range particles.36 In existing research and literature, we can conclude that the hydration number of Ln elements decreases with the increase of atomic number, their effective hydration number decreases with the ionic radius reduced. Especially in the diluted LaCl3 and CeCl3 aqueous solution, the hydration number of La and Ce can reach 8–9. While Y element is one cycle shorter than the Ln elements, and its ionic radius is almost smaller than that of the Ln elements. In this paper, in the pure YCl3 aqueous solution in simulation a, the number of water molecules in the first shell of H2O to Y(III) is 3.0, when the g(r) was integrated to the second RDF peak valley, and the short-range H2O molecule number is 9.1, but we consider that only 3.0 H2O molecules in the first shell coordinate with Y(III), and the H2O molecules in the second shell are considered to be under the action of electrostatic attraction. With increasing CO32− concentration in the YCl3–Na2CO3 solution system, eqn (2) is integrated to the second peak valley of the Y(III) short-range order,37,38 that is, in the short-range order, the total H2O molecular number decreases from 9.1 to 7.0 while the coordination number of H2O for Y(III) decreases from 3.0 to 2.2 within r < 2.6 Å. Interestingly, research results reported by Migliorati et al.39 shows, analysis of the simulation results has shown that both Lennard-Jones and Buckingham potentials are able to properly describe the radial distribution of water molecules around the Ln3+ ions, the smooth decrease of the hydration number along the lanthanoid series. In model a, within the first shell layer of Y(III), there are only 3 hydration numbers. In fact, the ionic radius of Y(III) is almost smaller than the ionic radius of the lanthanide, resulting in less coordination number of H2O in first shell layer than that of lanthanides. This does not violate Migliorati's conclusion.
We consider the coordination of CO32− with Y(III). Fig. 3–5 show that in the first coordination shell, formula (2) is integrated to r < 2.6 Å; that is, models b, c, d, f, and e, are integrated to the first peak valleys of the RDF of CO32− for Y(III) coordination. While eqn (2) is integrated to r < 4.0 Å, the five models are integrated to the second peak valleys of the RDF; thus, all the atoms in the short-range order are statistically analyzed. The micro information of the MD simulation results of models a, b, c, d, e, and f is summarized in Table 4 for analysis and comparison.
| Model | r Y–OC(n) (Å) | CnY–O (r < 2.6 Å) | r Y–OC(f) (Å) | CnY–O (r < 4.0 Å) | N OC(n) | N OC(f) | N OC(n)/NOC(f) | r Y–H2O (Å) | CnY–H2O (r < 2.6 Å) |
|---|---|---|---|---|---|---|---|---|---|
| a | — | — | — | — | — | — | — | 2.27 | 3.0 |
| b | 2.15 | 2.0 | 3.75 | 3.0 | 2.0 | 1.0 | 2.0 | 2.35 | 3.0 |
| c | 2.15 | 2.1 | 3.75 | 3.1 | 2.1 | 1.0 | 2.1 | 2.35 | 2.8 |
| d | 2.15 | 4.0 | 3.75 | 6.0 | 4.0 | 2.0 | 2.0 | 2.37 | 2.6 |
| e | 2.15 | 4.0 | 3.75 | 6.0 | 4.0 | 2.0 | 2.0 | 2.40 | 2.4 |
| f | 2.25 | 4.1 | 3.75 | 6.1 | 4.1 | 2.0 | 2.0 | 2.40 | 2.2 |
Fig. 3–5 show that the O atom of the carbonate is short-range ordered. Moreover, OC(n) is in the first shell, and OC(f) is in the second shell. According to Table 4, when CO32− is 0.4–1.6 mol L−1, rY–OC(n) is 2.15 Å, and only when CO32− increases to 2.0 mol L−1 does rY–OC(n) increase to 2.25 Å; in addition, rY–OC(f) of all MD results is 3.75 Å. Therefore, in the YCl3–Na2CO3 solution system, the change in CO32− concentration has nearly no effect on the peak position of the RDF; it affects the peak of g(r) only.
According to the specific simulation values in Table 4, we initially predict, the ionic composition of Y(III) in the YCl3 solution is [Y·3H2O]3+. Y(III) mainly exists in the form of a complex [YCO3·3H2O]+ in 0–0.8 mol L−1 CO32− solution and in the form of a complex [Y(CO3)2·2H2O]− in 1.2–2.0 mol L−1 CO32− solution. In the solution with high CO32− concentration, H2O in Y(III) short-range is crowded by the CO32− space. In the first water molecule shell, the coordination number of H2O for Y(III) is reduced to 2.2, consistent with the conclusion reported by Martelli.23 In the high-CO32−-concentration solution, the hydration number of heavy rare-earth carbonate Ln(III) is 4–2. When CO32− ≤ 0.8 mol L−1, one CO32− passes through the second shell of the H2O molecules from the outer layer and then enters the first shell to coordinate with Y(III). At this point, the effect of H2O molecule crowding is not noticeable. However, when CO32− is further increased, the second CO32− passes through the second H2O ordered layer from the outer layer then and enters the first shell to coordinate with Y(III). Under this condition, short-range CO32− space crowding results in a decrease of 1–2 H2O molecules around the Y(III) short-range. This result indicates that the interaction between CO32− and Y(III), is that CO32− is originally due to electrostatic attraction at a distant location, passing through the second layer of H2O molecules, and entering the inner shell. Then, a coordination bond with Y(III) occurs.
It is worth mentioning, carbonate not only complexes rare-earth ions but also precipitates with rare-earth ions in carbonate solutions. In the high concentration CO32− solution system of this paper, due to the higher CO32− ion strength, CO32− will be squeezed into the short-range. It has been reported that with the increase of CO32− concentration, in short-range of H2O will replace 1–2, a CO32− replaces a H2O molecule, resulting in increase the coordination number 1 because there is two O elements of CO32− coordinated with Y(III). In a certain sense, high concentration of CO32− seem to have interactions like counterions on CO32− coordination, related theory of counterions on the hydration structure of lanthanide ions can be used to study this problem.40
In order to demonstrate CO32− for the Y(III) coordination mode, we assume that the coordination mode of each CO32− to Y atom is bidentate form, rY–OC(n) is the distance between the Y(III) short-range Y atom and the CO32− first-coordination-layer O atom, and rY–OC(f) is the distance between Y(III) and OC(n). The distance between the other atoms is defined as shown in Fig. 6. In these MD simulation studies, CO32− is a rigid particle, where rC–O and rC![[double bond, length as m-dash]](https://www.rsc.org/images/entities/char_e001.gif) O are 1.269 Å, ∠OCO = 120° according to the principle of minimum energy, and ∠YCO = 60°.
O are 1.269 Å, ∠OCO = 120° according to the principle of minimum energy, and ∠YCO = 60°.
On the basis of these known conditions, we infer the relationship between rY–OC(n) and rY–OC(f)via the following reasoning:
x1 = sin![[thin space (1/6-em)]](https://www.rsc.org/images/entities/char_2009.gif) 60°rC–O 60°rC–O | (3) |
x2 = cos![[thin space (1/6-em)]](https://www.rsc.org/images/entities/char_2009.gif) 60°rC–O 60°rC–O | (4) |
 | (5) |
| rY–C = x2 + x3 | (6) |
rY–OC(f) = x2 + x3 + rC![[double bond, length as m-dash]](https://www.rsc.org/images/entities/char_e001.gif) O O | (7) |
 | (8) |
By substituting the values of rC–O and rC![[double bond, length as m-dash]](https://www.rsc.org/images/entities/char_e001.gif) O to eqn (8), we calculate rY–OC(f).
O to eqn (8), we calculate rY–OC(f).
 | (9) |
According to the definition of Fig. 6, the following relationship can also be determined: NOC(n)![[thin space (1/6-em)]](https://www.rsc.org/images/entities/char_2009.gif) :
:![[thin space (1/6-em)]](https://www.rsc.org/images/entities/char_2009.gif) NOC(f) = 2
NOC(f) = 2![[thin space (1/6-em)]](https://www.rsc.org/images/entities/char_2009.gif) :
:![[thin space (1/6-em)]](https://www.rsc.org/images/entities/char_2009.gif) 1.
1.
| NOC(f) = CnY–O(r < 4.0 Å) − CnY–O (r < 4.0 Å) | (10) |
According to the calculation results in Table 4, NOC(n)![[thin space (1/6-em)]](https://www.rsc.org/images/entities/char_2009.gif) :
:![[thin space (1/6-em)]](https://www.rsc.org/images/entities/char_2009.gif) NOC(f) are all 2
NOC(f) are all 2![[thin space (1/6-em)]](https://www.rsc.org/images/entities/char_2009.gif) :
:![[thin space (1/6-em)]](https://www.rsc.org/images/entities/char_2009.gif) 1 among models b, c, d, e, and f. The relationship between their rY–OC(n) and rY–OC(f) agrees well with eqn (9). Therefore, our assumptions are true. Regardless of CO32− concentration, CO32− and Y(III) are combined in the form of bidentate coordination. In Na2CO3 solution systems of different concentrations, only the Y(III) ion CO32− average coordination number and hydration number change. With increasing CO32−, the coordination number of the O atom to Y(III) changes. The OC(n) atoms are directly coordinated with Y(III), that is, CnY–O (r < 2.6 Å) is the average coordination number of O.33 When CO32− concentration is 0.4–0.8 mol L−1, the coordination number of O atom to Y(III) is 2, the coordination number of H2O molecule to Y(III) is 3; while the concentration of CO32− is 1.2–2.0 mol L−1, the coordination number of O atom to Y(III) is 4, and the coordination number of H2O molecule to Y(III) is 2. Therefore, the total coordination number of Y(III) in YCl3 aqueous solution is 3, and the total coordination number of Y(III) is 5 when CO32− concentration is 0.4–0.8 mol L−1, and the total coordination number of Y(III) is 6 when the concentration of CO32− increases to 1.2–2.0 mol L−1. In a high-concentration (CO32− > 1.2 mol L−1) carbonate solution, Y(III) mainly exists in the bidentate coordination form of [Y(CO3)2·2H2O]−. This finding is consistent with the conclusion by Jeanvoine18 that the carbonate of Ln(III) in aqueous solution shows bidentate coordination.
1 among models b, c, d, e, and f. The relationship between their rY–OC(n) and rY–OC(f) agrees well with eqn (9). Therefore, our assumptions are true. Regardless of CO32− concentration, CO32− and Y(III) are combined in the form of bidentate coordination. In Na2CO3 solution systems of different concentrations, only the Y(III) ion CO32− average coordination number and hydration number change. With increasing CO32−, the coordination number of the O atom to Y(III) changes. The OC(n) atoms are directly coordinated with Y(III), that is, CnY–O (r < 2.6 Å) is the average coordination number of O.33 When CO32− concentration is 0.4–0.8 mol L−1, the coordination number of O atom to Y(III) is 2, the coordination number of H2O molecule to Y(III) is 3; while the concentration of CO32− is 1.2–2.0 mol L−1, the coordination number of O atom to Y(III) is 4, and the coordination number of H2O molecule to Y(III) is 2. Therefore, the total coordination number of Y(III) in YCl3 aqueous solution is 3, and the total coordination number of Y(III) is 5 when CO32− concentration is 0.4–0.8 mol L−1, and the total coordination number of Y(III) is 6 when the concentration of CO32− increases to 1.2–2.0 mol L−1. In a high-concentration (CO32− > 1.2 mol L−1) carbonate solution, Y(III) mainly exists in the bidentate coordination form of [Y(CO3)2·2H2O]−. This finding is consistent with the conclusion by Jeanvoine18 that the carbonate of Ln(III) in aqueous solution shows bidentate coordination.
3.3 UV-vis full wavelength scanning absorption spectroscopy
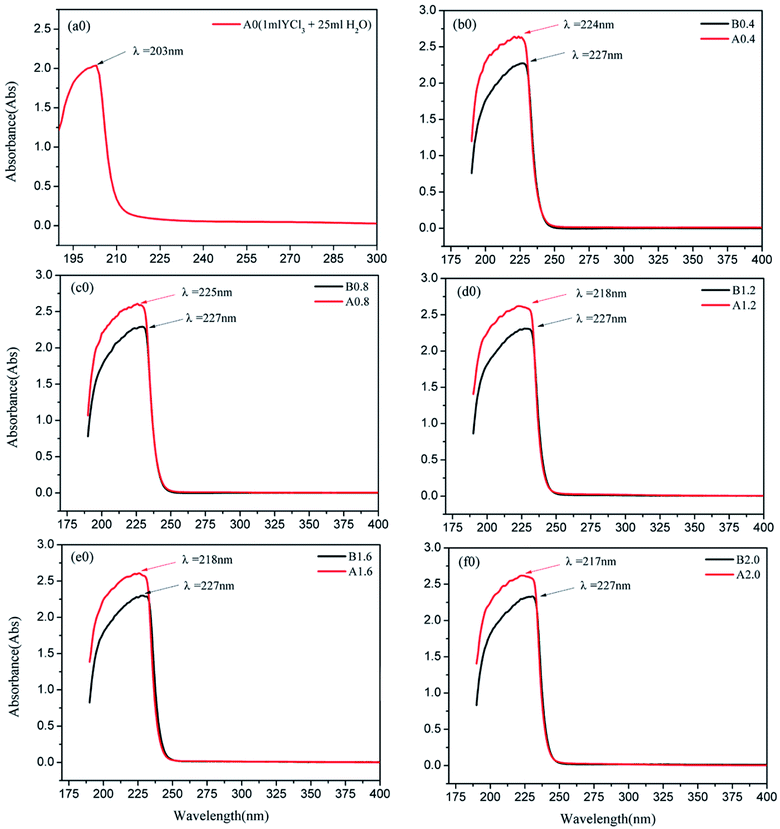
Before the results are analyzed and discussed further, the characteristics of some experimental results is explained. A0, which is the UV-vis absorbance curve, is determined by adding 1 mL of YCl3 to 25 mL of pure water. A0.4, A0.8, A1.2, A1.6, and A2.0 are the UV-vis absorbance curves determined by adding 1 mL of YCl3 to 25 mL solutions of 0.4, 0.8, 1.2, 1.6, and 2.0 mol L−1 Na2CO3, respectively. After mixing, the mixture is centrifuged, and the supernatant is subjected to UV-vis full-wavelength scanning to obtain the corresponding UV-vis absorbance curves. B0.4, B0.8, B1.2, B1.6, and B2.0 are the UV-vis absorbance curves determined by adding 1 mL of pure water to 25 mL solutions of 0.4, 0.8, 1.2, 1.6, and 2.0 mol L−1 Na2CO3, respectively. After mixing, the UV-vis full-wavelength scanning absorption curve is measured by the same method as a blank control spectrum. The results of UV-vis full-wavelength scanning analysis are shown in Fig. 7.Fig. 7(a0) illustrates that the UV-vis characteristic absorption peak of the YCl3–H2O solution system is λ = 203 nm. Fig. 7(b0 and c0) show the UV absorption peaks of the YCl3–Na2CO3 solutions (0.4 and 0.8 mol L−1 CO32−) and the corresponding blank control spectrum. The characteristic absorption wavelengths of A0.4 and B0.4 is close, A0.8 and B0.8 is also close. But the absorbance of A0.4 at λ = 224 nm is significantly stronger than that of B0.4, and the absorbance of A0.8 at λ = 225 nm is significantly stronger than B0.8 at peak position. Fig. 7(d0, e0 and f0) show the UV absorption peaks of the YCl3–Na2CO3 solutions (1.2, 1.6, and 2.0 mol L−1 CO32−) and the corresponding blank control spectrum. The UV-vis characteristic absorption peaks at λ = 217–218 nm for A1.2, A1.6, and A2.0 and their peak absorbances are remarkably stronger than those of the corresponding B1.2, B1.6, and B2.0 systems. The results of MD calculation should be verified via quantum chemical calculation to further analyze and demonstrate the Y(III) coordination morphology in the YCl3–Na2CO3 solution systems of different CO32−.
3.4 DFT calculation results
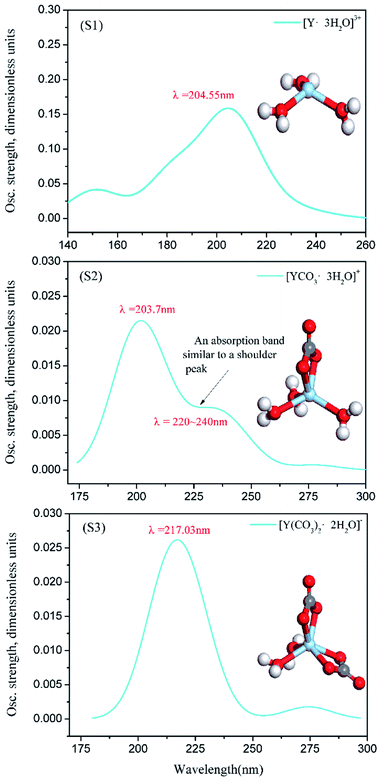 | ||
| Fig. 8 [Y·3H2O]3+, [YCO3·3H2O]+ and [Y(CO3)2·2H2O]− calculated UV spectrum and structure (S1, S2, S3). | ||
In this section, the absorption curve measured by UV-vis full-wavelength scanning is obtained by adding 1 mL of YCl3 to several Na2CO3 solutions; in fact, it is the overlap of the absorption curve generated by Y(III) complex ions (including [Y·3H2O]3+, [YCO3·3H2O]+, and [Y(CO3)2·2H2O]−) and the absorption bands of the solvent (Na2CO3, H2O). Although the solvent itself has its own UV absorption band, the characteristic peak wavelength of the UV-vis full-wavelength scan of Fig. 7(a0) is close to the wavelength of the calculated UV spectral characteristic absorption of Fig. 8(S1). Moreover, the UV-vis characteristic absorption peaks at λ = 217–218 nm for A1.2, A1.6, and A2.0 are significantly stronger than those for the corresponding B1.2, B1.6, and B2.0 curves. This finding verifies that Y(III) exists in the form of [Y·3H2O]3+ in the YCl3 aqueous solution. The peak positions of the UV-vis full-wavelength scans of Fig. 7(d0, e0 and f0) are consistent with the absorption peak position of the UV spectrum characteristic of Fig. 8(S3), that is, the theoretically calculated UV spectral absorption characteristic peak position and the experiment measured absorption peaks of the UV-vis full-wavelength scan are consistent. Thus, Y(III) is a 6-coordinated complex [Y(CO3)2·2H2O]− in the 1.2–2.0 mol L−1 Na2CO3 solution. In Fig. 7, the results of UV-vis full-wavelength scanning analysis of B0.4, B0.8, B1.2, B1.6, and B2.0 show a certain absorption band in the blank control sample, which means the Na2CO3 solution itself presents some UV absorption, and the absorption curves of different concentrations of Na2CO3 solution are basically the same.
However, comparison between the UV test results of Fig. 7(b0 and c0) and the calculated spectra of Fig. 8(S2) shows that the absorption band of Na2CO3 solution considerably influences the absorption intensity and absorption peak wavelength of A0.4 and A0.8. That is, in the Na2CO3 solution with low CO32− concentration, the UV absorption band of the solvent itself greatly affects the peak position and absorption intensity of the UV absorption curve of [YCO3·3H2O]+. It can be seen from Fig. 8(S2) and Fig. 7(b0, c0), the characteristic absorption peak wavelength of [YCO3·3H2O]+ is λ = 203.7 nm, which is not seen in the experimental analysis of the low-CO32−-concentration Na2CO3 solutions (in absorbance curve of A0.4 and A0.8), because the characteristic peak of the Y–Ow bond at λ = 203.7 nm is not revealed in such solutions. The absorption bands B0.4 and B0.8 of the Na2CO3 solution itself are at a low absorption level of λ = 203.7 nm. Therefore, the UV spectrum obtained by the experimental test (A0.4 and A0.8) is the result of superimposing the UV absorption band of [YCO3·3H2O]+ as the solute in the solution and the absorption band of the Na2CO3 solution.42 This process results in the theoretical UV absorption peak of λ = 203.7 nm, which is not reflected in the experimental analysis of the UV spectrum. In Fig. 8(S2), the characteristic absorption band of [YCO3·3H2O]+ at λ = 220–240 nm, which resembles a shoulder peak, is enhanced in the experimental UV spectrum.43 Thereby, the absorption band of [YCO3·3H2O]+ calculated UV spectrum (Fig. 8(S2)) at λ = 220–240 nm, is exhibited in Fig. 7(b0, c0) at λ = 224–225 nm.
We analyze the bond length information of Y(III) complex ions by DFT geometry optimization. The structural results of carbonate complex ion S1, S2, S3 complexes obtained from DFT calculation are shown in Table 5. Here, Y–OC(n) represents the distance between the Y atom and the nearer O atom in the carbonate, and Y–OW represents the distance between the Y atom and the O atom in the water molecule.
| Structure | Complex ion composition | Y–OC(n) (Å) | Y–OW (Å) |
|---|---|---|---|
| S1 | [Y·3H2O]3+ | — | 2.24 |
| S2 | [YCO3·3H2O]+ | 2.17 | 2.32 |
| S3 | [Y(CO3)2·2H2O]− | 2.25 | 2.43 |
In the RDF analysis of the MD simulation, the first shell of the O atoms interacting with Y(III) and the first shell of H2O are analyzed, that is, Y(III) and each ligand the distance between them. Comparison of the values in Tables 4 and 5 shows that in model a, rY–H2O is close to the value of Y–OW; in models b and c, rY–Oc(n) and the values of Y–OC(n) are consistent, and rY–H2O is close to the value of Y–OC(n); in models d, e, and f, rY–H2O is close to the value of Y–OC(n), and the values of rY–H2O and Y–OW are close. The comparison also shows that the coordination around Y(III) is CO32−. When the coordination number of CO32− is increased from 1 to 2, the length of Y–OW in the first shell of the H2O molecule increases. Therefore, the distance between Y(III) and OC(n) obtained by MD simulation is consistent with the bond length Y–OC(n) calculated by DFT. The distance rY–H2O of the first shell of the H2O molecule is also consistent with the bond length of Y–OW calculated by DFT. In summary, the DFT calculation results and the experimental UV-vis analysis are well-validated by the MD simulation results.
According to the results of the MD simulation, dissolve experiment and UV-vis full-wavelength scanning experiment, three complex ions of Y(III) can be gradually transformed into each other increases with the concentration of CO32− increasing, the process of which is shown in Fig. 9.
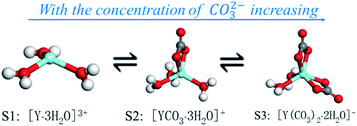 | ||
| Fig. 9 Schematic diagram of morphological transformation of S1, S2 and S3 complex ions in YCl3–Na2CO3 solution system. | ||
With increasing of the CO32− concentration, the following dynamic balance exists in the YCl3–Na2CO3 solution system:
| YCl3 ⇌ Y3+ + 3Cl− | (11) |
| Y3+ + 3H2O ⇌ [Y·3H2O]3+ | (12) |
| [Y·3H2O]3+ + CO32− ⇌ [YCO3·3H2O]+ | (13) |
| [YCO3·3H2O]+ + CO32− ⇌ [Y(CO3)2·2H2O]− + H2O | (14) |
Fig. 9 illustrates that for [Y·3H2O]3+ has one coordination point, with the concentration of CO32− increasing, preferentially combines one CO32− at the coordination point of [Y·3H2O]3+, and converts to [YCO3·3H2O]+ complex ions, while the concentration of CO32− further increase, there will be a second CO32− to replace one of the H2O molecules in the first shell, as in the reaction of (14) process, [YCO3·3H2O]+ transforms to [Y(CO3)2·2H2O]−. Under different CO32− concentration of the YCl3–Na2CO3 solution system, the complex ion morphology of Y(III) is consistent with the conclusion reported by Jeanvoine.18 This result is also in line with Philippini's13 conclusion that Ln(III) coordinates with additional CO32− ions with increasing concentration of CO32−.
In our analysis of the instantaneous saturated dissolution of Y(III) in Na2CO3 solution, we believe that, given the coordination effect of a high concentration of CO32− ions on Y(III) along with the CO32− concentration increase, reaction eqn (13) and (14) are promoted in the positive direction, thereby increasing the instantaneous saturated solubility of Y(III). Therefore, according to the Y(III) dissolution experiment results, MD simulation studies of different concentrations of the YCl3–Na2CO3 real solution system are performed. By combining the DFT calculation results and experimental UV-vis analysis, we can accurately resolve the microstructure and behavior of CO32− coordination and hydration for Y(III). We reveal that the large mother liquor ion loss in rare-earth carbonate precipitation is caused by CO32− coordination and hydration; consequently, REE is dissolved in the carbonate solution in the form of complex ions, resulting in incomplete precipitation of rare-earth.44
4. Conclusions
In this study, a Y(III) dissolution experiment in Na2CO3 solution was used to determine the instantaneous saturated solubility of Y(III) in Na2CO3 solution, and the macroscopic dissolution law of Y(III) with CO32− concentration was obtained. The RDF and coordination number of Y(III) by CO32− and H2O were systematically analyzed using MD simulations to obtain the complex ion form of Y(III) in carbonate solution. DFT was adopted to geometrically optimize and calculate the UV spectrum of the Y(III) complex ions. Findings are then compared with the experimentally determined UV-vis spectra and analyzed to further verify the reliability of the MD simulation results. The main conclusions are as follows.(1) YCl3 is added to Na2CO3 solution with instantaneous saturated dissolution, and a coordination effect on Y(III) is observed. The higher the CO32− concentration, the easier the conversion to [Y(CO3)2·2H2O]− and the higher the instantaneous saturation dissolution of Y(III). When the initial concentration of Na2CO3 is 2 M, the instantaneous saturated dissolution of Y(III) in the carbonate reaches 0.0909 mol L−1.
(2) In the aqueous solution of YCl3, Y(III) exists in the form of [Y·3H2O]3+. Each CO32− with O atoms is close to the Y atom and combines via bidentate coordination. In 0–0.8 mol L−1 CO32− aqueous solutions, Y(III) is mainly 5-coordinated [YCO3·3H2O]+; with increasing CO32− concentration, [YCO3·3H2O]+ is converted into 6-coordinated [Y(CO3)2·2H2O]−.
(3) When Y(III) is added to aqueous solutions, hydrated [Y·3H2O]3+ ions are preferentially formed, and [Y·3H2O]3+ exists as a coordination point. When CO32− ≤ 0.8 mol L−1, one CO32− passes through the second shell of the H2O molecules from the outer layer and enters the first shell to coordinate with Y(III). In this case, the effect of H2O molecule crowding is not noticeable. As CO32− is further increased, the second CO32− passes through the second shell and enters the first shell of Y(III), thereby replacing one of three hydrated H2O molecules in the form of a substitution reaction and initiating a bidentate coordination bond with Y(III). In this case, short-range CO32− space crowding causes the H2O molecule number around the short range of Y(III) to be reduced by 1–2.
Conflicts of interest
There are no conflicts to declare.Acknowledgements
This work is supported by the National Natural Science Foundation of China (NSFC) (No. 51774155 and 51564017), and thanks to the outstanding doctoral training program of Jiangxi University of Science and Technology (No. 3105500030).References
- M. K. Jha, A. Kumari, R. Panda, J. R. Kumar, K. Yoo and J. Y. Lee, Hydrometallurgy, 2016, 165, 2–26 CrossRef CAS.
- Y. Xiong, W. Kuang, J. Zhao and H. Z. Liu, Sep. Purif. Technol., 2017, 179, 349 CrossRef CAS.
- M. Vogit, J. D. Rodriguez, B. Vallina, L. G. Benning and E. H. Oelkers, Chem. Geol., 2016, 43, 70 CrossRef.
- R. Safarbali, M. R. Yaftian and A. Zamani, J. Rare Earths, 2016, 34, 91–98 CrossRef CAS.
- X. L. Shen, M. M. Xing, Y. Tian, Y. Fu, Y. Peng and X. X. Luo, J. Rare Earths, 2016, 34(5), 458 CrossRef CAS.
- Y. Xiao, Z. Long, X. Huang, Z. Feng, D. Cui and L. Wang, J. Rare Earths, 2013, 31(5), 512 CrossRef CAS.
- T. Taketatsu, Anal. Chim. Acta, 1965, 32, 40 CrossRef CAS.
- T. Taketatsu, Bull. Chem. Soc. Jpn., 1963, 36(5), 549 CrossRef CAS.
- E. L. Tran, O. Klein-Bendavid, N. Teutsch and N. Weisbrod, Environ. Sci. Technol., 2015, 49(22), 13275–13282 CrossRef CAS.
- C. W. Noack, D. A. Dzombak and A. K. Karamalidis, Environ. Sci. Technol., 2014, 48(8), 4317 CrossRef CAS.
- K. H. Johannesson and W. B. Lyons, Limnol. Oceanogr., 1994, 39(5), 1141–1154 CrossRef CAS.
- M. E. Vasconcellos, S. M. R. Rocha, W. R. Pedreira, C. A. Queiroz and A. Abrao, J. Alloys Compd., 2008, 451(1), 426–428 CrossRef.
- V. Philippini, T. Vercouter, J. Aupiais, S. Topin, C. Ambard, A. Chausse and P. Vitorge, Electrophoresis, 2008, 29(10), 2041–2050 CrossRef CAS.
- V. Philippini, T. Vercouter and P. Vitorge, J. Solution Chem., 2010, 39(6), 747–769 CrossRef CAS.
- P. E. Reiller, T. Vercouter, L. Duro and C. Ekberg, Appl. Geochem., 2012, 27(2), 414–426 CrossRef CAS.
- T. Vercouter, P. Vitorge, N. Trigoulet, E. Giffaut and C. Moulin, New J. Chem., 2005, 29(4), 544 RSC.
- M. Maloubier, H. Michel, P. L. Solari, P. Moisy, M. A. Tribalat, F. R. Oberhaensli, M. Y. D. Bottein, O. P. Thomas, M. Monfort, C. Moulin and C. D. Auwer, Dalton Trans., 2015, 44(47), 20584–20596 RSC.
- Y. Jeanvoine, P. Miro, F. Martelli, C. J. Cramer and R. Spezia, Phys. Chem. Chem. Phys., 2012, 14, 14822–14831 RSC.
- L. Rao, D. Rai, A. R. Felmy and C. F. Novak, Actinide Speciation in High Ionic Strength Media, 1999, pp. 153–169 Search PubMed.
- P. Thakur, Y. Xiong and M. Borkowski, Chem. Geol., 2015, 413, 7 CrossRef CAS.
- I. Perssin, E. D. Risberg, P. D'Angelo, S. De Panfilis, M. Sandstrm and A. Abbasi, Inorg. Chem., 2007, 46, 7742–7748 CrossRef.
- O. Seo, J. Kim, A. Tayal, C. Song and L. S. R. Kumara, RSC Adv., 2019, 9, 21311–21317 RSC.
- F. Martelli, Y. Jeanvoine, T. Vercouter, C. Beuchat, R. Vuilleumier and R. Spezia, Phys. Chem. Chem. Phys., 2014, 16, 3693–3705 RSC.
- Z. F. Tong, Y. B. Xie and Y. H. Zhang, J. Mol. Liq., 2018, 259, 65–75 CrossRef CAS.
- J. Tang and K. H. Johannesson, Chem. Geol., 2010, 279(3), 120 CrossRef CAS.
- Y. Cheng, Z. Yang, J. Liao, J. Qiu, Z. Song and Y. Yang, J. Rare Earths, 2015, 33, 599–603 CrossRef CAS.
- Y. M. Yang, X. L. Zhang, L. Li, T. M. Wei and K. Z. Li, ACS Omega, 2019, 4, 9160–9168 CrossRef CAS.
- M. T. Alhaffar, S. A. Umoren, I. B. Obot and S. A. Ali, RSC Adv., 2018, 8, 1764 RSC.
- P. Liang, C. Du, G. Li, X. Chen and Z. Liang, Int. J. Miner., Metall. Mater., 2009, 16(4), 407–413 CrossRef CAS.
- A. Saxena and D. Sept, J. Chem. Theory Comput., 2013, 9, 3538 CrossRef CAS.
- G. Hu, Y. Sun, Y. Xie, S. Wu, X. Zhang, J. Zhuang, C. Hu, B. Lei and Y. Liu, ACS Appl. Mater. Interfaces, 2019, 11, 6634–6643 CrossRef CAS.
- E. E. El-katori and A. S. Abousdem, RSC Adv., 2019, 9, 20760–20777 RSC.
- M. Zhou, T. Jiang, S. T. Yang and X. X. Xue, Int. J. Miner., Metall. Mater., 2015, 22(9), 917 CrossRef CAS.
- H. Tomono, H. Nada, F. Zhu, T. Sakamoto, T. Nishimura and T. Kato, J. Phys. Chem. B, 2013, 117, 14849 CrossRef CAS.
- D. Liu, J. Zhang, X. Xue, G. Wang, K. Jiang and Z. Liu, Int. J. Miner., Metall. Mater., 2016, 23(6), 618 CrossRef CAS.
- R. Hayes, G. G. Warr and R. Atlin, Chem. Rev., 2015, 115(13), 6657 CrossRef.
- H. Zhang, Y. Jiang, H. Yan, C. Yin, T. Tan and D. V. Spoel, J. Phys. Chem. Lett., 2017, 8, 2705–2712 CrossRef CAS.
- A. Bankura, V. Carnevale and M. L. Klein, J. Chem. Phys., 2013, 138, 014501 CrossRef.
- V. Migliorati, A. Serva, F. M. Terenzio and P. D'Angelo, Inorg. Chem., 2017, 56, 6214–6224 CrossRef CAS PubMed.
- V. Migliorati, A. Serva, F. Sessa, A. Lapi and P. D'Angelo, J. Phys. Chem. B, 2018, 122, 2779–2791 CrossRef CAS.
- I. C. Yeh and G. Hummer, J. Phys. Chem. B, 2004, 108(40), 15873 CrossRef CAS.
- S. C. Hess, F. A. Permatasari, H. Fukazawa, E. M. Schneider, R. Balgis, T. Ogi, K. Okuyama and W. J. Stark, J. Mater. Chem. A, 2017, 5, 5187–5194 RSC.
- S. Soumya, V. N. Sheemol, P. Amba, A. P. Mohamed and A. Solaiappan, Sol. Energy Mater. Sol. Cells, 2018, 174, 554–564 CrossRef CAS.
- F. Lai, G. Gao, L. Huang, Y. Xiao, R. Yang and K. Li, Hydrometallurgy, 2018, 179, 25–35 CrossRef CAS.
| This journal is © The Royal Society of Chemistry 2019 |

