
 Open Access Article
 This Open Access Article is licensed under a Creative Commons Attribution-Non Commercial 3.0 Unported Licence
An ionophore-based persistent luminescent ‘Glow Sensor’ for sodium detection†
Mark S. Ferris a,
Madeline R. Behr‡
a and
Kevin J. Cash*ab
a,
Madeline R. Behr‡
a and
Kevin J. Cash*ab
aChemical and Biological Engineering Department, Colorado School of Mines, Golden, CO 80401, USA. E-mail: kcash@mines.edu
bQuantitative Biosciences and Engineering, Colorado School of Mines, Golden, CO 80401, USA
First published on 15th October 2019
Abstract
Optical sensors have numerous positive attributes such as low invasiveness, miniaturizability, biocompatibility, and ease of signal transduction. Recently, there has been a strong research focus on using phosphorescent readout mechanisms, specifically from long-lifetime phosphorescent or ‘persistent luminescence’ particles, for in vitro and in vivo sensors. Persistent luminescence readouts can avoid cellular autofluorescence during biological monitoring, leading to an improved signal-to-noise ratio over a more traditional fluorescence readout. In this study, we show for the first time an ionophore-based optical bulk optode sensor that utilizes persistent luminescence microparticles for ion detection. To achieve this, we combined long-lifetime strontium aluminate-based ‘glow-in-the-dark’ microparticles with a non-fluorescent pH-responsive dye in a hydrophobic plasticized polymer membrane along with traditional ionophore-based optical sensor components to create a phosphorescent ‘Glow Sensor’. The non-fluorescent pH indicator dye gates the strontium aluminate luminescence signal so that it decreases in magnitude with increasing sodium concentration. We characterized the Glow Sensor in terms of emission lifetime, dynamic range, response time, reversibility, selectivity, and stability.
Introduction
Optochemical sensors, where a target analyte triggers an optically detectable change in the device (typically through absorbance or fluorescence readings), have advantages over electrochemical techniques that include low-invasiveness, spatial imaging, spectral multiplexing, and offline monitoring that make them ideal for many advanced biological applications. Of the many classifications of optochemical sensors, polymer-based ‘bulk optode’ sensors have proven to be robust devices capable of detecting analytes such as creatinine,1 sodium,2,3 potassium,4 calcium,3 lead,5 and lithium.6 Bulk optode sensors have a low cost of manufacturing and can be easily miniaturized into polymeric nanosensors7–11 for spatially-resolved sensing and imaging with low invasiveness since they remove the need for surgical implantation.For cation sensing, ionophore-based optical sensors (IBOS) offer a facile and tunable approach that can be utilized in both polymer-based bulk optodes2,6,12 and bulk optode-based nanosensors.7–11 IBOS typically consist of an ion-binding molecule (ionophore) for analyte recognition, an optical pH indicator, and a charge-balancing additive, all contained within a hydrophobic plasticized polymer matrix. The sensor response is based on well-established ion exchange theory13,14 that involves extracting the target cation from the sample to the sensor matrix to bind with the ionophore, causing deprotonation of the pH indicator and therefore a change in the sensor optical properties. The target analyte is determined by the choice of ionophore and the dynamic range of the sensor can be finely tuned to match a chosen application by using multiple pH indicators with appropriately spaced pKa's.6,15
Among the remaining issues to be addressed with polymer-based bulk optode sensors and nanosensors are signal attenuation and interference from biological autofluorescence and light scattering. Typically, organic fluorescent indicators have served as the pH indicators in these sensors, but organic indicators tend to suffer from poor tissue penetration and photobleaching from repeated stimulation with light. As an alternative to organic fluorescent indicating molecules, a few reports have demonstrated that brighter and more stable indicators can be used for signal transduction. These indicators tend to be chemically inert toward target molecules, but their signal can be gated by a non-fluorescent pH sensitive dye with a wide absorption spectrum, such as blueberry-C6-ester-652 (Blueberry dye) a concept demonstrated by Sahari et al.16 with quantum dots. In this setting, the target cation binds to the ionophore, causing deprotonation of the Blueberry dye, which in turn gates the luminescence of the signaling element. This concept has been demonstrated with quantum dots17–19 and has been extended to carbon dots.20
Signal interference from biological autofluorescence and light scattering has been addressed in other classes of sensors21–25 and in imaging techniques26–29 by using phosphorescent materials for signal transduction. Fluorescent indicators and background autofluorescence in biological samples have emission lifetimes in the range of 10−9 to 10−7 s,30 while phosphorescent indicators have longer emission lifetimes, ranging anywhere from microseconds to many hours.31 Therefore, by using a phosphorescent indicator and programming a delay between sensor excitation and emission collection, signal transduction from the sensor can avoid these background signals. Among a variety of materials that can display phosphorescent emission, of particular interest is ‘long-lifetime phosphorescent’ or ‘persistent luminescence’ particles, which come in the form of an ion-doped inorganic matrix and display exceptionally long luminescent lifetimes, typically on the order of hours or even days.32 In 2011, Wu et al. developed an assay for α-fetoprotein based on the modulation of Fluorescence Resonance Energy Transfer (FRET) between persistent luminescence particles and gold nanoparticle conjugates.33 Since then, persistent luminescence particles have been used as reporters in lateral flow assays,34 in immunoassays,35 for tumor imaging26 and therapy,36,37 and in sensors for select analytes such as ascorbic acid,21 avidin,22 2,4,6-DNA molecular hybrids,23 TNP,25 and cyanide24 through a variety of mechanisms.
In this paper, we formulate and characterize a persistent luminescence ‘Glow Sensor’ that is, to the best of our knowledge, the first use of persistent-luminescence particles as the signal transduction element in ionophore-based optical sensors. We describe bulk optode sensors for sodium detection as a proof-of concept instead of nanosensors due to the size of the persistent luminescence microparticles (15–35 μm) being larger than typical nanosensor diameters (∼180 nm), although the sensor mechanisms are the same. The sensor incorporates alkaline rare earth metal silicate-aluminate oxide europium doped microparticles and Blueberry dye into a plasticized polymer matrix along with the remaining IBOS components to create a sodium-selective sensor via the IBOS mechanism described earlier, but with the added step of Blueberry dye gating the persistent luminescence microparticle signal (Fig. 1). The Glow Sensor is reversible and highly selective against other potentially interfering cations such as potassium and lithium and has a steady response range over 14 days.
 | ||
| Fig. 1 Glow Sensor mechanism. A charge balancing additive holds the Blueberry dye in a protonated state in the absence of sodium. Sodium from the test sample is extracted into the sensor core where it binds with the ionophore. Charged sodium ions force the deprotonation of the Blueberry dye to maintain electroneutrality in the organic phase. When deprotonated, the Blueberry dye absorbs photon emission from the persistent luminescence microparticles, minimizing the observed phosphorescence. | ||
Results and description
To characterize the response to sodium, we exposed Glow Sensor spots (Fig. 2B, inset images) to a variety of solutions with different NaCl concentrations while recording luminescent emission from the spots with a fluorescence microscope. An automated program was run to open and close a shutter between the excitation source and the sample three times over the course of 150 s. We also exposed the Glow Sensor spots to 0.1 N HCl and 0.1 N NaOH to test the maximum and minimum response of the spots (i.e. fully protonated and deprotonated states of the Blueberry dye). Initially, four Glow Sensor spots were analyzed for Na+ responsiveness. The luminescence intensity emitted from the four individual spots during this automated program under different test conditions is shown in the left column of Fig. S1.† This figure also shows that these Glow Sensor components are well optimized since the fluorescence of the spots under the lowest NaCl test condition (10−7 M Na) is roughly the same as the fluorescence of the spots when the Blueberry dye is fully protonated under acidic conditions. Furthermore, when the spots are fully deprotonated under basic conditions, they have a luminescence only slightly above the background noise of the system (Fig. S2†). The Glow Sensor signal, when exposed to HEPES/TRIS buffer, persists above background levels on the minute scale (Fig. S3†).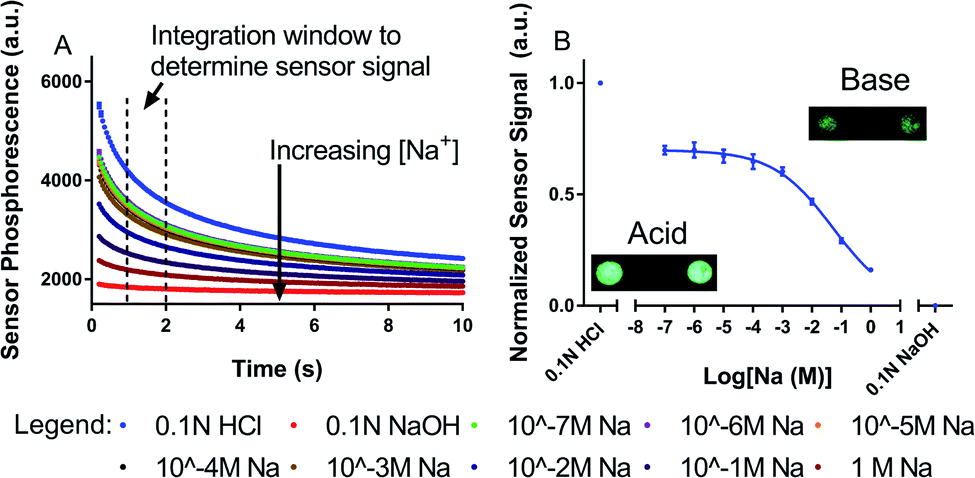 | ||
| Fig. 2 Signal analysis for Glow Sensor spots. The Blueberry dye in the sensor turns from clear to blue upon deprotonation, increasing the absorbance of the glow from the persistence luminescence microparticles, thereby decreasing the amount of measured luminescence in basic solution. Due to the presence of sodium ionophore, the addition of sodium causes the same deprotonation of the Blueberry dye. (A) Phosphorescent decay curves (n = 3) from a single sensor spot averaged together at increasing sodium concentrations. Dotted lines show area of integration used to calculate sensor response. (B) Dose/response curve showing average response to sodium of the four individual sensor spots. This shows that the sensor phosphorescence decreases as a function of sodium concentration. (B, inset) Images of the phosphorescent spots under acidic (bright) and basic (dim) conditions. | ||
Fig. 2A shows the phosphorescent decay curves for spot A (see the right column of Fig. S1† for the spots B, C, and D phosphorescent decay curves). The error bars in Fig. 2A show the variability in the three decay curves collected for each test condition. Most error bars are smaller than the size of the data point symbol and therefore are not visible, indicating that the decay dynamics are consistent when the Glow Sensor is fully excited. For signal transduction, we integrated under the curve of each phosphorescent decay from 1 to 2 s after blocking excitation, shown as the average of the normalized response of all four spots in Fig. 2B. The Glow Sensors respond to Na+ with a linear range from 2.4 mM to 414 mM Na+ and an α0.5 of 52 mM Na+, where α0.5 represents the Na+ concentration at the midpoint of the sensor's dynamic range and the concentration of maximum sensitivity. The Glow Sensor is more suitable for physiological monitoring than for trace detection, with a linear range encompassing the physiologically relevant concentrations of Na+ (135–150 mM).38
To confirm the response mechanism, we made two control optodes – one lacking the Blueberry dye, and one lacking the persistent luminescence microparticles. With no Blueberry dye, the spots have a luminescence on the same order of magnitude as the Glow Sensor spots (Fig. S4†) but have no response to sodium (Fig. S5,† left panel) as expected with no optical gating in the system. With no persistent luminescence microparticles, the optode has no phosphorescence, as expected (Fig. S5,† right panel). Only with both Blueberry dye and persistent luminescence microparticles present in the optode (along with the remaining sensing components) does the optode shows a distinct decrease in luminescence and phosphorescence in response to increasing Na+ concentration. Energy coupling is possible between Blueberry dye and persistent luminescence microparticles because the emission phosphorescent peak of the persistent luminescence microparticles overlaps with the wide absorbance spectrum of the Blueberry dye (Fig. S6†). Fig. S6† also shows that optode spots made without Blueberry dye do not change in their phosphorescence spectra between acidic and basic conditions, further confirming that Blueberry dye is necessary to change the phosphorescence intensity of the Glow Sensor spots. Energy coupling is likely due to either resonance transfer or the inner filter effect.
We also characterized the Glow Sensor in terms of response time, reversibility, selectivity, and stability (Fig. 3). The response time was investigated by equilibrating a single spot in 0 mM NaCl, then switching to a 100 mM NaCl solution and beginning an extended shutter program that alternately opens and closes the shutter for 15 min (see Fig. S7† for full luminescence intensity over the course of this experiment). The sensor signal was plotted against time and fit with a one phase exponential decay model to determine a t95 (i.e. the time it takes to reach 95% of equilibrium) of 9.6 min (Fig. 3A). While this response is slower than ideal for some biological applications, it is controlled by diffusion of the analyte into the optode membrane. This means that the response time will improve drastically with miniaturization into nanosensors – the subject of future study. A key advantage of the equilibrium-based mechanism of IBOS is that it leads to a reversible sensor which can be used to monitor analyte fluctuations in either direction. We tested the reversibility of four new Glow Sensor spots by exposing each to alternating solutions of 0 and 100 mM NaCl for a total of 10 measurements (steps). The sensor signal reliably decreased in the presence of Na+ and increased in 0 mM NaCl solution for 5 cycles, shown in Fig. 3B. The selectivity of the Glow Sensor toward the potentially interfering cations K+ and Li+ were also investigated, resulting in selectivity coefficients of −2.2 and −3.3, respectively. However, due to the minimal response to the off-target analytes (Fig. 3C), these are poorly constrained. The high selectivity of the Glow Sensor may be attributable to the binding strength of the ionophore, though the selectivity appears to be better than other ionophore-based sensors utilizing the same ionophore (NaIX).20 Finally, the stability of the Glow Sensor was investigated by analyzing the response of four spots over a period of two weeks (Fig. 3D). Minimal drift of the sensor response was as seen in this time frame. A Welch's t-test concluded that a significant decrease in the α0.5 occurred only between day 2 and 3 (Fig. S8†).
 | ||
| Fig. 3 Full Glow Sensor characterization. (A) Sensor signal after addition of 100 mM sodium. Response time of the sensor is 9.6 min (T95). (B) Reversibility of the sensor analyzed by exposing sensor to alternating solutions of 0 mM and 100 mM sodium. (C) The sensor is highly selective against the potentially interfering ions Li+ and K+. (D) The sensor response to sodium is stable over 14 days. | ||
The brightness of the Glow Sensor spots during analysis varied considerably from spot to spot throughout this work, likely because the size of the spots were not well controlled due to two factors. Tetrahydrofuran (THF), the medium of the optode cocktail solution, is highly volatile, leading to difficulty in reproducibly using small volumes to fabricate the spots (2 μL for all spots in this work). Also, the persistent luminescence microparticles used were 15–35 μm in size and were not small enough to be colloidally stable in solution, making the optode cocktail/microparticle ratio uneven during the spotting process. However, when the response of each sensor spot is normalized between the response to 10−7 M Na and 0.1 N NaOH, the difference between the spots is minimal (Fig. S9†). Furthermore, the datasets from collections of spots used for different experiments (Fig. 2B, 3C and D) have dose/response curves that are consistent with each other (Fig. S10†).
While the optode spots in this work serve as a crucial proof-of-concept for persistent luminescence detection, the mechanism will more useful for biological sensing and imaging with miniaturization into polymer-based nanosensors, the subject of future study. This requires nanosized persistent luminescence particles, which are not available commercially but have several reported synthesis routes.39–42 Nanosized persistent luminescent particles will have shorter emission lifetimes, but should still be long enough to avoid background noise from biological autofluorescence and scattering. An integration time of 1 to 2 s post-excitation was arbitrarily chosen in this work, but can be shortened to accommodate shorter lifetime persistent luminescence nanoparticles while still remaining long enough to avoid background signal.
Conclusions
In this work, we developed an ion selective ‘Glow Sensor’ by using persistent luminescence microparticles as an optical reporter with an ionophore-based detection mechanism for the first time. We show that the persistent luminescence microparticles couple with a pH-sensitive Blueberry dye so that the luminescence of persistent luminescent microparticles is increasingly quenched as Blueberry dye deprotonates in response to increasing Na+ concentrations. The optode spots are sensitive to sodium and highly selective against potentially interfering K+ and Li+ ions, but the selectivity can easily be changed toward a different ion target by choosing a different ionophore. The Glow Sensor is also reversible and the response is stable for at least 14 days. The response time for the sensor is ∼10 min which is less than ideal for most advanced applications, but this can be drastically improved with miniaturization of the spots into nanosensors, which is the focus of ongoing work.Conflicts of interest
There are no conflicts of interest to declare.Acknowledgements
This research was supported with start-up funds provided by Colorado School of Mines and the Department of Chemical and Biological Engineering. We would like to thank Keith Neeves, Yang Guo and Matthew Sorrells for help with configuration of the Olympus IX81 Fluorescence Microscope, Matt Sorrells for help with data transduction, and Megan Jewell for help with preparation of the manuscript.References
- M. M. Erenas, I. Ortiz-Gomez, I. de Orbe-Paya, D. Hernandez-Alonso, P. Ballester, P. Blondeau, F. J. Andrade, A. Salinas-Castillo and L. F. Capitan-Vallvey, ACS Sens., 2019, 4, 421–426 CrossRef CAS.
- H. Shibata, T. G. Henares, K. Yamada, K. Suzuki and D. Citterio, Analyst, 2018, 143, 678–686 RSC.
- G. Mistlberger, X. J. Xie, M. Pawlak, G. A. Crespo and E. Bakker, Anal. Chem., 2013, 85, 2983–2990 CrossRef CAS.
- M. Tenjimbayashi, H. Komatsu, M. Akamatsu, W. Nakanishi, K. Suzuki, J. P. Hill, S. Shiratori and K. Ariga, RSC Adv., 2016, 6, 14261–14265 RSC.
- M. Lerchi, E. Bakker, B. Rusterholz and W. Simon, Anal. Chem., 1992, 64, 1534–1540 CrossRef CAS.
- K. Suzuki, E. Hirayama, T. Sugiyama, K. Yasuda, H. Okabe and D. Citterio, Anal. Chem., 2002, 74, 5766–5773 CrossRef CAS.
- J. M. Dubach, M. K. Balaconis and H. A. Clark, J. Visualized Exp., 2011, 1–5 Search PubMed.
- T. T. Ruckh and H. A. Clark, Anal. Chem., 2014, 86, 1314–1323 CrossRef CAS.
- L. Tsagkatakis, S. Peper, R. Retter, M. Bell and E. Bakker, Anal. Chem., 2001, 73, 6083–6087 CrossRef CAS.
- X. J. Xie and E. Bakker, Anal. Bioanal. Chem., 2015, 407, 3899–3910 CrossRef CAS.
- K. J. Cash and H. A. Clark, Sensors, 2012, 9, 11922–11932 CrossRef.
- P. K. Patel and K. Y. Chumbimuni-Torres, Analyst, 2016, 141, 85–89 RSC.
- G. Mistlberger, G. A. Crespo and E. Bakker, Annu. Rev. Anal. Chem., 2014, 7, 483–512 CrossRef.
- K. Seiler and W. Simon, Anal. Chim. Acta, 1992, 266, 73–87 CrossRef CAS.
- M. S. Ferris, A. G. Katageri, G. M. Gohring and K. J. Cash, Sens. Actuators, B, 2018, 256, 674–681 CrossRef CAS.
- A. Sahari, T. T. Ruckh, R. Hutchings and H. A. Clark, Anal. Chem., 2015, 87, 10684–10687 CrossRef CAS.
- C. Xu and E. Bakker, Anal. Chem., 2007, 79, 3716–3723 CrossRef CAS.
- T. T. Ruckh, C. G. Skipwith, W. D. Chang, A. W. Senko, V. Bulovic, P. O. Anikeeva and H. A. Clark, ACS Nano, 2016, 10, 4020–4030 CrossRef CAS.
- J. M. Dubach, D. I. Harjes and H. A. Clark, J. Am. Chem. Soc., 2007, 129, 8418–8419 CrossRef CAS.
- A. A. Galyean, M. R. Behr and K. J. Cash, Analyst, 2018, 143, 458–465 RSC.
- N. Li, Y. H. Li, Y. Y. Han, W. Pan, T. T. Zhang and B. Tang, Anal. Chem., 2014, 86, 3924–3930 CrossRef CAS.
- Z. H. Zhou, W. Zheng, J. T. Kong, Y. Liu, P. Huang, S. Y. Zhou, Z. Chen, J. L. Shi and X. Y. Chen, Nanoscale, 2017, 9, 6846–6853 RSC.
- D. X. Li, J. Qin and G. Q. Yan, Sens. Actuators, B, 2018, 255, 529–535 CrossRef CAS.
- Y. Feng, D. Y. Deng, L. C. Zhang, R. Liu and Y. Lv, Sens. Actuators, B, 2019, 279, 189–196 CrossRef CAS.
- F. F. Li, F. Y. Wang, X. Hu, B. Z. Zheng, J. Du and D. Xiao, RSC Adv., 2018, 30, 16603–16610 RSC.
- J. Wang, J. L. Li, J. N. Yu, H. W. Zhang and B. B. Zhang, ACS Nano, 2018, 12, 4246–4258 CrossRef CAS.
- X. Zhen, Y. Tao, Z. F. An, P. Chen, C. J. Xu, R. F. Chen, W. Huang and K. Y. Pu, Adv. Mater., 2017, 29, 7 Search PubMed.
- Y. Wang, C. X. Yang and X. P. Yan, Nanoscale, 2017, 9, 9049–9055 RSC.
- X. Zhao, L.-J. Chen, K.-C. Zhao, Y.-S. Liu, J.-l. Liu and X.-P. Yan, Trends Anal. Chem., 2019, 118, 65–72 CrossRef CAS.
- I. Sanchez-Barragan, J. M. Costa-Fernandez, M. Valledor, J. C. Campo and A. Sanz-Medel, Trends Anal. Chem., 2006, 25, 958–967 CrossRef CAS.
- X. X. Wang, Z. T. Zhang, Z. L. Tang and Y. H. Lin, Mater. Chem. Phys., 2003, 80, 1–5 CrossRef CAS.
- R. E. Rojas-Hernandez, F. Rubio-Marcos, M. A. Rodriguez and J. F. Fernandez, Renewable Sustainable Energy Rev., 2018, 81, 2759–2770 CrossRef CAS.
- B. Y. Wu, H. F. Wang, J. T. Chen and X. P. Yan, J. Am. Chem. Soc., 2011, 133, 686–688 CrossRef CAS.
- A. S. Paterson, B. Raja, G. Garvey, A. Kolhatkar, A. E. V. Hagstrom, K. Kourentzi, T. R. Lee and R. C. Willson, Anal. Chem., 2014, 86, 9481–9488 CrossRef CAS.
- B. Y. Wu and X. P. Yan, Chem. Commun., 2015, 51, 3903–3906 RSC.
- F. X. Su, X. Zhao, C. Dai, Y. J. Li, C. X. Yang and X. P. Yan, Chem. Commun., 2019, 55, 5283–5286 RSC.
- Y. J. Li, C. X. Yang and X. P. Yan, Anal. Chem., 2018, 90, 4188–4195 CrossRef CAS.
- C. Xu, K. Wygladacz, R. Retter, M. Bell and E. Bakker, Anal. Chem., 2007, 79, 9505–9512 CrossRef CAS.
- Z. J. Li, Y. W. Zhang, X. Wu, L. Huang, D. S. Li, W. Fan and G. Han, J. Am. Chem. Soc., 2015, 137, 5304–5307 CrossRef CAS.
- J. L. Li, J. P. Shi, C. C. Wang, P. H. Li, Z. F. Yu and H. W. Zhang, Nanoscale, 2017, 9, 8631–8638 RSC.
- E. Teston, S. Richard, T. Maldiney, N. Lievre, G. Y. Wang, L. Motte, C. Richard and Y. Lalatonne, Chem.–Eur. J., 2015, 21, 7350–7354 CrossRef CAS.
- B. B. Srivastava, A. X. Kuang and Y. B. Mao, Chem. Commun., 2015, 51, 7372–7375 RSC.
Footnotes |
| † Electronic supplementary information (ESI) available: Supporting raw data and additional characterizations and figures. See DOI: 10.1039/c9ra05313a |
| ‡ Present address: Biomedical Engineering Department, Tulane University, New Orleans, LA 70118, USA. |
| This journal is © The Royal Society of Chemistry 2019 |