
 Open Access Article
 This Open Access Article is licensed under a Creative Commons Attribution-Non Commercial 3.0 Unported Licence
A study of the microbial metabolomics analysis of subsurface wastewater infiltration system
Lei Yang,
Yinghua Li *,
Fei Su and
Haibo Li
*,
Fei Su and
Haibo Li
School of Resources and Civil Engineering, Northeastern University, Shenyang 110819, China. E-mail: 1281822701@qq.com; liyinghua@mail.neu.edu.cn; 1005983937@qq.com; lihaibo@mail.neu.edu.cn
First published on 9th December 2019
Abstract
Microbial action in SWIS is one of the main ways to remove contaminants. Studying the metabolic processes and pathways of microorganisms is helpful to reveal the mechanism of pollutant removal in the “black box” process of SWIS. In this study, based on metabolomics and UPLC-MS, partial least squares (PLS-DA), principal component analysis (PCA) pattern recognition and cluster analysis were used to classify the microbial samples. According to the model's variable importance factor (VIP value) being greater than 1.5, a total of 53 potential biomarkers were screened out. There was a significant correlation between the microbial metabolites and soil profile. Most microbial metabolites were concentrated in the H2 layer (subsurface layer of SWIS), while there were relatively few in the H4 and H6 layers (middle and lower layers of SWIS); organic acids and alcohol metabolites mainly existed in the anoxic environment (H4 layer); antibiotics, growth hormones and pigments and other small molecule metabolites mainly existed under anaerobic conditions (H6 layer). The results of RDA analysis indicated that environmental factors had an effect on the microbial metabolites. With the variation of different height profiles, the metabolites were significantly affected by ORP and NO3−, which were negatively correlated. The above conclusions indicated that metabolomics is a reliable, accurate and effective method to quantitatively characterize the stability of SWIS.
1. Introduction
Subsurface Wastewater Infiltration Systems (SWIS) is a multi-phase coexisting sewage ecological treatment technology which involves physical, chemical and biological factors. With a low operating cost, SWIS is easy to maintain and manage to achieve a better treatment effect and gain ecological benefits.1 With water shortage becoming more and more serious and urgent, the theoretical research and application of SWIS have received more attention.In recent years, traditional flat techniques, PCR-DGGE, TGGE and other traditional bio-techniques, have been widely used in SWIS microbial population structure analysis. It is generally believed that it is convincing to use the spatial–temporal coordination of microorganisms to indicate whether SWIS is correctly operated or not. It has been widely accepted by the academic community to determine the microbial collaboration through accurate diagnosis of microbial structure and abundance.2 The microbial spatial distribution can reflect the microbial community cooperation state for a period of time; however, the microbial community cannot adjust quickly when the system deviates from the healthy conditions. Water quality will not immediately deteriorate.3 Therefore, using DNA molecular markers, gene sequence analysis and nucleic acid molecular hybridization to study the structural changes of SWIS flora is meaningful only for the steady-state. For multi-factor perturbation systems, the obtained biological information can be calibrated only for a relatively narrow period of time. Such methods are necessary but insufficient to characterize system health.4 Wang5 and Pan6 performed multi-section PCR-DEEG analysis on SWIS under fluctuating hydraulic loads. It was found in the study that the acquired microbial spatial structure data could indicate population characteristics of no more than 24 h under low hydraulic load (8 cm d−1). The DNA data of the same layer changed greatly when the hydraulic load fluctuated in the range of ±2 cm d−1. The results of instantaneous PCR-DGGE showed that there were some defects in characterizing the spatial structure of microorganisms under dynamic conditions. Therefore, it is unreasonable to judge the healthy status of SWIS. Tan7 used DNA fingerprint and real-time fluorescence quantitative techniques to analyze the vertical distribution of microbial flora in multi-media capillary infiltration system under 360 d continuous operations. It is shown that dominant nitrification gene communities such as ANO and qnorB were concentrated in the ascending zone under steady-state conditions while dominant gene communities such as amoA and narG were concentrated in the gravity flow zone. When the disturbance occurred (even if it is not severe), the spatial distribution of genes in the same flow region were relatively disordered (amoA appeared in the ascending flow region). The research above showed that there was a significant theoretical defect in characterizing SWIS health by using the response relationship between microbial structure and water quality.
Microbial metabolomics is a technique of functional genomics that is essential for understanding cellular functions. Metabolomics not only reflect the physiological state of cells but also indicate soil microbial diversity in details. Metabolomics can reverse infer microbial metabolic pathways and modes by potential marker. Metabolomics is precise and targeted.8 The reproducibility and stability of the UPLC-MS method were required in large-scale metabolomics study to ensure that the significant differences originate from inherent differences between groups rather than instrumental drift from chromatography and MS. While UPLC-MS was proved to be a powerful and highly sensitive method for soil, detecting more features.
The removal of pollutants in SWIS is closely related to the activities of soil microorganisms. Based on the difference of operating environment, the population structure and biological characteristics of microorganisms are deduced and verified. However, this method cannot obtain the metabolic process and decontamination mechanism under unknown conditions. Through the analysis of microbial metabolites revealing the microbial metabolic pathway in the substrate layer, it is possible to break through the long-term black box limitation of the biological removal theory of pollutants in SWIS. Therefore, in this study, the metabolites of different profiles were collected. After pre-treatment, statistical analysis and biological interpretation, specific metabolic fingerprints were obtained, the potential biomarkers were screened out and the species classification and metabolic pathway of microorganisms were explored.
2. Materials and methods
2.1. System description
As is shown in Fig. 1, three assemblies run in parallel. The influent conditions (organic load 400 mg L−1), soil matrix and operation conditions are consistent. The main body size of the device is 180 cm × 30 cm (high x diameter). The filling matrix is 5 cm thick gravel, 3 cm thick fine sand and 140 cm thick mixed matrix from bottom to top. The mixed matrix is composed of sand, slag and farmland soil in volume ratio of 10%![[thin space (1/6-em)]](https://www.rsc.org/images/entities/char_2009.gif) :25%:65%. SWIS porosity is 0.55 and permeability coefficient ranges from 4.167 × 10⁻⁵ ∼ 1.389 × 10⁻³ cm s−1. The water is pumped by a peristaltic pump and dispersed through a “cross” perforated distribution pipe (65 cm below the surface soil). The SWIS simulator waters in a dry-wet alternating manner (12 hours of influenting and 12 hours of drying). There are six groups of soil sampling ports: H1 (height 30 cm, aerobic), H2 (height 50 cm, aerobic), H3 (height 75 cm, facultative anaerobic), H4 (height 100 cm, facultative anaerobic), H5 (height 125 cm, anaerobic), H6 (height 150 cm, anaerobic) from top to bottom, which are sealed in peacetime and opened only at sampling time. Two parallel samples were taken from each height, and a total of 18 soil samples were taken.
:25%:65%. SWIS porosity is 0.55 and permeability coefficient ranges from 4.167 × 10⁻⁵ ∼ 1.389 × 10⁻³ cm s−1. The water is pumped by a peristaltic pump and dispersed through a “cross” perforated distribution pipe (65 cm below the surface soil). The SWIS simulator waters in a dry-wet alternating manner (12 hours of influenting and 12 hours of drying). There are six groups of soil sampling ports: H1 (height 30 cm, aerobic), H2 (height 50 cm, aerobic), H3 (height 75 cm, facultative anaerobic), H4 (height 100 cm, facultative anaerobic), H5 (height 125 cm, anaerobic), H6 (height 150 cm, anaerobic) from top to bottom, which are sealed in peacetime and opened only at sampling time. Two parallel samples were taken from each height, and a total of 18 soil samples were taken.
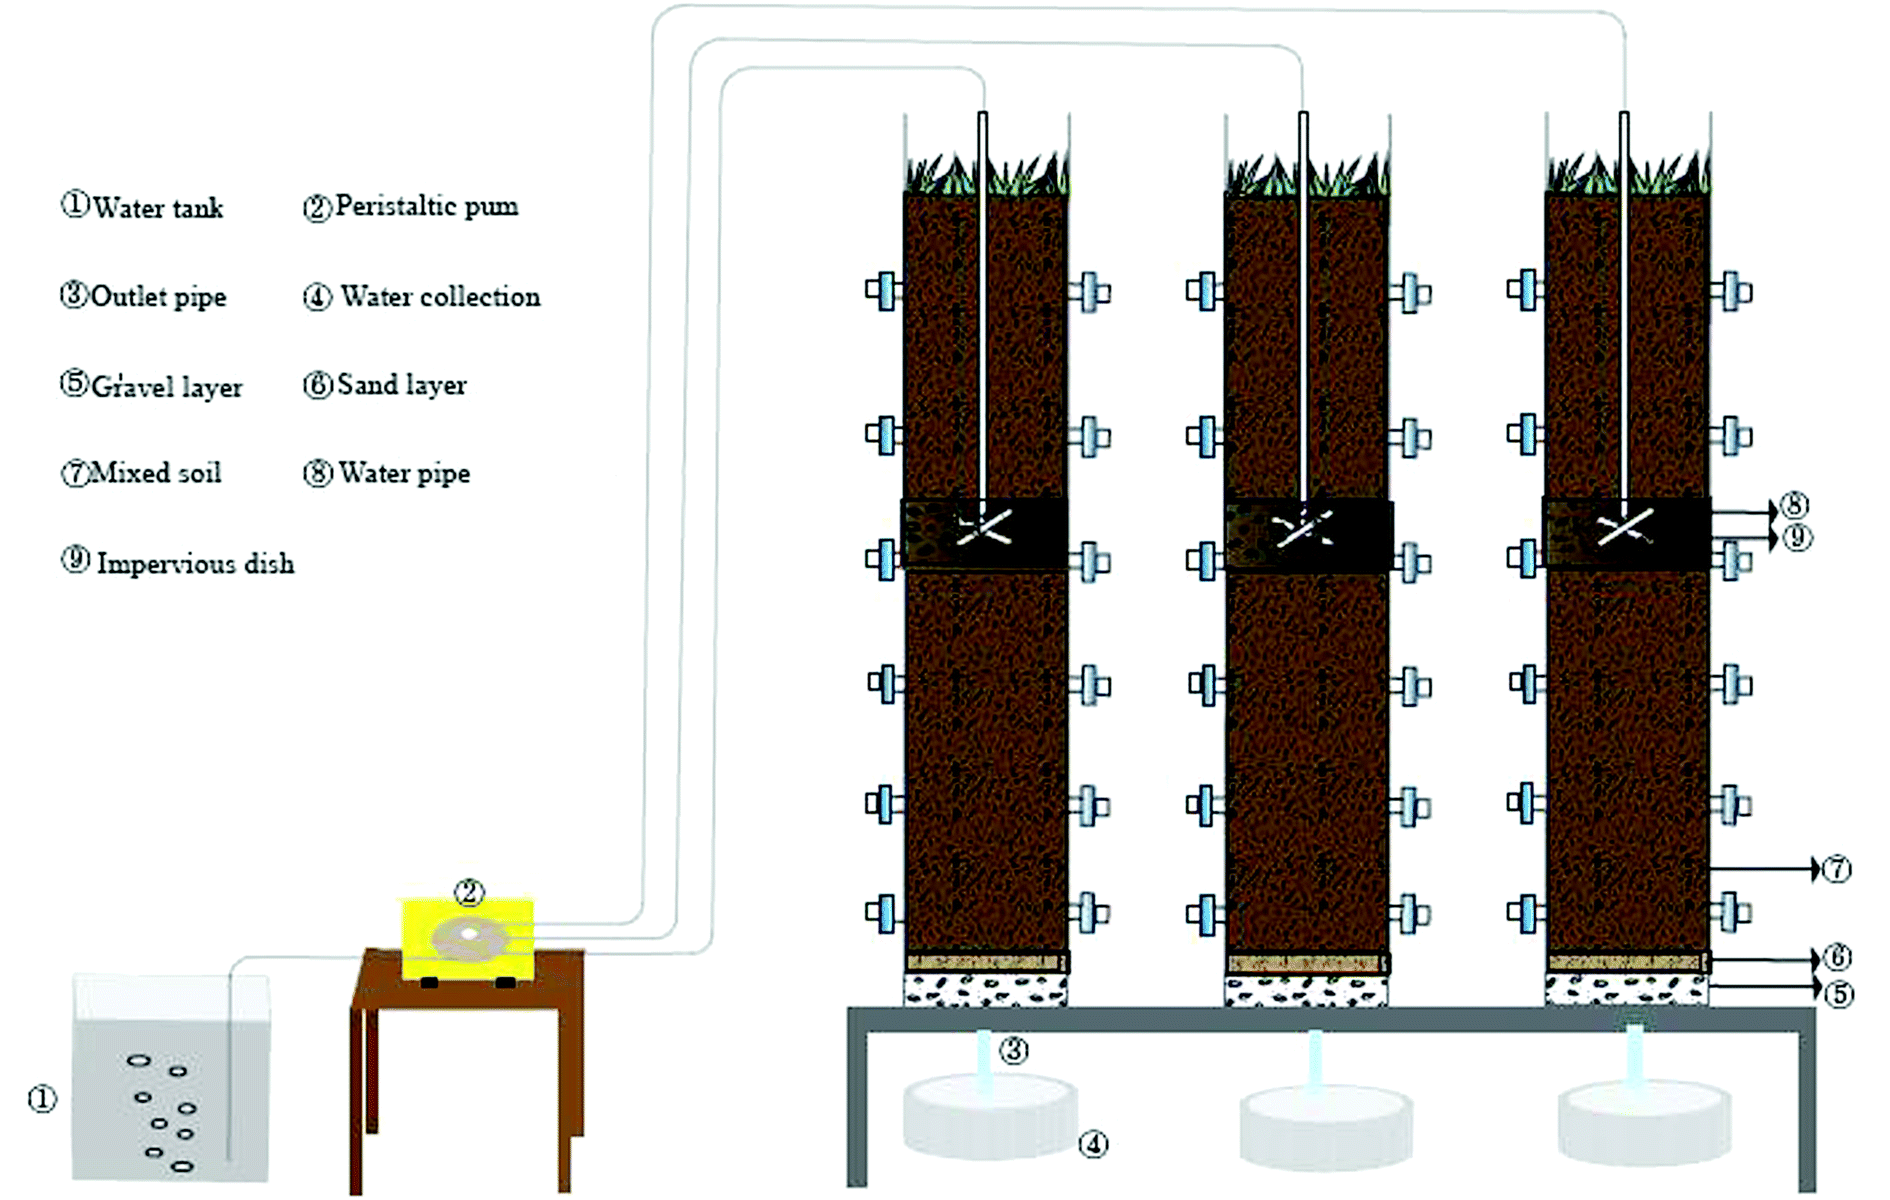 | ||
| Fig. 1 Diagram of SWIS simulation device (SWIS: subsurface wastewater infiltration system). | ||
2.2. Sample extraction
The collected soil samples are quickly inactivated with liquid nitrogen and extracted three times with pure methanol, 10 mL for each. The extract is combined and dried in vacuum. The supernatant is absorbed to resolve by 1 mL methanol and centrifuged for 10 minutes by 13000 rpm centrifuge. Then it is put into a 1.5 mL sampling vial. The samples are stored in a refrigerator at 4 °C for testing.
2.3. UPLC- MS analysis
Microbial metabolites were analyzed with the UPLC-MS system, including 1200 rapid liquid chromatography (Agilent), MicrOTOF-Q II electrospray, four stage time of flight mass spectrometry (Bruker Daltonics Inc). Based on the experimental study, the chromatographic conditions were optimized, and the samples were chromatograph separated. Agilent Zorbax SB-C18 reversed-phase column (3.5 μm, 100 mm × 2.1 mm) was injected. During the analysis, the injection volume was 5 μL and the column temperature was kept at 30 °C. Acidified water containing 0.1% (v/v) formic acid (Sigma Aldrich) and acetonitrile were used as eluent A and B. The flow rate for the mobile phase was set at 0.2 mL min−1 throughout the gradient. The following gradient profile was employed: 0–10 min, 15% B to 65% B; 10–15 min, 65% B to 80% B; 15–30 min, 80% B to 95% B; 30–38 min, 1% B to 99% B; 38–55 min, 99% B; 55–56 min, 99% B to 15% B.A dual ESI source was operated in positive ionization mode. The detailed MS conditions were as follows: drying gas temperature, 180 °C, flow, 6 L min−1; capillary voltage, 4500 V; auxiliary gas pressure 2.0 bar. Sodium standard solutions were used for off-line internal calibration. The collection range of mass-to-charge ratio was 50–1800 m/z.
2.4. Data processing
The software tool MZConvert (ProteoWizard) converted the initial data file into mzML format and performed peak integration and peak alignment processing. Noise and low abundance components were eliminated from the data matrix based on abundance and frequency of occurrence.9 After data processing, a two-dimensional matrix, consisting of retention time (RT) and mass-to-charge ratio (m/z) data pairs, were generated. The mass value and intensity of the peak were derived to Excel (2010, Microsoft, Washington, USA) for further chemometric analysis. Advanced processing functions such as molecular prediction and structural retrieval were implemented with data analysis processing software.2.5. Statistical analysis
Multivariate statistical analysis of data sets was performed with SIMCA-P software (version 14.1, UMETRICS, Ume, Sweden). PCA (unsupervised pattern recognition method) was applied to explore the intrinsic changes of data matrix. PLS-DA (supervised pattern recognition method) was used to filter discriminant molecular features from data sets.10 By extracting the maximum information from potential distinguishing features and sorting the data according to the abundance value, the most characteristic features were selected for further data clustering. Python 1.0 was constructed to clarify the differences of metabolites among different sample types. The quality of the model was represented by the classification error (CE). Then, PLS-DA was used to highlight markers that distinguish different soil profile. Based on physical separation of the scatter plots, the identification ions were manually determined and then were used to identify potential biomarkers.11 To identify the most relevant metabolic pathways in SWIS microorganisms, pathway analysis was used for KEGG metabolic pathway analysis. The projections (VIP) > 1.5 in PLS-DA were examined and selected as variable importance metabolites according to various statistical criteria for discriminating ability.2.6. Potential biomarkers identification
Identify the characteristic values of interest, such as accurate mass-to-charge ratio (m/z), strength, detection time, and match with METLIN metabolic database (https://metlin.scripps.edu). To elucidate the metabolic pathways of metabolites, compounds identified in the database were submitted to the KEGG pathway database. (http://www.genome.jp/kegg/pathway.html)3. Results
3.1. Analytic characteristics of soil metabolic profiling methods
UPLC-MS was used for soil metabolic profile analysis. Soils extracts were analyzed by UPLC-MS in positive and negative ionization modes simultaneously, but only the positive data was used for further analysis due to a lower signal to noise ratio than the negative data.12 After the removal of duplicate samples, a total of 1130 peaks, 180 clusters, and 698 singletons were identified across the 18 samples for the ESI (+) mode.Metabolic profile characterization and pattern recognition were used to analyze metabolites in SWIS. When the organic load is 400 mg L−1 (simulated column 2), typical chromatograms from UPLC-MS in ESI (+) modes was shown in Fig. 2. UPLC-MS analysis of soil extracts produced a complex spectrum characterized by the spectral characteristics of lipids, terpenes and sugars. There were more single peaks, higher resolution and more substances extracted in H6 profile.
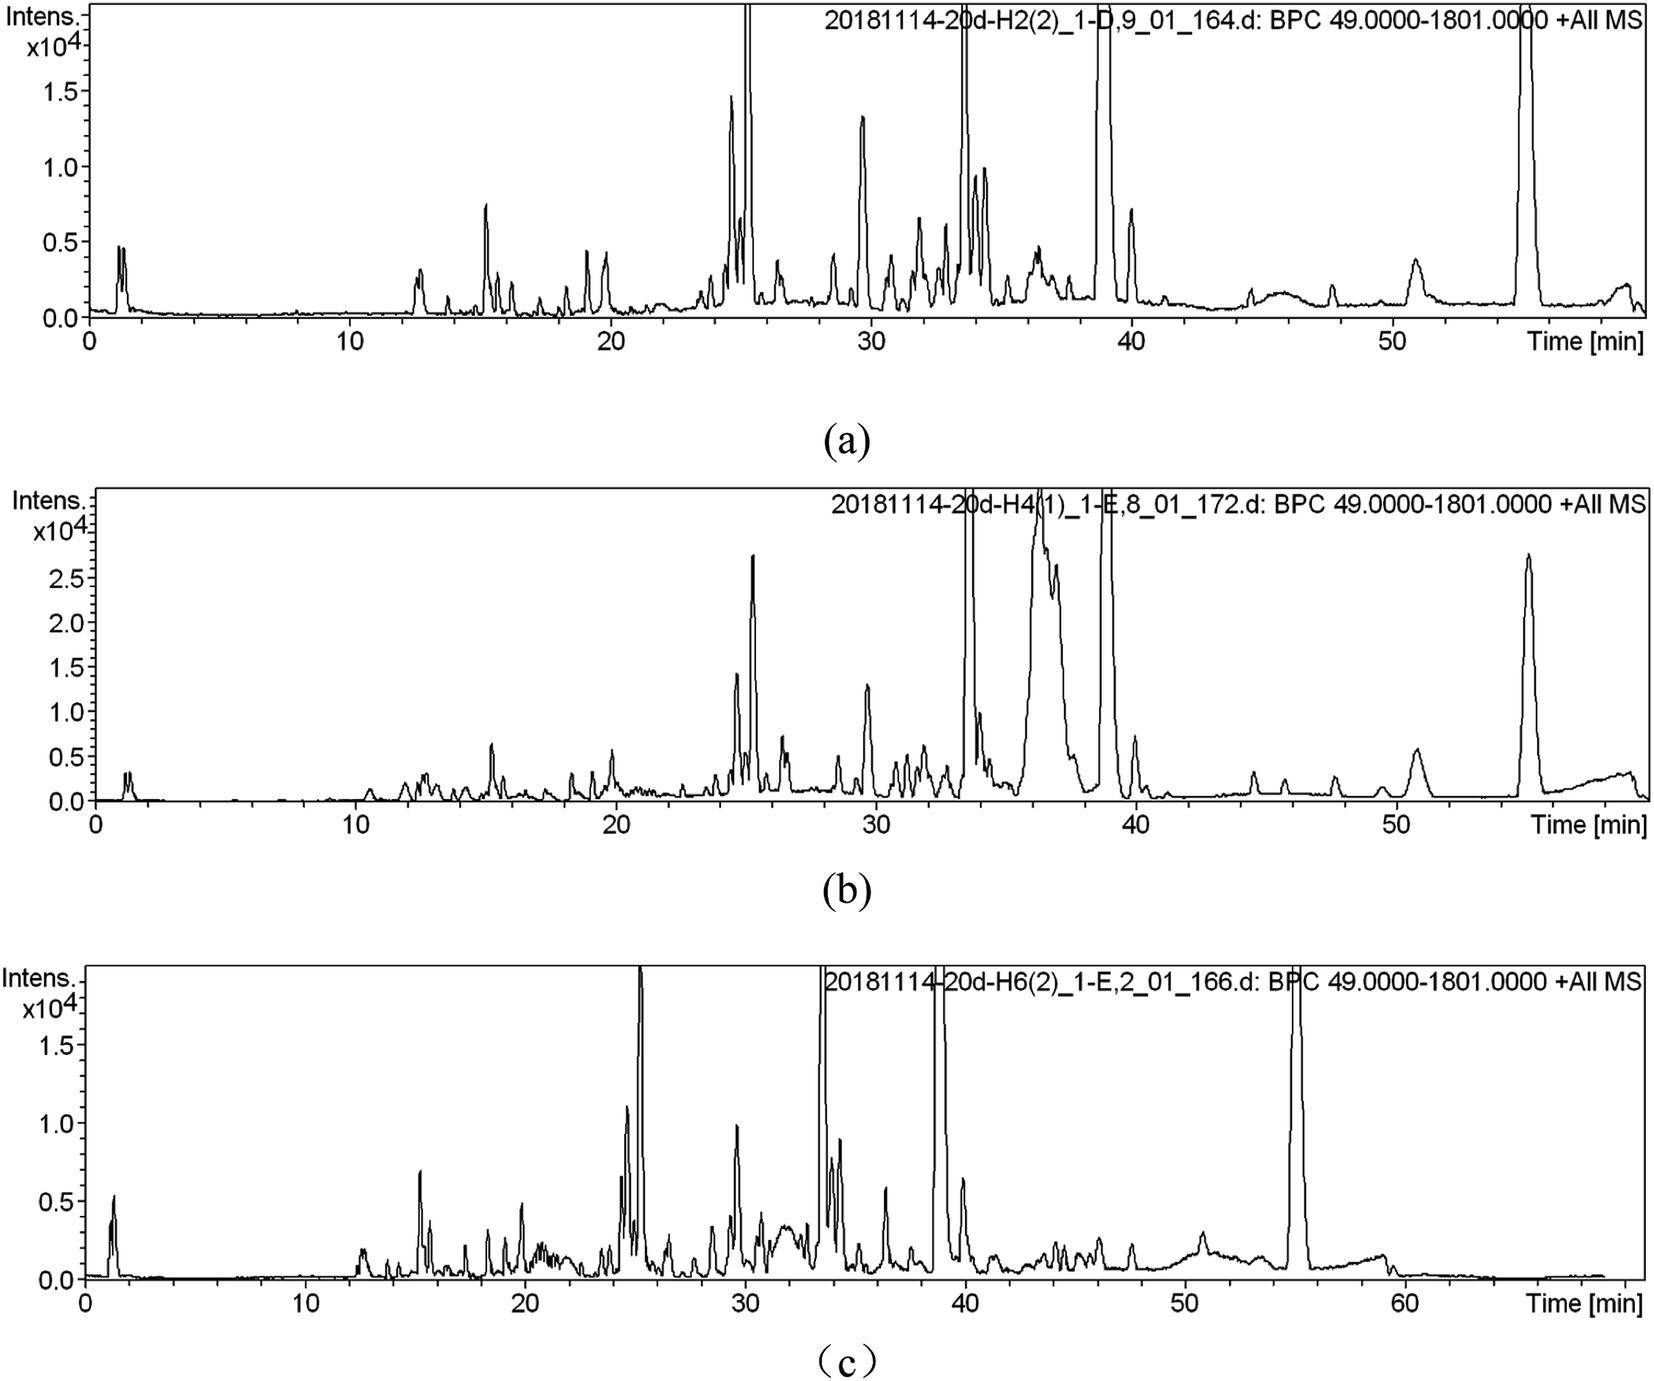 | ||
| Fig. 2 Metabolic fingerprints ((a) is the peak spectrum of height H2; (b) is the peak spectrum of height H4; (c) is the peak spectrum of height H6). | ||
3.2. Screening and identification of metabolite biomarker
The first step of potential biomarker discovery is to determine which metabolites in the community analyses are responsible for discriminating between samples. Using the established metabolomics analysis method collect the data of the positive ion (ESI+) pattern of soil samples, and obtain the TIC chromatogram of the corresponding metabolic profile (Fig. 2). Potential markers were found with PLS-DA corresponding to VIP values (important variable factors, variables with VIP > 1 indicates that their contribution to model grouping is higher than average).13 For PLS-DA data, the loadings plot showed that the soil profile height H2, H4, H6 metabolites had obvious differentiations. The organic load of SWIS was 400 mg L−1. The metabolites of microorganisms in soil samples from different profiles were analyzed by PLS-DA, and the metabolites of VIP > 1.5 were obtained as is shown in Table 1. The bigger the VIP value was, the greater the contribution to the classification of the model was, which could be used as one of the indicators for screening differential metabolites. These differential metabolites were selected as potential biomarkers, and then their structural patterns were screened and identified according to the database. Finally, there were 53 potential markers in different sections of the column, and five compounds with VIP value greater than 2 included fucoxanthin, pyrrhoxantrol, TG, calafatinine, 6-alpha methylprogesterone (Table 1).| No. | RT (s) | m/z | VIP | No. | RT | m/z | VIP |
|---|---|---|---|---|---|---|---|
| 1 | 1493.8 | 681.41 | 2.12466 | 28 | 1457.9 | 887.46 | 1.6701 |
| 2 | 1224.4 | 571.33 | 2.10899 | 29 | 1040.3 | 1006.45 | 1.66952 |
| 3 | 1492.8 | 1011.68 | 2.04646 | 30 | 1458.4 | 669.35 | 1.65405 |
| 4 | 1523.9 | 473.46 | 2.03173 | 31 | 1569.9 | 403.19 | 1.65263 |
| 5 | 2001.8 | 329.24 | 2.00053 | 32 | 1375.8 | 429.26 | 1.63427 |
| 6 | 1858.7 | 673.49 | 1.94785 | 33 | 2275.2 | 557.44 | 1.6301 |
| 7 | 1467.7 | 669.49 | 1.92935 | 34 | 1461.3 | 337.27 | 1.62736 |
| 8 | 1478.2 | 487.47 | 1.89518 | 35 | 76.3 | 444.07 | 1.62701 |
| 9 | 1831.1 | 921.66 | 1.87298 | 36 | 1435.9 | 675.43 | 1.62079 |
| 10 | 1468.9 | 485.46 | 1.87216 | 37 | 68.9 | 442.88 | 1.60818 |
| 11 | 1332.8 | 487.21 | 1.85782 | 38 | 1094.2 | 1054.44 | 1.60353 |
| 12 | 1483.8 | 671.50 | 1.84558 | 39 | 1076.5 | 577.18 | 1.60021 |
| 13 | 1055.7 | 968.41 | 1.81376 | 40 | 1370.1 | 661.41 | 1.56913 |
| 14 | 1474.2 | 275.08 | 1.8104 | 41 | 1216.8 | 969.39 | 1.56775 |
| 15 | 1449.0 | 427.25 | 1.80331 | 42 | 1362.3 | 487.36 | 1.54988 |
| 16 | 1551.9 | 429.26 | 1.79309 | 43 | 1460.0 | 664.40 | 1.54287 |
| 17 | 1735.7 | 339.29 | 1.78516 | 44 | 2064.3 | 693.55 | 1.53803 |
| 18 | 2042.9 | 803.54 | 1.78421 | 45 | 2321.8 | 750.55 | 1.53743 |
| 19 | 1056.6 | 1114.47 | 1.7838 | 46 | 1260.4 | 561.40 | 1.5288 |
| 20 | 2016.5 | 570.51 | 1.74516 | 47 | 1376.2 | 443.33 | 1.52863 |
| 21 | 1522.0 | 635.51 | 1.7068 | 48 | 1198.4 | 579.29 | 1.52798 |
| 22 | 1470.1 | 625.32 | 1.70528 | 49 | 1629.1 | 627.48 | 1.52358 |
| 23 | 1267.8 | 361.23 | 1.702 | 50 | 1993.8 | 701.52 | 1.51134 |
| 24 | 1283.9 | 321.19 | 1.69764 | 51 | 1195.9 | 301.14 | 1.50565 |
| 25 | 1050.8 | 946.43 | 1.68414 | 52 | 2065.1 | 715.53 | 1.50259 |
| 26 | 1199.7 | 319.22 | 1.68353 | 53 | 2041.7 | 429.24 | 1.5004 |
| 27 | 2068.4 | 702.21 | 1.67147 |
In this study, representative markers were selected and 1.5 was regarded as the critical value for screening. Potential biomarkers were screened according to screening limits. The structure derivation of potential markers mainly included the following steps: accurate molecular weight determination, conjecture structure, contrast database and correlate analysis. Given the isobaric nature of groups of these features and the similar putative molecular formulas it was anticipated that these molecules would be structurally related. Additional MS study of these features including accurate mass and fragmentation using MS approaches confirmed this and allowed the identification of a core subunit present in several of the biomarkers and tentative structure assignment for two features. Finally, 17 compounds were obtained by matching METLIN metabolomics database. The identification results were shown in Table 2. The main metabolites were amino acids, nucleotides, vitamins, antibiotics, growth hormones and pigments, which played an important role in microbial metabolism. The metabolites isolated from each soil sample reflected the chemical composition of the entire soil matrix. PLS-DA studies of soil organic matter showed that they contained a predominance of microbial, plant biopolymers and their degradation products,14 with microbial cells accounting for up to 50% of the total PLS-DA signal in some soil extracts.
| No. | RT (s) | m/z | METLIN ID | Metabolites | Formula | ppm | Adduct | VIP | CAS no. |
|---|---|---|---|---|---|---|---|---|---|
| 1 | 1890.5 | 529.4069 | 95599 |
Panaxynol linoleate | C35H54O2 | 10 | [M + NH4]+ | 1.64503 | 155551-18-1 |
| 2 | 1569.9 | 403.1872 | 48209 |
Hydroxyjasmonate glucoside | C19H30O7 | 22 | [M + H]+ | 1.61275 | |
| 3 | 1470.1 | 625.331 | 67681 |
Dauricine | C38H44N2O6 | 6 | [M + H]+ | 1.66134 | 524-17-4 |
| 4 | 1858.7 | 673.4838 | 40921 |
PC(16:0/18:2(9Z,12Z)) | C37H69O8P | 5 | [M + H]+ | 1.88499 | |
| 5 | 1362.3 | 487.4693 | 87378 |
8-Hydroxy-14,16-hentriacontanedione | C31H60O3 | 1 | [M + NH4]+ | 1.504 | 10368-07-7 |
| 6 | 2275.2 | 557.4376 | 89986 |
Germanicol cinnamate | C39H56O2 | 4 | [M + H]+ | 1.58054 | 65883-48-9 |
| 7 | 2001.8 | 329.2451 | 70181 |
6-Alpha-methylprogesterone | C22H32O2 | 22 | [M + H]+ | 1.94218 | 903-71-9 |
| 8 | 1458.4 | 669.35 | 43578 |
Capreomycin | C25H44N14O8 | 5 | [M + H]+ | 1.60104 | 1405-37-4 |
| 9 | 1460.0 | 664.40 | 44814 |
PG | C32H58NO11P | 18 | [M + H]+ | 1.50257 | 439904-33-3 |
| 10 | 1431.5 | 521.3192 | 80026 |
Soraphen A | C29H44O8 | 17 | [M + H]+ | 1.99833 | 122547-72-2 |
| 11 | 1094.2 | 1054.436 | 142 | Docosanoyl-CoA | C43H78N7O17P3S | 9 | [M + NH4]+ | 1.61866 | |
| 12 | 1457.9 | 887.472 | 89863 |
3-[2′′-Glucosyl-6′′-arabinosylglucoside] | C44H70O18 | 9 | [M + H]+ | 1.68747 | 244762-25-2 |
| 13 | 76.3 | 444.07 | 71657 |
L-Galacturonic acid calcium salt | C12H18CaO14 | 8 | [M + NH4]+ | 1.10803 | |
| 14 | 1449.0 | 427.2526 | 62994 |
Methylcarbamyl PAF C-8 | C18H39N2O7P | 9 | [M + H]+ | 1.82325 | |
| 15 | 2016.5 | 570.5129 | 41509 |
All-trans-retinyl stearate | C38H64O2 | 20 | [M + H]+ | 1.69468 | |
| 16 | 1493.8 | 681.4098 | 3685 | Fucoxanthin | C42H58O6 | 3 | [M + H]+ | 2.05245 | 3351-86-8 |
| 17 | 1492.8 | 1101.6748 | 38896 |
TG(20:5(5Z,8Z,11Z,14Z,17Z) | C65H96O6 | 3 | [M + H]+ | 1.98994 |
3.3. Analysis of correlative metabolic pathways of biomarkers
The information of the identified biomarker was introduced into the metabolic pathway analysis website (https://www.genome.jp/kegg/pathway.html) for analysis. KEGG combines a number of advanced pathway enrichment analysis procedures and pathway topology characterization to assist in determining the most relevant metabolic pathways associated with metabolic research.15Phospholipids are complex esters containing phosphoric acid groups and the main components of cell membranes in eukaryotes. It is widespread in microorganisms. It was clear to know in the metabolic pathway diagram (Fig. 3) that glycerol and fatty acids were produced by glucose metabolism and ethanolamine was decarboxylated to ethanolamine. The ethanolamine was methylated to choline. CTP was involved in the activation of choline, CDP-choline was formed, and then it was condensed with glycerol diester to form phosphatidylcholine (PC). CDP glycerol ester and phosphoglycerol were synthesized into phospholipid glycerol, which was then dephosphorylated to form phosphatidylglycerol (PG). The mechanism of microbial metabolism was studied by retrieving known metabolic pathways to identify compounds and regulators. Metabolic pathway diagrams visually presented the interaction in the metabolic process of products. It could express receptor-binding activities, protein complexes, phosphorylation reactions, enzyme activation and so on. It linked pathways with biological annotations to make the metabolic pathways of products clearer. The results showed that UPLC-MS could accurately and rapidly analyze the level of endogenous substances, which laid a solid foundation for further analysis of SWIS microbial metabolic differences based on targeted metabolomics.
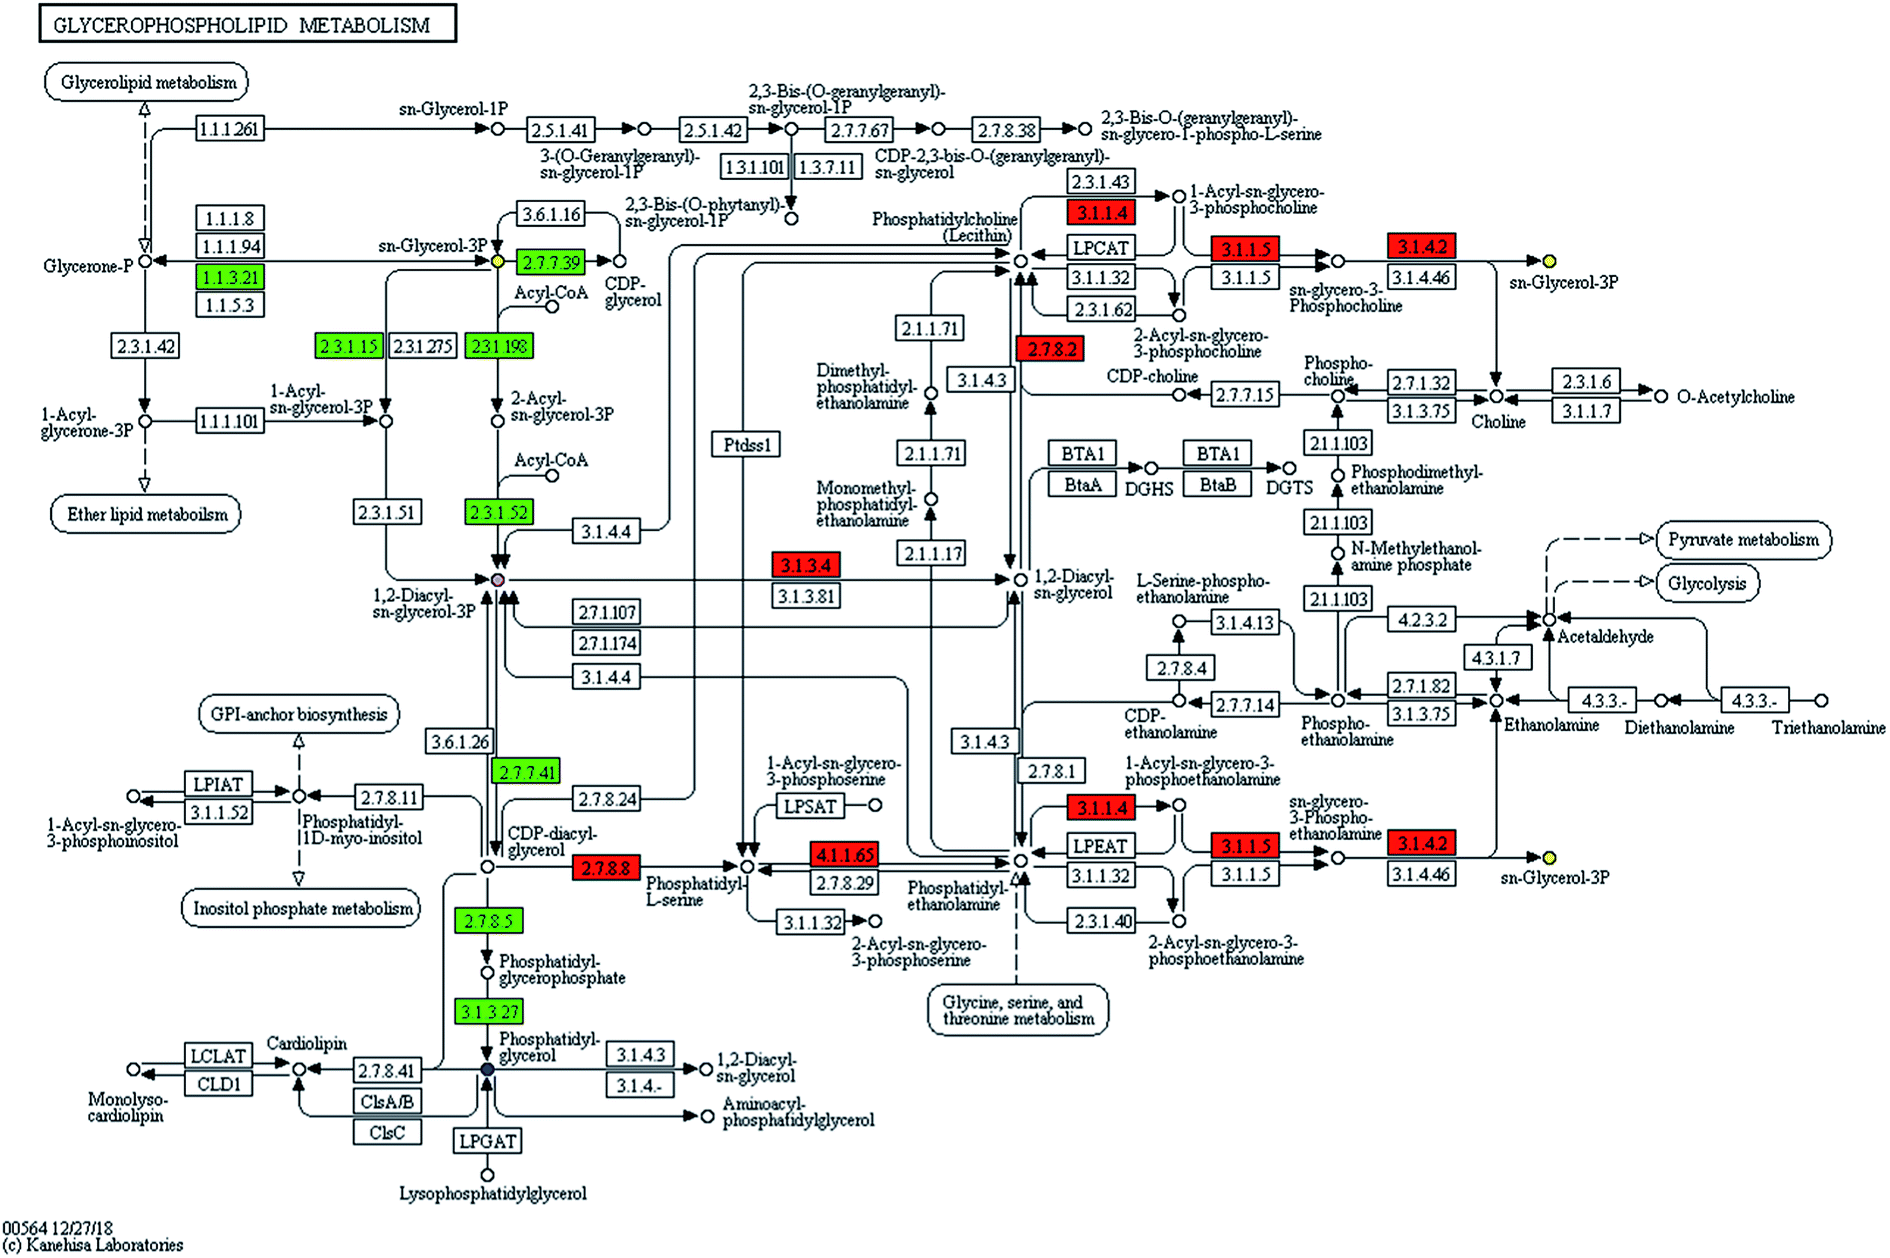 | ||
| Fig. 3 Metabolite pathways of selected compounds. | ||
3.4. Redundancy analysis of differential metabolites and environmental factors
In order to study the correlation between metabolites and environmental factors, redundancy analysis (RDA) was introduced. Based on the development of correspondence analysis, RDA is a sort method. It combines correspondence analysis with multiple regression analysis. Each step of calculation is regressed with environmental factors, which is also called multiple direct gradient analysis. RDA analysis could visually see the relationship between sample distribution and environmental factors.It could be seen from the angle between metabolites and environmental factors (Fig. 4) that environmental factors NH4+, NO2− had significant positive correlation with most metabolites. NO3−, ORP, COD and Salt had negative correlation with most metabolites. It could be seen from the angle between environmental factors that NO3−, ORP, COD and Salt were positively correlated; NO2− was negatively correlated with NH4+ and COD. The length of environmental factor rays showed that NO3− and COD had a great influence on the metabolites. At the same time, RDA sequence map reflected the adaptability of different microbial metabolites to environmental factors. The closer the position of metabolites in RDA sequence diagram, which indicated the more similar of their adaptability to environment. The results of RDA analysis indicated that environmental factors had an effect on microbial metabolites. With the variation of different height profiles, the metabolites were significantly affected by ORP and NO3−, which were negatively correlated.
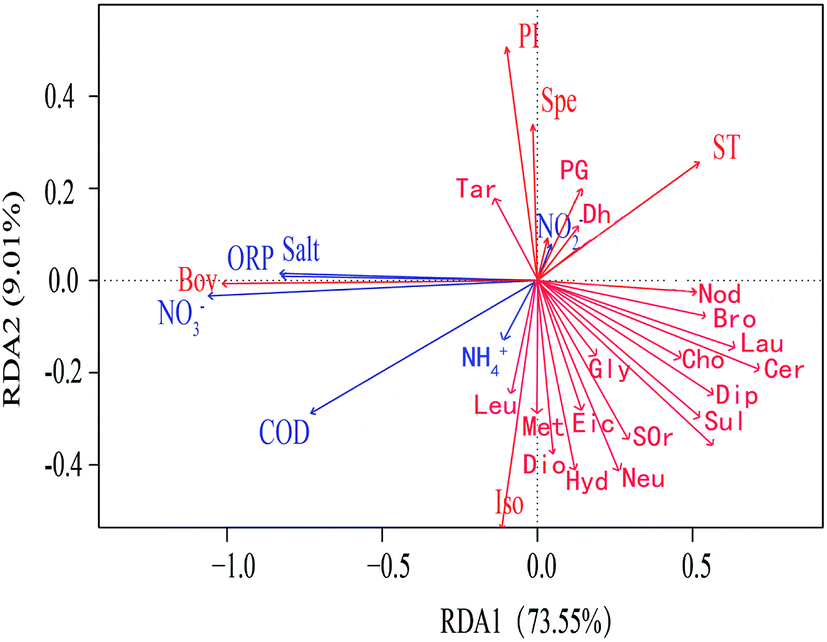 | ||
| Fig. 4 RDA analysis of differential metabolites and environmental factors in SWIS (note: the blue arrow in the figure represents different environmental factors, and the red arrow represents different metabolites. When the angle between the environmental factors is acute, it means that there is a positive correlation between the two environmental factors. The obtuse angle is a negative correlation. The names of metabolites in the figure are all abbreviated). | ||
4. Discussion
4.1. Principal component analysis
A large amount of data generated with analyzing samples through UPLC-MS system. In this case, stoichiometric analysis methods, including principal component analysis (PCA), partial least squares-discriminant analysis (PLS-DA) and clustering analysis, were introduced to process metabolite lists to reduce data dimension and improve data interpretability. In general, based on a linear combination of mutual features, PCA could reduce the matrix of metabolites. By analyzing the composition of different samples, the differences and distances between samples would be reflected. Variance decomposition was reflected the differences between groups of data on the two-dimensional coordinate map. The coordinate axis was two eigenvalues which could reflect the variance to the greatest extent. PCA studied the influence of SWIS profile height variable. PCA results of soil samples from different soil profiles were shown in Fig. 5.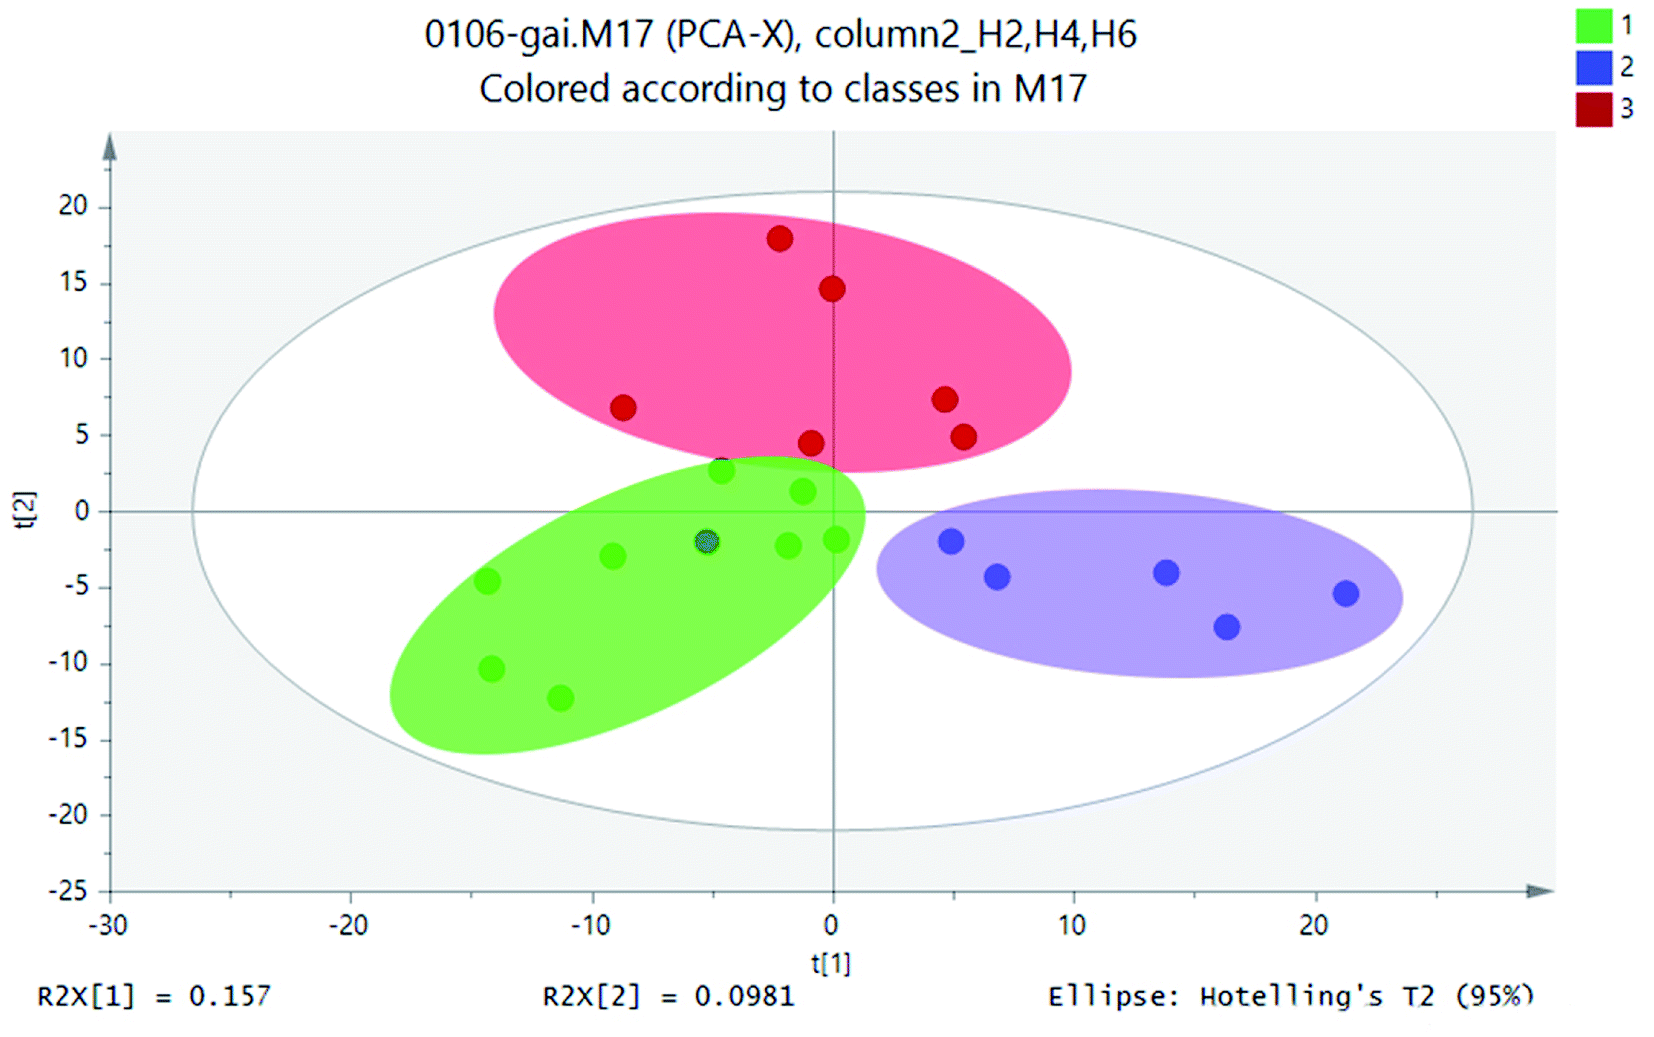 | ||
| Fig. 5 PCA scores scatter plot (green circle: height H2; blue square: height H4; red: height H6; gray ellipse is 95% confidence interval). | ||
Statistical analysis of the UPLC-MS metametabolomics data revealed that the soil extracts clustered based on different soil profiles (Fig. 5) for the 18 samples. The UPLC-MS metabolite profiles were compared for all samples by PCA. The soil sample H2 was on the left side of scoring map, and the height of H4 sample was on the right. The sample height H6 was in the middle of the two groups. The sample points of the same matrix profile of the simulated column were close and highly aggregated. The metabolite information of different matrix profiles was clearly separated. These three classifications were relatively separated from each other, which indicated that there were differences in metabolites between the height layers of the simulated column.
4.2. Partial least squares-discriminant analysis
PCA model was used to determine the distribution of metabolites in different sections of H2, H4 and H6. PLS-DA was used to indicate whether samples can be distinguished from specific factors, and the points far away from original were having the major contribution to the differences between different profiles. PLS-DA allowed sample discrimination to reduce the correlation between matrix dimensions and maximizing variables, and it could explain whether samples can be distinguished from specific factors. On the basis of PCA analysis, PLS-DA made the distinction between components more obvious and directive.16 PLS-DA was utilised for metabolite profiles to identify significantly different metabolites as putative biomarkers based on soil samples. Based on the metabolites detected in positive ion mode, the PLS-DA score plots were generated. Therefore, PLS-DA method was used to distinguish the differences of microbial metabolites at different heights and screen potential biomarkers.Similar ordination patterns were observed for the PCA of all samples, with 15.7% variation on PCA. Further separation based on profiles was evident on PCA, Samples of different soil layers formed separate clusters as in the ordination for UPLC-MS data.17 Soils for PLS-DA model based on metabolic profiles was constructed to determine if the distribution of metabolites could be predicted with any accuracy. As is shown in Fig. 5, the effect of sample discrimination was obvious. The heights of different soil sections H2, H4, and H6 were highly aggregated within a certain range, but there was a certain distance between them. The height of the sample point of height H2 was relatively close, indicating that the community composition and the material properties were similar. The heights of H4 and H6 were relatively scattered, which indicated that there were some differences in their material properties. The loadings plot (Fig. 6) illustrated the variables or metabolites that were responsible for the discrimination and clustering of the samples observed in the scores plots. In an ellipse with 95% confidence interval, three high soil samples were separated from each other by X-axis. PLS-DA model explained 13% of the total variation and showed excellent prediction function.
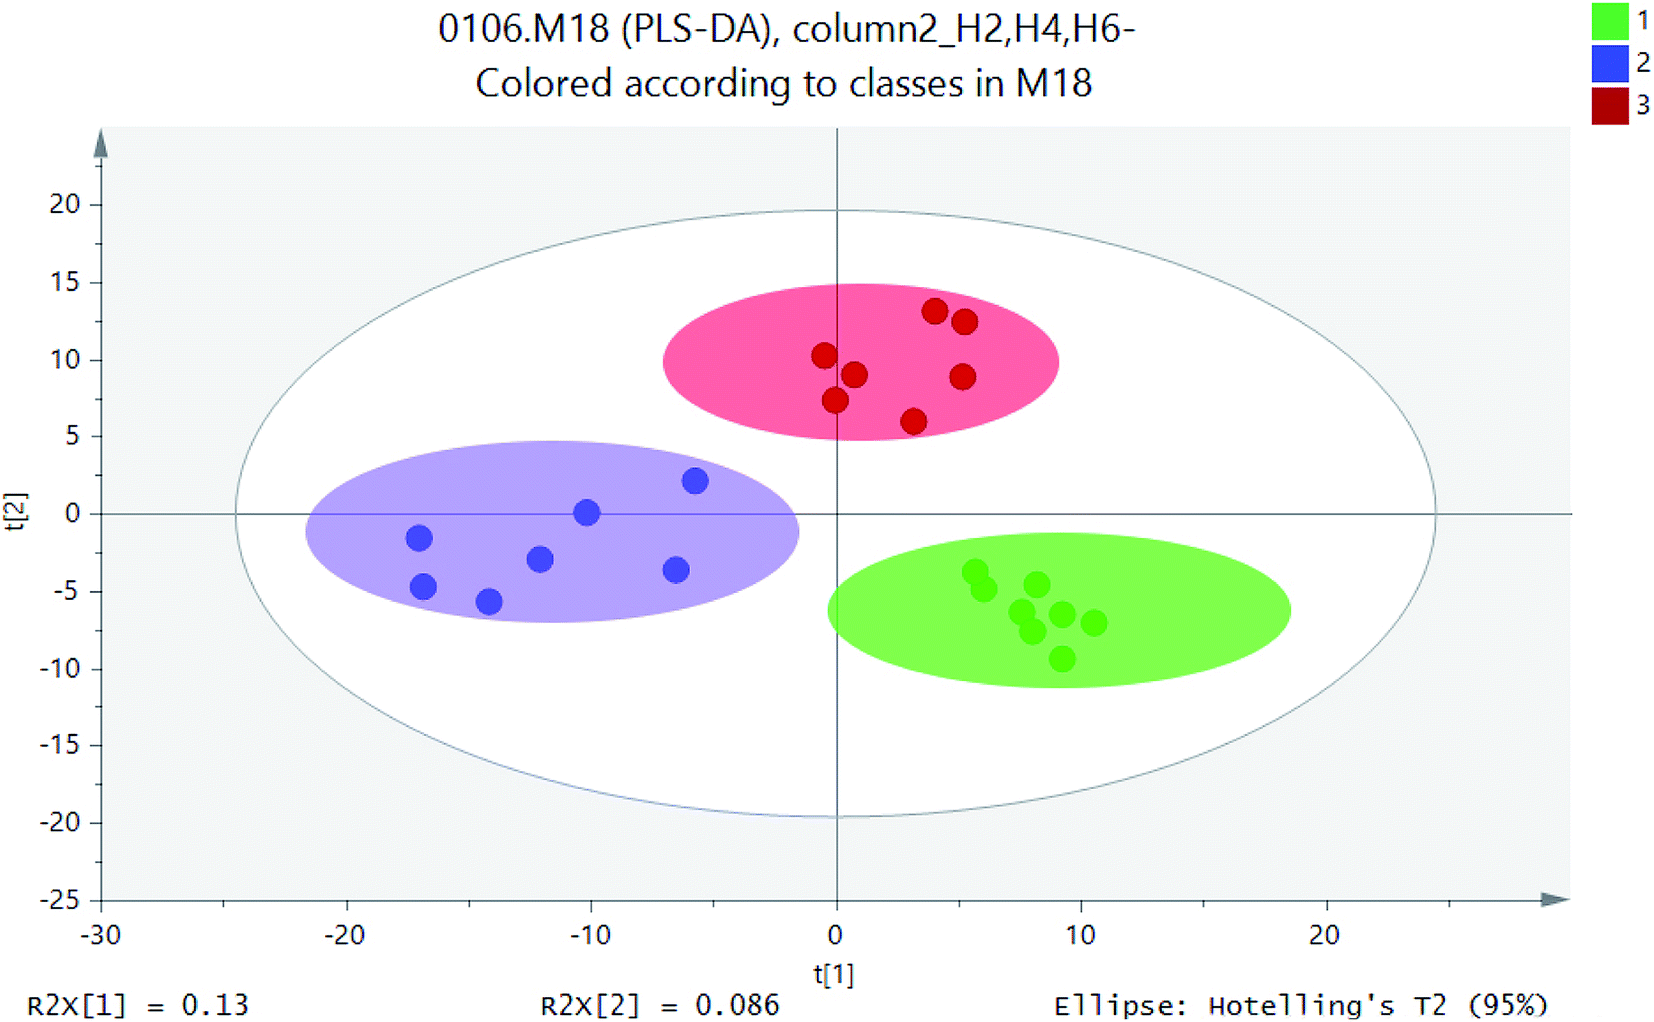 | ||
| Fig. 6 PLS-DA scores scatter plot (green circle: height H2; blue square: height H4; red: height H6; gray ellipse is 95% confidence interval). | ||
4.3. Hierarchical clustering analysis
A heat-map was constructed after biomarker identification (Fig. 7) to visualize the changes of these biomarkers in different soil heights. As shown in Fig. 7, colour differences exhibit that the metabolite alteration occur in different groups. In order to assess heterogeneity and determine the hierarchical structure of clusters, HCA (53 metabolite signal components) was constructed on the basis of metabolites to extract information about similarities and differences of metabolites. | ||
| Fig. 7 SWIS tree height and heat maps of different heights (color-coded scale indicates the relative abundance of each metabolite, red indicates a relatively abundant species, and blue represents a relatively abundance species). | ||
Multivariate analyses (PLS-DA and PCA) of the UPLC-MS spectra showed that the soil samples had different biochemical profiles and distinctive clustering patterns. Cluster analysis of soil samples with different heights and visualized thermal maps were presented in the form of tree maps. As is shown in Fig. 6, the metabolites were divided into two main clusters by height, with H2 as cluster 1 and H4 and H6 as cluster 2. Therefore, the chemical compositions of soil samples with H4 and H6 shared more similarity. Metabolites were divided into four main clusters by their own properties (ranking from top to bottom). cluster 1, cluster 2 and cluster 3 metabolites were mainly small molecular compounds and some polymers which played an important role in microbial metabolism, such as amino acids, nucleotides and vitamins. The main metabolites of cluster 4 were antibiotics, growth hormones and pigments. It was reported that agricultural soils contained more lipids and sugars while remnant soils had greater carbon pools with larger quantities of terpenetype molecules. This was consistent with the metabolites that were screened. Cluster analysis results were influenced by environmental impact factors (dissolved oxygen). Oxygen content was one of the main factors affecting the growth and distribution of microorganisms. According to ORP value, aerobic microorganisms were dominant when the height of soil column H2 is in the aerobic zone; H4 (middle layer of soil column) was in the facultative anaerobic zone; H6 (the lower layer) oxygen content decreases gradually and anaerobic microorganisms as the dominant group.18 Height H4 and H6 belong to anoxic or even anaerobic state so that the cluster analysis results of metabolites were divided into two main clusters. Cluster analysis revealed the diversity of metabolite profiles.19
As is shown in Fig. 8(A), when SWIS runs steadily, the ORP in H2 and H6 remained between 600–800 mV and −200 to −400 mV respectively; the ORP fluctuations at the matrix layer H4 decreased to 0–100 mV with distributing wastewater, and returned to the 200 mV level after drying and maintained alternating cycles.20 The aerobic environment of the system was restored in time by intermittent operation. The area above H2 was always aerobic, the microenvironment of H4 was anoxic–anaerobic, and the area of H6 was completely anaerobic. After drying, the interspace of the matrix bed seeps underwater and the water content decreases. Oxygen dioxide can be convective and diffused into the surface of the system. With the increase of dissolved oxygen content, SWIS oxidation–reduction micro-environment can be better maintained (as shown in Fig. 8(B)). According to the variation of ORP, it can be well explained that the metabolites of layer H4 were mainly organic acids and alcohols, while metabolites of layer H6 were antibiotics, growth hormones and pigments.
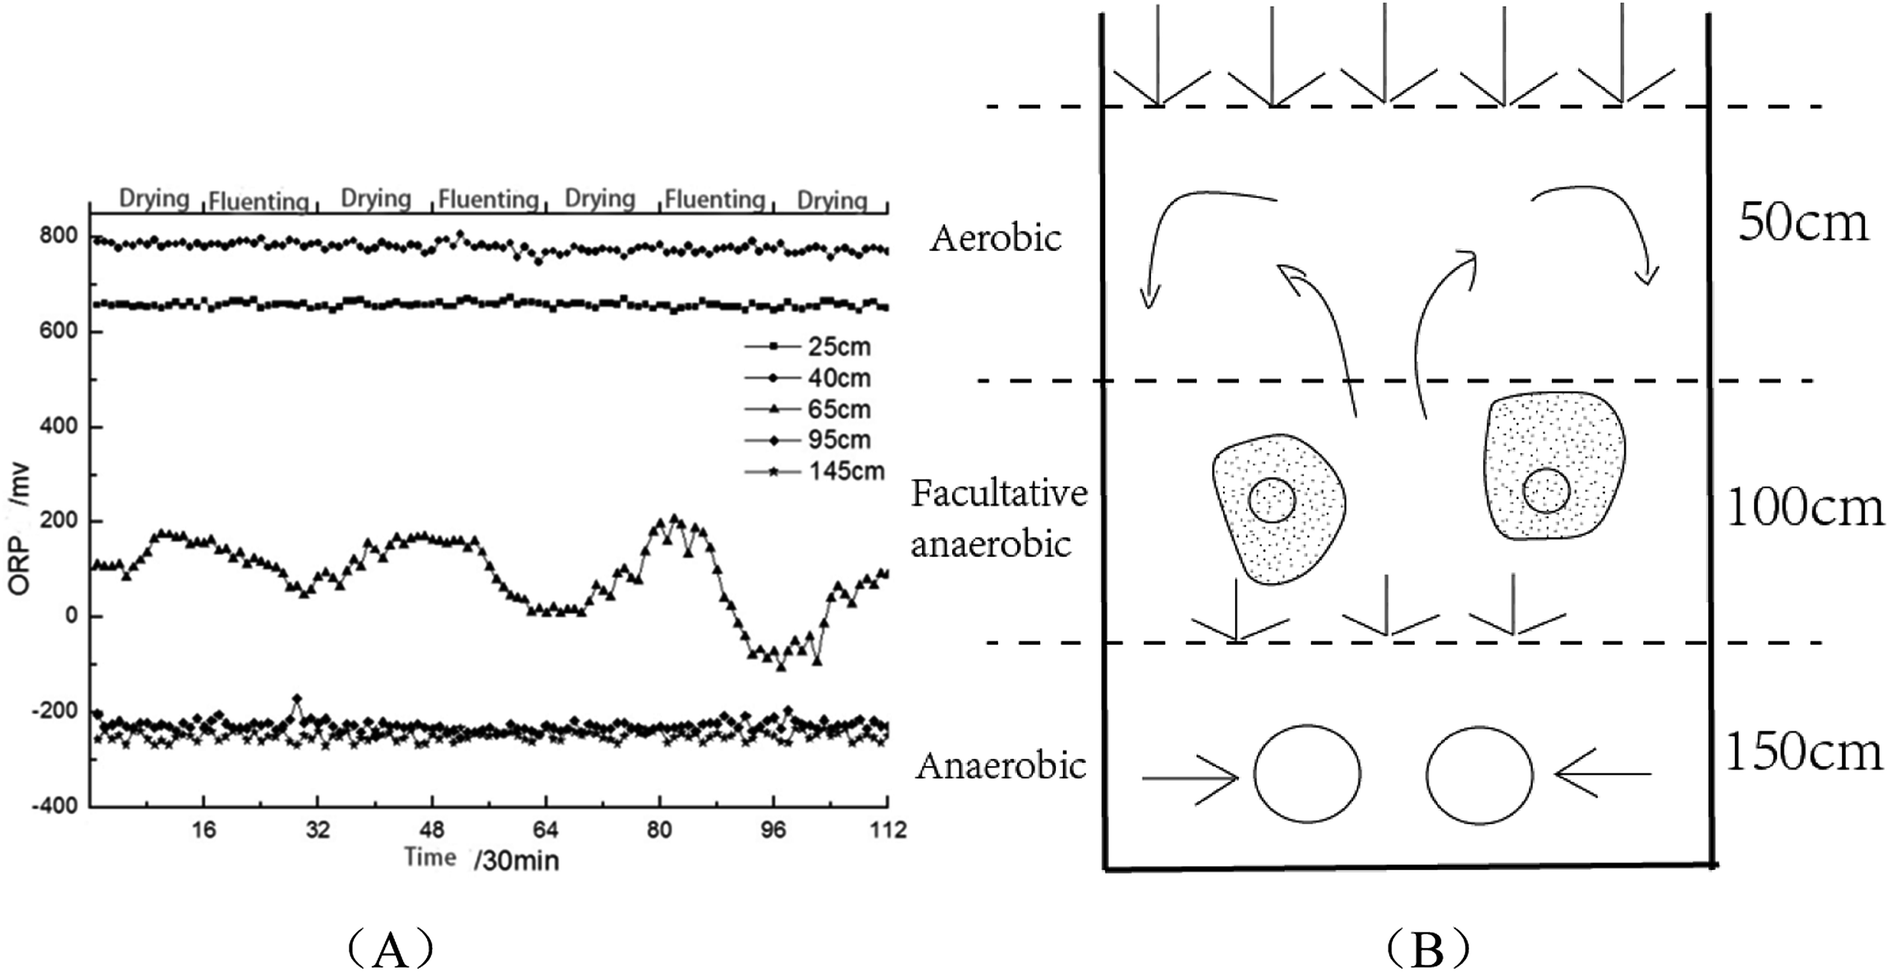 | ||
| Fig. 8 Trend diagram of OPR change (A) and partition diagram (B) in SWIS profile. | ||
5. Conclusion
Using UPLC-MS method to identify microbial metabolites of SWIS in different profiles was a non-targeted metabolomics fingerprint study. The biomarkers and metabolic pathways in different sections of SWIS were studied to understand the role of microorganisms in SWIS by multivariate statistical analysis. The relationship between environmental factors and microbial metabolites was studied by RDA analysis.The PLS model was selected with VIP > 1.5 as the screening threshold, and 53 potential biomarkers were screened. Seventeen compounds were identified by METLIN metabolomics database. As one of the factors affecting the growth and reproduction of microorganisms, ORP affected not only the activity of microorganisms but also the distribution of microorganisms and metabolites. The ORP value varied with the height of the profile. Metabolites were correlated with ORP in SWIS profile. The results showed that microbial metabolites were concentrated in the aerobic layer H2, organic acids and alcohols in the facultative anaerobic layer H4 and antibiotics, growth hormones and pigments in the anaerobic layer H6.
Conflicts of interest
There are no conflicts to declare.Acknowledgements
The authors would thank the anonymous reviewers for their careful review and valuable suggestions on the manuscript. Funding: this work is financially supported by the National Natural Science Foundation of China (no. 41571455).References
- J. Zhang, X. Huang, C. X. Liu, H. C. Shi, H. Y. Hu and Y. Qian, Pilot study on subsurface wastewater infiltration system applied in rural sewage treatment, Chin. J. Environ. Sci., 2002, 23(6), 57–61 Search PubMed.
- H. X. Fei, J. Pan, S. Y. Song, Y. Zhang, F. P. Zheng and J. X. Yu, Effect of Pretreatment on Physico-Chemical Parameters of Matrix and Pollutant Removals in Subsurface Wastewater Infiltration System, J. Donghua Univ., 2016,(6), 8 Search PubMed.
- Y. H. Li, H. B. Li, T. H. Sun and X. Wang, Effects of hydraulic loading rate on pollutants removal by a deep subsurface wastewater infiltration system, Ecol. Eng., 2011, 37(9), 1425–1429 CrossRef.
- D. V. Badri, J. M. Chaparro, R. Zhang, Q. Shen and J. M. Vivanco, Application of natural blends of phytochemicals derived from the root exudates of Arabidopsis to the soil reveal that phenolic-related compounds predominantly modulate the soil microbiome, J. Biol. Chem., 2013, 288(7), 4502–4512 CrossRef CAS PubMed.
- X. Wang, T. H. Sun, H. B. Li, Y. H. Li and J. Pan, Nitrogen removal enhanced by shunt distributing wastewater in a subsurface wastewater infiltration system, Ecol. Eng., 2010, 36(10), 1433–1438 CrossRef.
- J. Pan, F. Yuan, Y. Zhang, L. L. Huang, F. Cheng, F. P. Zheng and R. X. Liu, Nitrogen removal in subsurface wastewater infiltration systems with and without intermittent aeration, Ecol. Eng., 2016, 94, 471–477 CrossRef.
- Y. F. Tan, Molecular mechanism of nitrogen-transformation microecologicalprocess in multi-media ecological treatment system, Beijing, Peking University, 2011, pp. 47–89 Search PubMed.
- Y. Z. Guo, Y. P. Zhao, T. T. Zhu, J. Q. Li, Y. Feng, H. Z. Zhao and S. T. Liu, A metabolomic view of how low nitrogen strength favors anammox biomass yield and nitrogen removal capability, Water Res., 2018, 143, 387–398 CrossRef CAS PubMed.
- C. Willers, P. J. Jansen van Rensburg and S. Claassens, Can a metabolomics-based approach be used as alternative to analyse fatty acid methyl esters from soil microbial communities?, Soil Biol. Biochem., 2016, 103, 417–428 CrossRef CAS.
- H. L. Hayden, S. J. Rochfort, V. Ezernieks, K. W. Savin and P. M. Mele, Metabolomics approaches for the discrimination of disease suppressive soils for Rhizoctonia solani AG8 in cereal crops using 1H NMR and LC-MS, Sci. Total Environ., 2019, 651(1), 1627–1638 CrossRef CAS PubMed.
- R. Xiao, Y. Ma, D. J. Zhang and L. L. Qian, Discrimination of conventional and organic rice using untargeted LC-MS-based metabolomics, J. Cereal Sci., 2018, 82, 73–81 CrossRef CAS.
- T. H. Gao, Y. Xu, K. Wang, Y. F. Deng, Y. J. Yang, Q. P. Lu, J. L. Pan and Z. Q. Xu, Comparative LC-MS based non-targeted metabolite profiling of the Chinese mitten crab Eriocheir sinensis suffering from hepatopancreatic necrosis disease (HPND), Aquaculture, 2018, 491, 338–345 CrossRef CAS.
- H. Sun, L. Yang, M. X. Li, H. Fang, A. H. Zhang, Q. Song, X. Y. Liu, J. Su, M. D. Yu, T. Makino and X. J. Wang, UPLC-G2Si-HDMS untargeted metabolomics for identification of metabolic targets of Yin-Chen-Hao-Tang used as a therapeutic agent of dampness-heat jaundice syndrome, J. Chromatogr. B: Anal. Technol. Biomed. Life Sci., 2018, 1081–1082, 41–50 CrossRef CAS PubMed.
- A. J. Simpson, G. Song, E. Smith, B. Lam, E. H. Novotny and M. H. Hayes, Unraveling the structural components of soil humin by use of solution-state nuclear magnetic resonance spectroscopy, Environ. Sci. Technol., 2007, 41(3), 876–883 CrossRef CAS PubMed.
- C. X. Liu, C. Y. Gu, W. Huang, X. Sheng, J. Du and Y. B. Li, Targeted UPLC-MS/MS high-throughput metabolomics approach to assess the purine and pyrimidine metabolism, J. Chromatogr. B: Anal. Technol. Biomed. Life Sci., 2019, 1113, 98–106 CrossRef CAS PubMed.
- A. F. Nassar, T. Wu, S. F. Nassar and A. V. Wisnewski, UPLC-MS for metabolomics: a giant step forward in support of pharmaceutical research, Drug Discovery Today, 2017, 22(2), 463–470 CrossRef CAS PubMed.
- J. Aszyk, H. Byliński, J. Namieśnik and A. Kot-Wasik, Main strategies, analytical trends and challenges in LC-MS and ambient mass spectrometry–based metabolomics, TrAC, Trends Anal. Chem., 2018, 108, 278–295 CrossRef CAS.
- H. B. Li, J. N. Bai, Y. H. Li, J. F. Ma, X. R. Zhang, Z. X. Yang and W. Yu, Characteristics of ORP variation in subsurface wastewater infiltration system (SWIS) under hydraulic loading rate (HLR) fluctuation, Desalin. Water Treat., 2019, 138, 49–56 CrossRef CAS.
- F. P. He, J. C. Zhai, L. Zhang, D. Liu, Y. Ma, K. Rong, Y. C. Xu and J. Z. Ma, Variations in gut microbiota and fecal metabolic phenotype associated with Fenbendazole and Ivermectin tablets by 16S rRNA gene sequencing and LC/MS-based metabolomics in Amur tiger, Biochem. Biophys. Res. Commun., 2018, 499(3), 447–453 CrossRef CAS PubMed.
- H. B. Li, Y. H. Li, X. Y. Xu, P. F. Wang and Y. C. Zhou, Effects of intermittent operation mode on nitrogen removal by an overland flow system: a pilot study, Ecol. Eng., 2014, 69, 192–195 CrossRef.
| This journal is © The Royal Society of Chemistry 2019 |