DOI:
10.1039/C9RA05284D
(Paper)
RSC Adv., 2019,
9, 31936-31942
Crystal alignment of a LiFePO4 cathode material for lithium ion batteries using its magnetic properties†
Received
10th July 2019
, Accepted 29th September 2019
First published on 8th October 2019
Abstract
We suggest a way to control the crystal orientation of LiFePO4 using a magnetic field to obtain an advantageous structure for lithium ion conduction. We examined the magnetic properties of LiFePO4 such as magnetism and magnetic susceptibility, which are closely related to the crystal rotation in an external magnetic field, and considered how to use these properties for desired crystal orientation; thus, we successfully fabricated the crystal-aligned LiFePO4, in which the b-axis was highly aligned perpendicular to the surface of a current collector. Considering the low lithium ion conductivity of LiFePO4 inherently originated from its one-dimensional path for lithium ion diffusion, the crystal-aligned LiFePO4 potentially facilitates favorable transport kinetics for lithium ions during the charge/discharge process in lithium ion batteries. The crystal-aligned LiFePO4 should afford lower electrode polarization than pristine LiFePO4, and thus the former consistently exhibited higher reversible capacity than the latter.
Introduction
LiFePO4 is known as one of the most promising cathode materials for lithium ion batteries due to its intrinsic advantages such as high theoretical capacity, high safety, low toxicity, and low cost. However, low lithium ion conductivity is the major disadvantage, which gives rise to a capacity loss at high charge/discharge current density, thus prohibiting LiFePO4 from being a commercially feasible cathode material. The low lithium ion conductivity is well known to occur because of the one-dimensional tunnel for lithium ion diffusion along the b-axis in a LiFePO4 olivine structure.1–9 Many research groups have reported that lithium ion hopping along the b-axis is preferable in the olivine structure due to the low activation barrier along the direction10–14 – the diffusive nature of lithium ions in LiFePO4 was proven by neutron diffraction and muon spin spectroscopy.15,16 Because of the high anisotropy of olivine LiFePO4, electrochemical performance is greatly dependent upon particle morphology. Many research groups have customized various LiFePO4 nanostructures such as nanowires,17,18 nanorods,16–22 nanoplates,11,23–26 and hollow spheres27–29 with crystal growth orientation along the [010] direction, because the nanostructures with large (010) plane can provide both a greater implantation surface area and a shorter diffusion path for lithium ions.
In the present study, we attempted to apply a magnetic field to LiFePO4, thus affording the highly aligned LiFePO4 crystals along the b-axis. Several research groups have tried to orient the crystal direction of LiCoO2 with a layered rock salt structure (i.e., α-NaFeO2 type) using a magnetic field – they achieved the perpendicular alignment of LiCoO2 interlayers onto a current collector, which contributes to easy access of lithium ions.30–33 As olivine LiFePO4 has more restrictive dimension for lithium ion diffusion than layered LiCoO2, the crystal alignment using a magnetic field might be more effective on LiFePO4. We investigated the magnetic properties of LiFePO4 such as magnetism and magnetic susceptibility, which decisively affect the crystal rotation under an external magnetic field, and considered how to use the properties for desired crystal alignment. We proved that the crystal alignment could be easily controlled by adjusting the vector quantity of a magnetic field. Based on the information, we designed the crystal alignment process using a strong magnetic field, thus successfully obtaining the LiFePO4 with high crystal alignment rate along the [010] direction. The crystal-aligned LiFePO4 with large (010) active planes is expected to provide a great implantation surface area and a short diffusion path for lithium ions. The aligned LiFePO4 potentially contributes to the fast lithium ion conduction during the charge/discharge process in lithium ion batteries, led to low electrode polarization, thus affording consistently higher reversible capacity than a pristine LiFePO4.
Experimental details
Reagents
Lithium hydroxide (LiOH·H2O, Kojundo Chemicals, 99.0%), iron(II) sulfate (FeSO4·7H2O, Kojundo Chemicals, 99.0%), and phosphoric acid (H3PO4, Tokyo Chemical Industry, >89.0 w/w%) served as the precursors of LiFePO4. Ethylene glycol (C2H6O2, Tokyo Chemical Industry, >99.5%) was used to dissolve the precursors. Sucrose (C12H22O11, Sigma-Aldrich, ≥99.5%) was used to coat LiFePO4 surface with carbon. Conductive carbon (Super-P, MTI Korea), polyvinylidene fluoride (PVDF, MTI Korea), and N-methylpyrrolidone (NMP, Tokyo Chemical Industry, >99.0%) were used to prepare an LiFePO4 slurry. All reagents were used without further purification.
Sample preparation
The LiFePO4 cathode active material was synthesized via a co-precipitation process. The precursors of LiFePO4 were dispersed in ethylene glycol. 0.12 mol of lithium hydroxide and 0.04 mol iron(II) sulphate were dissolved in 200 ml of ethylene glycol in Ar atmosphere. Then 0.04 mol of phosphoric acid dissolved in 100 ml of ethylene glycol was added dropwise. This mixture was stirred for 1 h, then heated up to 200 °C, and kept for 3 h for co-precipitation. The precipitate was centrifuged to separate from ethylene glycol, washed with anhydrous ethanol several times, and dried at 50 °C overnight. The as-prepared substance was mixed with ca. 15 wt% of sucrose and then annealed at 700 °C for 6 h in Ar atmosphere to produce carbon-coated LiFePO4. For electrode preparation, the carbon-coated LiFePO4 was mixed with the conductive carbon (Super-P) and binder (PVDF) at weight ratio 95![[thin space (1/6-em)]](https://www.rsc.org/images/entities/char_2009.gif) :3:2, respectively. The solvent (NMP) was then added and the mixture was blended using a homogenizer (T25 digital ULTRA-TURRAX Disperser, IKA). A resulting slurry was coated onto a current collector (Al foil, MTI Korea) and dried using a hot air (ca. 80 °C) to obtain a pristine LiFePO4 electrode (denoted as LFP below). In addition, the slurry coated onto a current collector was instantly placed in a cryogen free superconducting magnet system with a bore size of 150 mm (max. 6 Tesla, Cryomagnetics, Inc.) to apply a strong magnetic field for 1 min (ESI 1†). The slurry was then dried by passing a hot air through the magnet system, thus affording an LiFePO4 electrode treated with the magnetic field (denoted as mf-LFP below). Both the LFP and mf-LFP electrodes were pressed using a calendering machine for uniform film thickness and robust adhesion on current collectors and they were dried at 120 °C under vacuum overnight.
:3:2, respectively. The solvent (NMP) was then added and the mixture was blended using a homogenizer (T25 digital ULTRA-TURRAX Disperser, IKA). A resulting slurry was coated onto a current collector (Al foil, MTI Korea) and dried using a hot air (ca. 80 °C) to obtain a pristine LiFePO4 electrode (denoted as LFP below). In addition, the slurry coated onto a current collector was instantly placed in a cryogen free superconducting magnet system with a bore size of 150 mm (max. 6 Tesla, Cryomagnetics, Inc.) to apply a strong magnetic field for 1 min (ESI 1†). The slurry was then dried by passing a hot air through the magnet system, thus affording an LiFePO4 electrode treated with the magnetic field (denoted as mf-LFP below). Both the LFP and mf-LFP electrodes were pressed using a calendering machine for uniform film thickness and robust adhesion on current collectors and they were dried at 120 °C under vacuum overnight.
Material and electrochemical characterizations
The temperature dependent magnetic susceptibility of LiFePO4 was measured using a commercial superconducting quantum interface device magnetometer (SQUID, MPMS XL-7, Quantum Design) in the temperature region of 2–298 K with a magnetic field of 0.1 T. X-ray diffraction (XRD) patterns of the LFP and mf-LFP electrodes were recorded using a D/MAX-2500 Diffractometer (Rigaku) using CuKα radiation (λ = 1.5406 Å) and a scintillation counter detector. The XRD data were recorded over a 2θ range of 10–65° with step width of 0.02° and scan rate of 5° min−1. Field-emission scanning electron microscopy (FE-SEM) micrographs were obtained using an SU-70 Microscope (Hitachi). The particle size distribution was observed using a laser particle size analyser (LS603, OMEC). The electrochemical properties of the LFP and mf-LFP electrodes were evaluated using coin-type cells (CR2032), which were assembled with the counter electrode (lithium metal anode) and separator (porous polyethylene membrane) in an argon-filled glove box. The loading amount of the LFP and mf-LFP was approximately 2 mg on 1.5 cm2 current collector area. The electrolyte was 1 M LiPF6 dissolved in the mixed solvent of ethylene carbonate (EC), dimethyl carbonate (DEC), and ethyl methyl carbonate (EMC) (1:1:1 vol%). The charge–discharge process was performed on an electrochemical workstation system (MCL2, Chen Tech Electric) – the cells were galvanostatically charged (Li+ extraction) in a constant current–constant voltage (CC–CV) and discharged (Li+ insertion) in a constant current (CC) within the voltage range between 2.7 and 4.2 V (versus Li/Li+) at different C-rates (1C = 170 mA g−1). Electrochemical impedance spectroscopy (EIS) was performed on an electrochemical workstation (ZIVE MP1, WonA Tech) adjusting an amplitude signal of 5 mV and a frequency range of 0.01 Hz to 100 kHz. All electrochemical measurements were carried out at room temperature.
Results and discussion
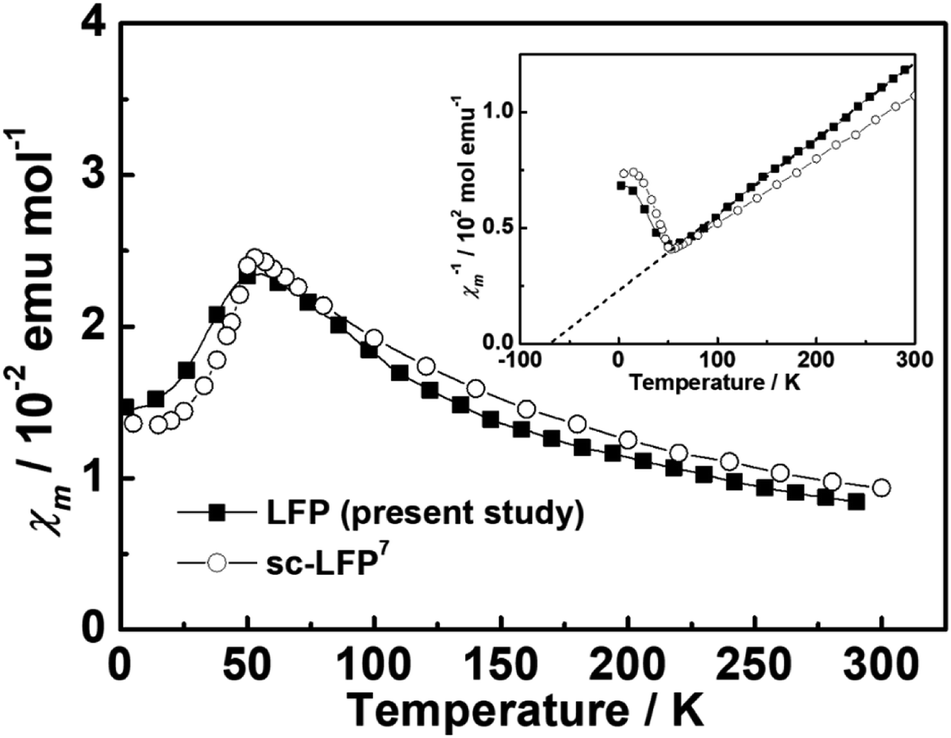
According to the temperature dependent magnetic susceptibility, the LiFePO4 exhibited a well-defined cusp in the curve of the molar magnetic susceptibility (χm), at which the susceptibility increases with temperature decrease whereas a down-turn is found at around 50 K (Fig. 1). The Néel temperature (TN), which is the turning point of materials' antiferromagnetic and paramagnetic behavior, should be present at the cusp. The Curie–Weiss law, describing an antiferromagnetic magnetic susceptibility, is given as below,| |  | (1) |
where C is the material-specific Curie constant and θ is the Curie temperature (or Weiss constant), which accounts for the magnetic ordering of electronic moments below TN. According to the reciprocal plot of the magnetic susceptibility (Fig. 1 inlet), the magnetization curve appeared linear at temperatures above ca. 50 K. Using the Curie–Weiss law with the Curie constant of LiFePO4,7 the reciprocal plot was found to be well fitted to χm−1 = (T–θ)/C in the temperature region above ca. 50 K (the dotted line in Fig. 1 inlet). This indicates that the LiFePO4 shows paramagnetic behavior at the temperatures above TN. In addition, nonlinearities were observed at temperatures below ca. 50 K in the reciprocal plot, which deviate significantly from the paramagnetic behavior. According to the Curie–Weiss law, the asymptotic Curie temperature was observed to be the negative value (ca. −70 K) (Fig. 1 inlet), indicative of antiferromagnetic behavior below TN34,35 – the topology of the antiferromagnetic order has been generally determined by neutron diffraction.36 The LiFePO4 was confirmed to exhibit the para-antiferromagnetic transition at TN, as frequently proven in previous works.37–39
 |
| | Fig. 1 Temperature dependence of the magnetic susceptibility and reciprocal magnetic susceptibility (inlet) for the LiFePO4 (LFP) in the present study compared to that of the average magnetic susceptibility for single crystalline LiFePO4 (sc-LFP) derived from the different magnetic susceptibility along each crystal axis.7 The reciprocal plot of the LFP was fitted with the Curie–Weiss law (dotted line, inlet). | |
The LiFePO4 was exposed to a strong magnetic field at room temperature during the crystal alignment process. As shown in the magnetic susceptibility result (Fig. 1), the LiFePO4 exhibited the paramagnetic behavior at around room temperature. When the LiFePO4 was placed in a strong magnetic field, the internally induced magnetization should generate a magnetic force possibly causing crystal rotation. It is well known that LiFePO4 exhibits an anisotropic magnetic susceptibility (i.e., χb > χa, χc) because of its crystallographic anisotropy.6,7 The magnetic anisotropy causes LiFePO4 crystals to rotate to an angle minimizing the system energy in a magnetic field. This indicates that LiFePO4 crystals can be aligned along the easy magnetization axis (i.e., b-axis), which is an energetically favorable direction of spontaneous magnetization, by a magnetic field. Because of the crystal alignment in a magnetic field, the magnetic anisotropy along the b-axis in LiFePO4 should strengthen; thus, the magnetic susceptibility of an aligned sample may be apart from that of the LiFePO4, which is similar to the average magnetic susceptibility of single crystalline LiFePO4 derived from the different magnetic susceptibility along each crystal axis (Fig. 1).7 Provided that the b-axis is aligned perpendicular to a current collector it is greatly beneficial for lithium ion transport during the charge/discharge process in lithium ion batteries, because lithium ions preferably diffuse along the b-axis in LiFePO4 crystals. If a magnetic field is imposed perpendicular to a current collector where an LiFePO4 slurry is coated, the easy magnetization direction of LiFePO4 (i.e., b-axis) stands along the direction of a magnetic field; thus, the b-axis in LiFePO4 crystal tends to align perpendicular to a current collector. We preferentially used the maximum magnetic field of our superconducting magnet (ca. 6.0 tesla). As soon as an LiFePO4 slurry was coated onto a current collector, it was placed and dried in the magnet (ESI 1†), thus affording the LiFePO4 electrode treated with the magnetic field (mf-LFP).
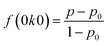
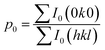
We obtained the XRD pattern of the mf-LFP and a pristine LiFePO4 electrode (LFP) (Fig. 2a). Both the characteristic patterns of the LFP and mf-LFP were indexed to an orthorhombic space group, Pnma (JCPDS card no. 83-2092). The characteristic peak for (020) plane of the mf-LFP was much stronger than that of the LFP, indicating that the b-axis in the mf-LFP is oriented perpendicular to a current collector more frequently than that in the LFP. According to the electrodes' cross sections (Fig. 3), the mf-LFP consisted of the grains having a tendency to orient along the horizontal direction, whereas the LFP was composed of the randomly-oriented grains. These results indicate that the b-axis in the mf-LFP should be susceptible to the magnetic field, and thus it tended to align perpendicular to a current collector in the magnetic field, resulting in the ac-plane oriented parallel to a current collector. We attempted to quantify the crystallographic change by determining the Lotgering factor (i.e., f(0k0), eqn (2a)–(2c)) of each sample, thus evaluating the degree of desired crystal alignment. The Lotgering factor can be defined as below,
| |  | (2a) |
| |  | (2b) |
| |  | (2c) |
where
I(
hkl) and
I0(
hkl) are the intensities of (
hkl) planes in fabricated and randomly-oriented reference samples, respectively.
40,41 By using the XRD data (
Fig. 2a), the
p values (
eqn (2b)) were individually obtained for the fabricated samples (
i.e., LFP and mf-LFP). The LiFePO
4 orthorhombic structure (JCPDS card no. 83-2092) was regarded as a randomly-oriented reference sample, and thus relevant XRD data were adopted to obtain
p0 (
eqn (2c)). If the degree of crystal alignment in the fabricated samples is same as that in the randomly-oriented sample (
i.e.,
p =
p0), the Lotgering factor is 0 (eqn (2a),
Fig. 2b), indicating that the fabricated LiFePO
4 crystals are randomly oriented. When the
b-axis is completely aligned perpendicular to the observed surface (
i.e., ∑
I(0
k0) = ∑
I(
hkl);
p = 1,
eqn (2b)), the Lotgering factor becomes 1 (
eqn (2a),
Fig. 2b). We presented the intensities of (
hkl) planes for the fabricated and randomly-oriented samples (ESI 2
†). The
p values were calculated using the intensities of the LFP and mf-LFP, respectively, whereas the
p0 value was derived using those of the randomly-oriented LiFePO
4 (JCPDS card no. 83-2092); thus, the Lotgering factors for the LFP and mf-LFP were obtained (
Fig. 2b). The Lotgering factor of the LFP was in close proximity to 0 (
f(0
k0) = 0.006), indicating that the degree of crystal alignment is almost same as that of the randomly-oriented LiFePO
4. The Lotgering factor of the mf-LFP was about seventy times as high as that of the LFP, clearly indicating that the
b-axis in the mf-LFP has much higher possibility of perpendicular orientation to a current collector than that in the LFP.
 |
| | Fig. 2 (a) XRD patterns of the LiFePO4 electrodes; the pattern of the pristine LiFePO4 electrode (LFP) was compared to that of the LiFePO4 electrode, which was exposed to the strong magnetic field (mf-LFP). (b) The crystallographic difference between the LFP and mf-LFP was quantified using the Lotgering factor (f(0k0)), which ranges from 0 to 1 depending on how completely the b-axis in LiFePO4 is aligned perpendicular to a current collector. | |
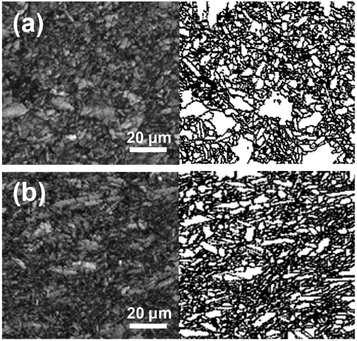 |
| | Fig. 3 Electron backscatter diffraction (EBSD) images for the electrodes' cross sections. The images for the LFP (a) and mf-LFP (b) were individually subdivided into image quality maps (left) and blank maps (right). | |
As explained above, a crystal with magnetic anisotropy possibly rotates to an angle minimizing the system energy when exposed to a magnetic field. The magnetic energy reduction (ΔE) of the system by this rotation is defined as below,
| |  | (3) |
where Δ
χ is the anisotropy of magnetic susceptibility,
V is the volume of each particle,
B is the applied magnetic flux density, and
μ0 is the permeability in a vacuum.
42,43 If Δ
E exceeds the thermal energy of crystalline particles (
i.e., Δ
E >
kBT), the crystal alignment in a magnetic field possibly occurs.
42,43 This condition is expressed as below,
| |  | (4) |
indicative of the minimum magnetic flux density required for rotating the crystals having certain magnetic susceptibility and volume. Because the LiFePO
4 basically had a polycrystalline phase it was not possible to measure the magnetic susceptibility along each crystal axis; thus, the anisotropy of magnetic susceptibility could not be evaluated. Instead, we took into account the magnetic susceptibility measured along the in-plane direction of the LiFePO
4 (
Fig. 1), which was confirmed to be similar to the average magnetic susceptibility of single crystalline LiFePO
4 derived from the different magnetic susceptibility along each crystal axis.
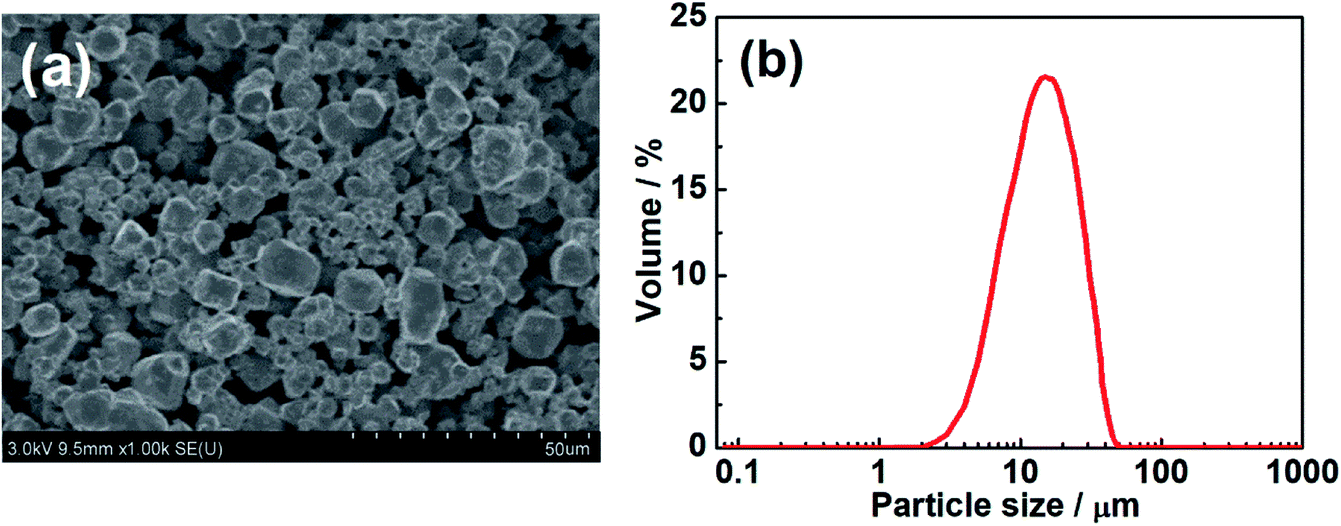
7 The morphology and particle size distribution of the LiFePO
4 was observed
via scanning electron microscopy and laser particle size analysis (
Fig. 4). The LiFePO
4 exhibited the narrow particle size distribution with concentrated D50 value (
ca. 18 μm). Assuming that the LiFePO
4 particle is spherical, we attempted to obtain the average volume of each particle by regarding the D50 value as average particle size. By applying the magnetic susceptibility at room temperature with the volume to
eqn (4), the minimum magnetic flux density required for rotating the LiFePO
4 crystals was derived – calculation details were given in ESI 3.
† The desired crystal alignment seems to be possible with a lot lower magnetic field than the applied strong magnetic field as above; thus, we currently conduct further experimental studies to confirm the minimum magnetic flux density for the crystal alignment.
 |
| | Fig. 4 The morphology and particle size of the LiFePO4 was observed via scanning electron microscopy (SEM) and laser particle size analysis: (a) SEM micrograph and (b) particle size distribution. | |
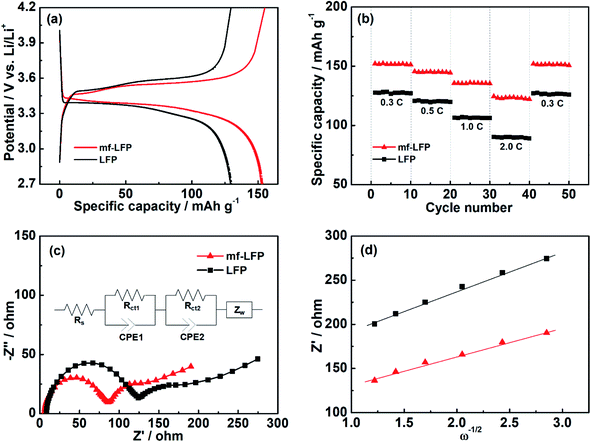
The electrochemical performance of the LFP and mf-LFP was investigated by applying them to a coin-type cell (CR2032). The charge/discharge profiles of the LFP and mf-LFP were presented in Fig. 5a. For the both electrodes, the plateaus were found to start at around 3.5 V versus Li/Li+. This electrochemical tendency indicates the solid-state redox of Fe2+/3+ in LiFePO4 accompanying with lithiation/delithiation.12,44 The mf-LFP displayed narrower space between the plateaus of charge/discharge voltage profiles than the LFP, indicating that the mf-LFP may possess lower electrode polarization and higher reversible capacity. This result should be caused by the highly-oriented crystals of the mf-LFP along the b-axis, in which superior diffusion of lithium ion could be facilitated. The dispersive crystal orientation of the mf-LFP was expected to contribute to achieving greater capacity – the mf-LFP exhibited higher discharge capacity at 0.3C (1C = 170 mA g−1) than the LFP by ca. 19% (Fig. 5a). The electrochemical performance with different C-rate was also evaluated (Fig. 5b). It was observed that the mf-LFP exhibited higher reversible capacity as well as slower capacity decay than the LFP. As the C-rate increased, the capacity difference between the LFP and mf-LFP gradually increased, because the mf-LFP with the highly preferred crystal orientation should facilitate relatively quick diffusion of lithium ion. When the C-rate was returned to 0.3C from 2.0C, the discharge capacity of the mf-LFP was restored to ca. 99.8% of its initial capacity at 0.3C (Fig. 5b); thus, the mf-LFP still recorded superior capacity to the LFP by ca. 19%. The mf-LFP was considered to retain the aligned crystal structure after the cycle process.
 |
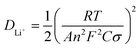
| | Fig. 5 Electrochemical performance and EIS characterization of the LFP and mf-LFP. (a) Charge and discharge profiles in a voltage range of 2.7–4.2 V versus Li/Li+ at 0.3C (1C = 170 mA g−1), (b) rate capabilities at different current densities, (c) Nyquist plots with an equivalent circuit model, and (d) linear fitting between Z′ and ω−1/2. | |
EIS analysis was employed to confirm the effect of the preferred crystal orientation of the mf-LFP on lithium ion diffusion. The Nyquist plots were obtained for the LFP and mf-LFP (Fig. 5c). Both the plots exhibited basically similar characteristics, including two semicircles in the high-to-medium frequency region and a straight line in the low frequency region. The semicircles have a high frequency intercept representing the ionic conductivity of electrolyte (Rs). The first semicircle in the high-to-medium frequency region corresponds to Rct1 and CPE1, involved in the contact resistance of particle-to-particle or particle-to-current collector. The second semicircle corresponds to Rct2 and CPE2, concerning the charge transfer resistance between the electrolyte and electrode active component. The straight line in the low frequency region indicates the Warburg impedance (Zw), which is related to lithium ion diffusion in the electrodes. The relevant diffusion coefficient (DLi+) can be derived using the equation below,
| |  | (5) |
where
R is the gas constant,
T is the absolute temperature,
A is the electrode area,
n is the number of electrons transferred in the redox process,
F is the Faraday constant, and
C is the molar concentration of lithium ions.
45–47σ is the Warburg factor, which is defined as below,
where
ω is the angular frequency and
B is a constant.
45,47 In this relation, the slope (
σ) can be obtained using the linear fitting of
Z′
versus ω−1/2 (
Fig. 5d). The
DLi+ value of the mf-LFP (1.45 × 10
−11 cm
2 s
−1) was higher than the that of the LFP (7.71 × 10
−12 cm
2 s
−1) by
ca. 88%, and thus the preferred crystal orientation was verified to highly increase lithium ion diffusion. As reported in the previous studies on single crystalline LiFePO
4, a large extent of lithium ion diffusion is confined to the one-dimensional diffusion path along
b-axis, implying that oriented LiFePO
4 powders may contribute to improving electrochemical performance in lithium ion batteries.
48 The highly enhanced lithium ion diffusion of the mf-LFP confirms that the crystal alignment technology can substantially bring the anisotropic nature of the single crystal to our sample, resulting in the improvement in electrochemical performance.
Conclusions
The mf-LFP exhibited the noticeable improvement in charge/discharge performance possibly due to the high degree of crystal orientation along the b-axis, which contributes to favorable transport kinetics for lithiation/delithiation in LiFePO4. Considering the low lithium ion conductivity of LiFePO4 inherently originated from the one-dimensional diffusion path for lithium ion, the crystal alignment technology is anticipated to contribute to improving the electrochemical performance of LiFePO4. Further studies on the crystal alignment process using a low magnetic field as well as longer life cycle tests with half/single cells are currently under investigation to confirm the performance stability of the crystal-aligned LiFePO4 and to assess its potential for commercialization.
Conflicts of interest
There are no conflicts to declare.
Acknowledgements
This work was supported by the DGIST R&D Program of the Ministry of Science and ICT of Korea (19-ET-02) and by the National Research Foundation of Korea (NRF) grant funded by the Korea government (MSIT) (No. 2018R1C1B6008050).
Notes and references
- W. J. Zhang, J. Power Sources, 2011, 196, 2962 CrossRef CAS
 .
.
- J. Li, W. Yao, S. Martin and D. Vaknin, Solid State Ionics, 2008, 179, 2016 CrossRef CAS .
- C. A. Fisher, V. M. H. Prieto and M. S. Islam, Chem. Mater., 2008, 20, 5907 CrossRef CAS .
- D. Morgan, A. V. Ven and G. Ceder, Electrochem. Solid-State Lett., 2004, 7, A30 CrossRef CAS .
-
S. Soylu, Electric Vehicles – The Benefits and Barriers, IntechOpen, Rijeka, 2011 Search PubMed .
- D. P. Chen and X. Wang, J. Appl. Phys., 2007, 101, 09N512 CrossRef .
- G. Liang, K. Park, J. Li, R. E. Benson, D. Vaknin, J. T. Markert and M. C. Croft, Phys. Rev. B: Condens. Matter Mater. Phys., 2008, 77, 064414 CrossRef .
- C. Ouyang, S. Shi, Z. Wang, X. Huang and L. Chen, Phys. Rev. B: Condens. Matter Mater. Phys., 2004, 69, 104303 CrossRef .
- C. Y. Ouyang, S. Q. Shi, Z. X. Wang, H. Li, X. J. Huang and L. Q. Chen, J. Phys.: Condens. Matter, 2004, 16, 2265 CrossRef CAS .
- R. Malik, D. Burch, M. Bazant and G. Ceder, Nano Lett., 2010, 10, 4123 CrossRef CAS .
- L. Wang, X. He, W. Sun, J. Wang, Y. Li and S. Fan, Nano Lett., 2012, 12, 5632 CrossRef CAS .
- L. Yang, J. Chen, L. Chen, P. Yang, J. Zhang, A. Li, Y. Wang, Y. Wang and R. Wang, J. Mater. Sci.: Mater. Electron., 2016, 27, 12258 CrossRef CAS .
- M. S. Islam, D. J. Driscoll, C. A. J. Fisher and P. R. Slater, Chem. Mater., 2005, 17, 5085 CrossRef CAS .
- C. A. J. Fisher and M. S. Islam, J. Mater. Chem., 2008, 18, 1209 RSC .
- S. Nishimura, G. Kobayashi, K. Ohoyama, R. Kanno, M. Yashima and A. Yamada, Nat. Mater., 2008, 7, 707 CrossRef CAS .
- J. Sugiyama, H. Nozaki, M. Harada, K. Kamazawa, O. Ofer, M. Mansson, J. H. Brewer, E. J. Ansaldo, K. H. Chow, Y. Ikedo, Y. Miyake, K. Ohishi, I. Watanabe, G. Kobayashi and R. Kanno, Phys. Rev. B: Condens. Matter Mater. Phys., 2011, 84, 054430 CrossRef .
- S. Lim, C. S. Yoon and J. Cho, Chem. Mater., 2008, 20, 4560 CrossRef CAS .
- L. Peng, Y. Zhao, Y. Ding and G. Yu, Chem. Commun., 2014, 50, 9569 RSC .
- M. Wu, Z. Wang, L. Yuan, W. Zhang, X. Hu and Y. Huang, Chin. Sci. Bull., 2012, 57, 4170 CrossRef CAS .
- B. J. Hwang, K. F. Hsu, S. K. Hu, M. Y. Cheng, T. C. Chou, S. Y. Tsay and R. Santhanam, J. Power Sources, 2009, 194, 515 CrossRef CAS .
- R. Tian, G. Liu, H. Liu, L. Zhang, X. Gu, Y. Guo, H. Wang, L. Sun and W. Chu, RSC Adv., 2015, 5, 1859 RSC .
- T. Muraliganth, A. V. Murugan and A. Manthiram, J. Mater. Chem., 2008, 18, 5661 RSC .
- S. Yang, X. Zhou, J. Zhang and Z. Liu, J. Mater. Chem., 2010, 20, 8086 RSC .
- L. Li, X. Tang, H. Liu, Y. Qu and Z. Lu, Electrochim. Acta, 2010, 56, 995 CrossRef CAS .
- R. Mei, Y. Yang, X. Song, Z. An, K. Yan and J. Zhang, Electrochim. Acta, 2016, 10, 325 CrossRef .
- B. Wang, S. Wang, P. Liu, J. Deng, B. Xu, T. Liu, D. Wang and X. S. Zhao, Mater. Lett., 2014, 118, 137 CrossRef CAS .
- S. Yang, M. Hu, L. Xi, R. Ma, Y. Dong and C. Y. Chung, ACS Appl. Mater. Interfaces, 2013, 5, 8961 CrossRef CAS .
- M. H. Lee, J. Y. Kim and H. K. Song, Chem. Commun., 2010, 46, 6795 RSC .
- Z. Zheng, W. K. Pang, X. Tang, D. Jia, Y. Huang and Z. Guo, J. Alloys Compd., 2015, 640, 95 CrossRef CAS .
-
G. Pistoia, Lithium-Ion Batteries Advances and Applications, Elsevier, Amsterdam, 2014 Search PubMed .
- J. S. Sander, R. M. Erb, L. Li, A. Gurijala and Y. M. Chiang, Nat. Energy, 2016, 1, 16099 CrossRef CAS .
- H. Yamada, T. S. Suzuki, T. Uchikoshi, M. Hozumi, K. Kohama and Y. Sakka, J. Ceram. Soc. Jpn., 2011, 119, 701 CrossRef CAS .
- H. Yamada, T. S. Suzuki, T. Uchikoshi, M. Hozumi, T. Saito and Y. Sakka, J. Eur. Ceram. Soc., 2013, 33, 3059 CrossRef CAS .
- C. M. Julien, A. Ait-Salah, A. Mauger and F. Gendron, Ionics, 2006, 12, 21 CrossRef CAS .
- J. K. Ngala, N. A. Chernova, M. Ma, M. Mamak, P. Y. Zavalij and M. S. Whittingham, J. Mater. Chem., 2004, 14, 214 RSC .
- G. Rousse, J. Rodriguez-Carvajal, S. Patoux and C. Masquelier, Chem. Mater., 2003, 15, 4082 CrossRef CAS .
- R. P. Santoro and R. E. Newnham, Acta Crystallogr., 1967, 22, 344 CrossRef CAS .
-
C. Julien, A. Mauger, A. Vijh and K. Zaghib, Lithium Batteries, Springer International Publishing, Cham, 2016 Search PubMed .
- J. Yao, K. Konstantinov and G. X. Wang, J. Solid State Electrochem., 2007, 11, 177 CrossRef CAS .
- F. K. Lotgering, J. Inorg. Nucl. Chem., 1959, 9, 113 CrossRef CAS .
- B. Liu, X. Liu, P. Li, F. Li, B. Shen and J. Zhai, RSC Adv., 2017, 7, 41788 RSC .
- Y. Sakka and T. S. Suzuki, J. Ceram. Soc. Jpn., 2005, 113, 26 CrossRef CAS .
- T. Kimura, Polym. J., 2003, 35, 823 CrossRef CAS .
- J. M. Tarascon and M. Armand, Nature, 2001, 414, 359 CrossRef CAS PubMed .
- J. Zhou, D. Zhang, G. Sun and C. Chang, Solid State Ionics, 2019, 338, 96 CrossRef CAS .
- R. Liu, J. Chen, Z. Li, Q. Ding, X. An, Y. Pan, Z. Zheng, M. Yang and D. Fu, Materials, 2018, 11, 2251 CrossRef .
- J. Chen, D. Zhang, J. Qiao and C. Chang, Ionics, 2018, 24, 689 CrossRef CAS .
- R. Amin, P. Balaya and J. Maier, Electrochem. Solid-State Lett., 2007, 10, A13 CrossRef CAS .
Footnote |
| † Electronic supplementary information (ESI) available: Crystal alignment process, X-ray diffraction data, and magnetic and physical properties for the LiFePO4 samples. See DOI: 10.1039/c9ra05284d |
|
| This journal is © The Royal Society of Chemistry 2019 |
Click here to see how this site uses Cookies. View our privacy policy here. 
 Open Access Article
 This Open Access Article is licensed under a Creative Commons Attribution-Non Commercial 3.0 Unported Licence
 *a,
Yeokyung
Yang
a,
Dongwoo
Ha
b,
Dong Hwan
Kim
a and
Hoyoung
Kim
a
*a,
Yeokyung
Yang
a,
Dongwoo
Ha
b,
Dong Hwan
Kim
a and
Hoyoung
Kim
a