 Open Access Article
Urease covalently immobilized on cotton-derived nanocellulose-dialdehyde for urea detection and urea-based multicomponent synthesis of tetrahydro-pyrazolopyridines in water
Fatemeh Tamaddon * and
Davood Arab
Department of Chemistry, Faculty of Science, Yazd University, Yazd 89195-741, Iran. E-mail: ftamaddon@yazd.ac.ir; Fax: +983538210644; Tel: +983531232666
First published on 17th December 2019
Abstract
The urease Schiff-base covalently bonded to the designed high-content nanocellulosedialdehyde (HANCD) prepared from cotton-derived nanocellulose (NC) via tandem acid-hydrolysis and periodate-oxidation reactions was termed HANCD@urease. No change in the aldehyde content of HANCD after Schiff-base bonding to urease and similarity in the relative enzyme activities for HANCD@urease and free enzyme supported that the preparation conditions for HANCD-loaded urease are mild enough to prevent denaturation of the enzyme. As the immobilized urease showed higher stability and reusability versus free enzyme, the HANCD@urease was efficiently used to determine the urea concentration in aqueous solutions and blood serum samples. Alternatively, the catalytic efficiency of the HANCD@urease was demonstrated for the production of ammonia from urea in the multicomponent synthesis of 3,5-dimethyl-4-aryl-1,4,7,8-tetrahydrodipyrazolo[3,4-b:4′,3′-e]pyridines (THPPs) in water. This new environment-friendly urea sensor showed 90% preservation of the enzyme activity after the six cycles of reuse in enzymatic reactions, while its catalytic activity in the reaction of benzaldehyde, hydrazine hydrate, and alkyl acetoacetate with urea instead of hygroscopic ammonium salts did not change significantly after the sixth run. Detection and production of ammonia by a bio-compatible sensor and catalyst under mild conditions are features of this new green protocol.
Introduction
Due to the superior specificity and environmental benignity of enzymes compared to traditional chemical catalysts, in vitro enzymatic reactions have been developed in recent academic and industrial research.1,2 However, enzyme immobilization on proper supports is necessary due to the stability and reusability issues of free enzymes.3 There are three types: physical adsorption, covalent chemical bonding, and encapsulation methods for enzyme immobilization applied for diagnostic systems with their advantages and drawbacks.4 Physical adsorption on supports is the simplest method for enzyme immobilization, but is associated with uncontrolled enzyme leaching.5 Enzymes chemically or crosslink-anchored to supports preserve the enzyme structure more effectively in practical use, albeit with a decrease in enzyme activity and an increase in the price.6 Enzyme encapsulation also creates a diffusional limitation for access to enzyme active sites and substrates.7 Thus, the covalent chemical immobilization of enzymes on a low-cost, biocompatible, and non-toxic support is highly appropriate for biotechnological, food, cosmetic, and bio-pharmacological uses of enzymes.Urease is the first distinct Ni-containing hydrolase enzyme for the hydrolysis of urea to ammonia and CO2 (ref. 8) to be stabilized by chemical or physical bonding to organic9,10 and inorganic supports.11,12 Recently, we used free urease for the in situ bio-production of ammonia from urea in the synthesis of N-heterocycles, though with some stability and reusability complications for the free enzyme.13,14 Due to these drawbacks,13–15 urease stabilization by linking to a suitable support to preserve the enzyme activity is a challenge.16 Due to the higher lifetime and stability of chemically bonded enzymes, chemical immobilization (CI) of urease is more feasible17 than physical adsorption18 or encapsulation,19–21 although CI leads to some enzyme activity loss.22 In this context, the immobilization of urease on cellulose,9 chitosan,23 alginate,24 gelatin,25 and agar26 have been tried to achieve urea biosensors.27,28 Kumar et al.24 prepared the biosensor alginate@urease and compared it with chitosan@urease for urea detection. Cellulose is a unique low-cost biopolymer, with amphiphilic properties and weak hydrogen bond issues29–31 which are solvable by regio-selective periodate oxidation (PO) of vicinal hydroxylated C2–C3 groups,32,33 for urease immobilization9 on cellulose dialdehyde (CD). Nanocellulose dialdehyde (NCD) is an advanced version of CD and nanocellulose (NC) with the advantages of high surface area, high diffusion power, special mechanical properties, simple chemical access, and sustainability. Recently, low aldehyde content NCDs34 have been used as sorbents,35 nano-metal templates,36 and aerogels.37,38 However, preparation of a high dialdehyde content NC (HANCD) from low-cost cotton is very desirable to overcome the stability and reusability issues of free urease using Schiff-base covalent bonding.
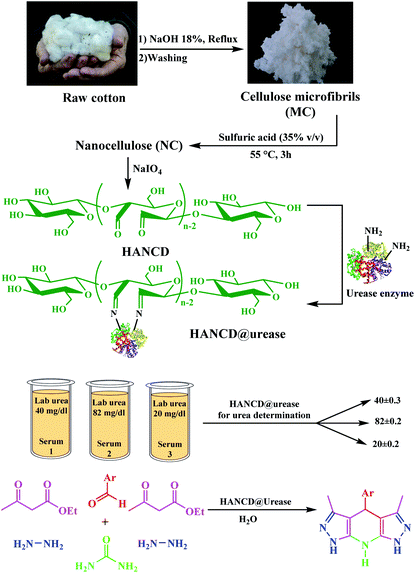
The 3,5-dialkyl-4-aryl-1,4,7,8-tetrahydrodipyrazolo[3,4-b:4′,3′-e]pyridine (THPP) motif is a key structural feature present in naturally active compounds39 and synthetic pharmaceuticals.40 THPPs have been synthesized by multicomponent reactions (MCRs) using heterogeneous and homogeneous acid catalysts.41–45 Despite the benefits, some of these pseudo-six-component methods have drawbacks, such as long reaction times, use of organic solvents, non-reusable catalysts, and excess hygroscopic ammonium salts as a nitrogen source for the central pyridine ring. To the best of our knowledge, no enzymatic green synthesis of THPPs in water has been reported. Therefore, the development of bio-catalytic synthesis of THPPs in water using reusable HANCD-loaded urease and urea as a safer nitrogen source than ammonium salts is highly anticipated. The object of this work is simple preparation of HANCD from raw cotton, covalent bond immobilization of urease on HANCD as HANCD@urease, evaluation of the aldehyde content and relative activity/stability of the produced urea biosensor, and the catalytic assessment of HANCD@urease in the enzymatic production of ammonia in water for green synthesis of THPPs (Scheme 1).
Experimental section
Materials
Cotton flower (obtained from Yazd, Iran) was chopped and treated with water, ethanol, and 18% NaOH to give cellulose microfibrils (MC). H2SO4, monosodium phosphate, disodium phosphate, Tris–acetate buffer, acetic acid, sodium chlorite (NaClO2), sodium periodate (NaIO4), hydrazine hydrate, hydroxylamine hydrochloride, urea, aldehydes, and ethyl acetoacetate were supplied by Merck (Germany). All materials were reagent grade and used without further purification, except the urease with absolute activity 50 U mg−1 which was extracted from soya beans and purified according to previously reported procedures.13,46Human blood samples
All experiments were performed in accordance with the Guidelines of the National Institutes of Health. Experiments were approved by the ethics committee at Shahid Sadoghi University of Medical Science and Yazd University. Informed consent was obtained from the voluntary human participants in this study.Preparation of MCD and NCDs from MC-derived cotton fibres
NCDs were prepared by simultaneous preparation of MC from cotton, conversion of MC to NC, and PO of NC under the optimized conditions. To give mercerized MC, a suspension of cotton chopped and de-waxed with ethanol (5 g) in NaOH (18%, 80 mL) was refluxed. The resulting anionic micro-cellulose (AMC) was washed with water to reach pH 7 and dried at 70 °C. The MCD was prepared by keeping the reaction mixture of MC in water (1 g/50 mL) and sodium periodate (1.7 g) at neutral pH, room temperature, and dark conditions for 72 h.To prepare NC, the MC (5 g) was added to a solution of sulfuric acid (35% v/v, 50 mL) and the mixture was stirred vigorously at 50 °C for 3 h. Then, ice water (500 mL) was added to stop the hydrolysis and the mixture was centrifuged and decanted three times to get dispersed NC particles in water (1 g/50 mL) at neutral pH. To obtain NCDs, sodium periodate (NaIO4, 1.4 g), sodium chlorite (1.7 g), potassium periodate (KIO4, 1.7 g), or 2,2,6,6-tetramethylpiperidine-1-oxyl (TEMPO, 1.3 g) was added and the reaction mixture was kept for 1–100 h under dark conditions, from which the HANCD was typically prepared by PO at room temperature after 72 h. Next, water was added and the NCD particles were isolated after centrifugation and decantation.
Determination of aldehyde content for MCD and NCDs
The aldehyde content for the as-prepared micro- and nano-CDs was determined by modified titration with an aqueous solution of hydroxylamine hydrochloride (HAHC).37 Thus, NCD or MCD (0.25 g) was added to the solution of HAHC (0.45 g in 30 mL of water) at controlled pH = 4.2 and the mixture was stirred for 24 h at room temperature to reach pH = 0.33. Then NaOH (0.1 M) was added to return the pH to 4.2 and the aldehyde content was calculated following eqn (1):
 | (1) |
Following the same method, an aldehyde content of 47% was calculated for MCD.
Preparation of HANCD@urease as urea biosensor
HANCD (0.85 g) dispersed in a solution of urease (absolute activity 50 U mg−1) in phosphate buffer (0.05 M, pH = 7, 100 mL) with a concentration of 1 mg urease per mL (for maximum efficiency) was shacked for 24 h at 4 °C. Then, the phosphate buffer solution was added and the mixture was centrifuged, decanted, and washed with distilled water three times to give HANCD@urease.Determination of aldehyde content for immobilized urease as HANCD@urease
The aldehyde content for urease immobilized as HANCD@urease was determined according to a modified method used for NCDs by titration with HAHC37 for 0.25 g of HANCD@urease. Due to there being no change in pH after the addition of the HAHC and no consumption of NaOH to return the pH to 4.2, a 0% aldehyde content was calculated for HANCD@urease following eqn (1).Characterization of HANCD and HANCD@urease
Fourier transform infrared (FT-IR) spectra of samples were taken by a Bruker Equinox 55 and Bruker AC 500. The UV-Vis spectra of NCDs for the determination of aldehyde content were recorded by a single-beam UV-Vis (AvaSpec-2048) spectrophotometer. X-ray diffraction patterns (XRD) were recorded on an X Pert Pro Panalytical. The surface morphology of samples was viewed by field emission electron microscopy (FESEM) analysis model MIRA3 TE-SCAN. Thermal gravimetric analysis (TGA) was performed by an STA 1500. HANCD and HANCD@urease were characterized by IR-spectroscopy and FESEM, XRD, and TGA.The performance assays for urea detection by HANCD@urease
All performance assays for urea detection were repeated for five runs and the results were analyzed by Statistic software version 6 to estimate the experimental error. To check the pH effect, a solution of free urease or HANCD@urease in sodium phosphate buffer solution (pH = 7, 0.05 M) at 4 U mL−1 was incubated for 5 minutes. Then, 1 mL of urea solution (0.1 M) in phosphate buffer solution (0.05 M) with pH adjusted to between 4–9 was added and the mixture was magnetically stirred at 35 °C for 15 min until the reaction was stopped by adding 1 mL sulfuric acid. The absolute activity was then determined spectrophotometrically by adding Nessler's reagent and measuring the absorbance of the color complex with the released NH3 at 460 nm; both the relative and absolute activities were evaluated for free urease or HANCD@urease. To determine the specific activity for free- or immobilized-urease, a standard calibration curve for ammonium sulfate was used. According to the enzyme unit definition (U), one unit activity is the amount of free or immobilized urease that causes liberation of 1 μmol ammonia per minute at optimum pH.To check the temperature effect, the free urease or HANCD@urease was immersed in a 0.1 M solution of urea in various incubated sodium phosphate buffer solutions (0.05 M) at temperatures of 20 °C, 30 °C, 40 °C, 50 °C, 60 °C, 70 °C, and 80 °C for 5 minutes. The released NH3 was determined as described above, while the relative enzyme activity was evaluated as the ratio of the specific activities of the HANCD@urease and the free urease multiplied by 100. (4 U mL−1).
HANCD@urease as a biosensor for determination of urea in solutions or serum samples
First, three human blood serum samples with 82, 40, and 20 mg mL−1 urea (confirmed by clinical auto-analyzer) were voluntary prepared from the blood samples of the author and coworkers in Yazd Medical Lab in compliance with Yazd University's policy on animal/human use and ethics. All tests on our blood serum were assayed in agreement with the Yazd University policy on biological samples. Alternatively, urea solutions were prepared from urea and deionized water. To check the biosensor HANCD@urease for urea estimation in blood serum or urea solutions, the HANCD@urease (10 mg) was incubated at 35 °C in Tris acetate buffer (0.5 mL) at pH 7. Then, 0.2 mL of urea solution or serum sample was added, the mixture was magnetically stirred for 5 min, acetic acid (0.5 mL, 10%) was added to precipitate the free urease or HANCD@urease and the mixture was centrifuged. The concentration of urea was assessed based on the NH3 released by the enzymatic reaction in the supernatant after the addition of Nessler's reagent, the absorbance of the color complex was measured at 460 nm, and the standard calibration curves plotted for various urea concentrations were followed.Thermal stability test for HANCD@urease
To check the thermal stability, the free urease and HANCD@urease were separately incubated in phosphate buffer (0.05 M) at variable times at 70 °C in 300 minutes. The residual activity of the enzyme for the samples withdrawn after each 1 h incubation was determined following section “The performance assays for urea detection by HANCD@urease”. In another test, the response of the HANCD@urease in control of the enzyme activity was measured for aqueous solutions of urea (1 mM) for a period of 35 days.HANCD@urease-catalyzed synthesis of THPPs
A mixture of hydrazine hydrate (5 mmol), alkyl acetoacetate (5 mmol), aldehyde (2.5 mmol), urea (15 mmol), and HANCD (0.025 g) in water was magnetically stirred at 70 °C as the optimum temperature for the maximum activity of urease in immobilized form (Section “Thermal stability test for HANCD@urease”). The product precipitated during the progress of the reaction; thus, after completion of the reaction, EtOAc was added and the urease-loaded HANCD was filtered out. The THPP product was obtained after the vacuum evaporation of EtOAc under reduced pressure and recrystallization from an H2O/EtOH mixture (70![[thin space (1/6-em)]](https://www.rsc.org/images/entities/char_2009.gif) :
:![[thin space (1/6-em)]](https://www.rsc.org/images/entities/char_2009.gif) 30).
30).
Reusability of HANCD@urease
The reusability of HANCD@urease was evaluated over 6 cycles of reaction runs for both the enzymatic experiment and HANCD@urease-catalysed pseudo-six-component reaction of hydrazine hydrate, ethyl acetoacetate, benzaldehyde, and urea. So, after each cycle, the separated HANCD@urease from the reaction mixture was washed with water and phosphate buffer solution at pH 7 and reused in a further similar reaction. All experiments were repeated three times.Results and discussion
Preparation of biosensor and catalyst HANCD@urease under the optimized conditions
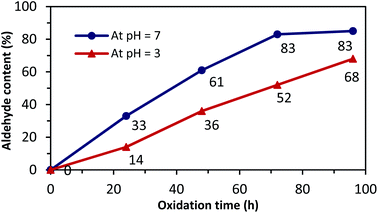
The HANCD@urease was prepared by prewashing cotton to cellulose-micro fibers (MC), acid hydrolysis of MC to NC, PO of NC to HANAC under the optimized conditions, and Schiff-base bonding of urease to HANAC to get the HANCD@urease (Scheme 1). After removing the hemicellulose and lignin impurities from de-waxed cotton under mercerization conditions, which improves the morphological structure and shine of the cellulose, the NC was prepared by acid hydrolysis of MC.38 The aqueous suspension (1 g/50 mL) of the as-prepared NC was then treated with various oxidants and acid/base additives to give the four types of NCDs (Table 1, entries 1–4) with various aldehyde contents or nanocellulose carboxylates (NCCs). The aldehyde contents37 determined for NCDs are compared in the last column of Table 1.Among the prepared NCD72, NCDA72, NCDB72, NCDK48, NCCC24, and NCCT60, the maximum 83% aldehyde content was from the NCD72 (HANCD) obtained by PO of NC without acid/base additive after 72 h (entry 1). The experiments using the other oxidants produced NCCs (entries 4–6).
Next, a close analysis of pH and reaction time was performed at room temperature and in dark conditions to support the optimized PO of NC (Fig. 1).
Urease immobilization and characterizations of HANCD@urease
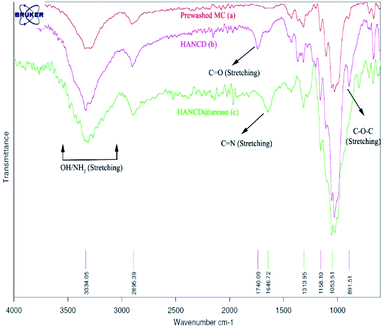
Due to the maximum aldehyde content of HANCD (NCD72) over the other NCDs and MCD, it was selected for further Schiff-base covalent immobilization of urease. The chemical bonding of urease amino groups occurred by treatment of urease (50 U mg−1) in phosphate buffer with HANCD under incubation conditions at pH = 7 for 24 h. Then, the yellowish solid HANCD@urease was filtered, washed with buffer solution, dried at 40 °C, and characterized by FT-IR, FESEM, XRD, TGA, and aldehyde content. The determined aldehyde content33 for HANCD@urease was 0%, showing the high efficacy of the urease immobilization on HANCD. Based on the 83% aldehyde content for unloaded HANCD, it can be concluded that all aldehyde groups are involved in Schiff-base covalent bonding to urease.The compared FT-IR spectra of prewashed MC, HANCD, and HANCD@urease show the cooperative absorption bands for O–H stretching, C–H stretching, CH2 bending, and C–O stretching at 3300 cm−1, ∼2900 cm−1, ∼1460 cm−1, and ∼1000–1150 cm−1, respectively (Fig. 2). The appearance of two new characteristic peaks at ∼1740 cm−1 and ∼890 cm−1 in the spectrum of HANCD is due to the C![[double bond, length as m-dash]](https://www.rsc.org/images/entities/char_e001.gif) O stretching and C–O–C stretching of hydrated aldehyde32 in oxidized NC that confirms the formation of NCD. Due to its maximum aldehyde content (Table 1, entry 1), we termed this product HANCD. In the FT-IR spectrum of HANCD@urease, the change in the broadness of OH/NH2 absorption band at 2900–3500 cm−1, disappearance of the aldehyde C
O stretching and C–O–C stretching of hydrated aldehyde32 in oxidized NC that confirms the formation of NCD. Due to its maximum aldehyde content (Table 1, entry 1), we termed this product HANCD. In the FT-IR spectrum of HANCD@urease, the change in the broadness of OH/NH2 absorption band at 2900–3500 cm−1, disappearance of the aldehyde C![[double bond, length as m-dash]](https://www.rsc.org/images/entities/char_e001.gif) O stretching, and entrance of a new peak at 1646 cm−1 are due to the C
O stretching, and entrance of a new peak at 1646 cm−1 are due to the C![[double bond, length as m-dash]](https://www.rsc.org/images/entities/char_e001.gif) N formation by Schiff-base bonding of HANCD aldehyde groups to amino acids of urease (Fig. 2).
N formation by Schiff-base bonding of HANCD aldehyde groups to amino acids of urease (Fig. 2).
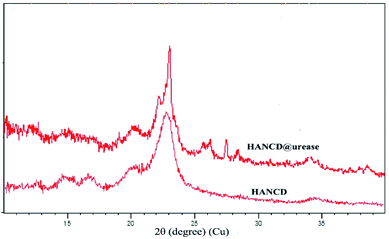
The overlaid XRD patterns of HANCD and HANCD@urease present similar peaks at 2θ = 20–23° corresponding to the (200) diffraction plane of cellulose.49 The additional low intensity peaks at 2θ = 26, 27, and 28° and the change in sharpness of peaks are assigned to the introduction of urease to the HANCD crystalline phase (Fig. 3).
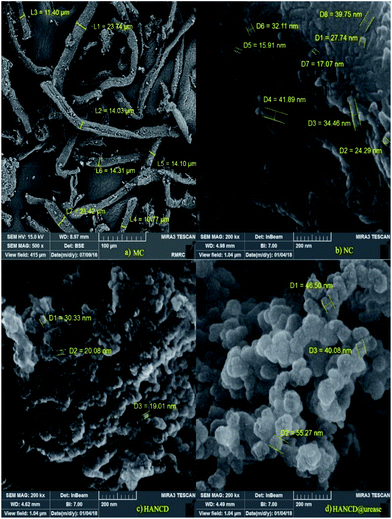
Based on the FESEM images, MC has a fibrillated structure in the micro-dimension with 11–23 μm diameters, whereas NC, HANCD, and HANCD@urease have nanostructures with different porosities and morphologies. The difference in MC and NC morphologies is in line with the acid cleavage of MC fibers to NC particles. Additionally, a size change from 19–30 nm in the aggregated HANCD nanoparticles to the smoother spherical 40–55 nm nanoparticles in the FESEM of HANCD@urease supports the immobilization of urease on HANCD (Fig. 4).
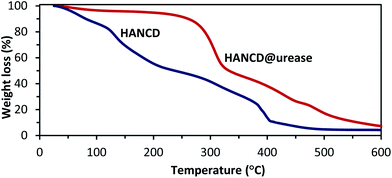
As is obvious from the compared TGA curves, the mass loss for HANCD@urease began at temperatures higher than 300 °C, whereas thermal decomposition of HANCD occurred at ∼100 °C. Moreover, thermal decomposition of HANCD@urease at >300 °C has a lower slope than that of HANCD. These results support enough stability of the immobilized urease for practical uses (Fig. 5).
Relative and specific enzyme activities, stability, and reusability of the free and immobilized urease
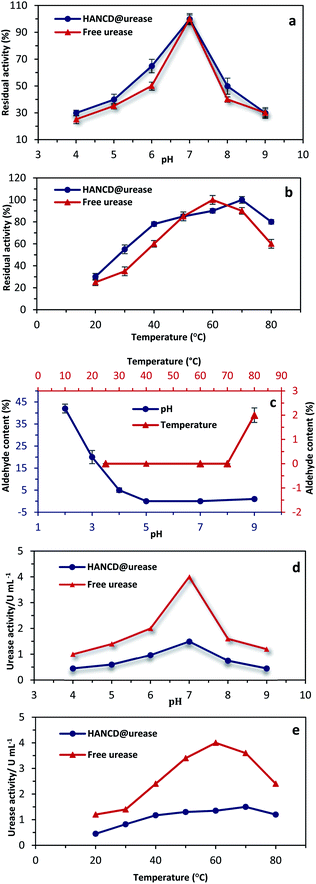
Due to the significant effects of pH and temperature on urease structure and activity, the free enzyme and HANCD@urease were compared for urea hydrolysis in solution (0.1 M) at various temperatures (20–80 °C) and buffer pHs (4–9, controlled by phosphate solutions). The reproducibility of urea determination by the biosensor HANCD@urease was confirmed by repeating the experiments five times under similar conditions, with a relative standard deviation (SD) of 2.8% derived by statistic analysis (Fig. 6a and b).Based on the results in Fig. 6a, the optimum pH for maximum activity of the free and HANCD-immobilized urease is neutral pH 7, which means the same diffusion of the urea substrate into both the free and immobilized enzymes. The maximum activities of free and immobilized urease were at 60 °C and 70 °C, respectively, while the residual activities for the HANCD@urease are higher than free urease at all temperatures. With a milder slope for HANCD@urease, the decrease in enzyme activity at higher than 80 °C is attributed to the denaturation of urease (Fig. 6b). To determine the stability of the HANCD covalent-bonded urease and confirm that the residual activity is from the HANCD@urease and not due to the free urease released by breaking the Schiff-base bonded enzyme, the aldehyde content for the HANCD@urease was evaluated under various conditions. The aldehyde content was determined for the immobilized urease at certain buffer pHs of 2, 3, 4, 7, and 9 and screened temperatures of 25 °C, 60 °C, 70 °C and 80 °C in controlled pH 7 (Fig. 6c). Based on the results, the aldehyde content of HANCD@urease did not change between 20–60 °C, while the mere 2% increase in aldehyde content at 80 °C revealed 2% urease releasing at this temperature (Fig. 6c). Similarly, urease Schiff-base covalently bonded to HANCD is stable at about pH 7 and relatively stable at alkaline pH, with release of only 1% urease at pH 9. The 42% and 20% aldehyde contents for HANCD@urease at acidic pHs 2 and 3 were recorded and illustrate the breaking of C![[double bond, length as m-dash]](https://www.rsc.org/images/entities/char_e001.gif) N bonds and release of a similar percent of free urease at these acidic pHs. No change in aldehyde content at optimum pH ∼7 for urease enzyme displayed the performance of HANCD@urease (Fig. 6c). Changes in the absolute activities for the free and HANCD anchored urease were also evaluated at various pHs from 4 to 9 (Fig. 6d) and temperatures from 20 °C to 80 °C (Fig. 6e). The maximum specific activity for both free and HANCD-immobilized urease was at pH = 7, while increasing or decreasing pH reduces the enzyme activity due to the denaturation of the peptide part of enzyme in acidic or basic conditions.
N bonds and release of a similar percent of free urease at these acidic pHs. No change in aldehyde content at optimum pH ∼7 for urease enzyme displayed the performance of HANCD@urease (Fig. 6c). Changes in the absolute activities for the free and HANCD anchored urease were also evaluated at various pHs from 4 to 9 (Fig. 6d) and temperatures from 20 °C to 80 °C (Fig. 6e). The maximum specific activity for both free and HANCD-immobilized urease was at pH = 7, while increasing or decreasing pH reduces the enzyme activity due to the denaturation of the peptide part of enzyme in acidic or basic conditions.
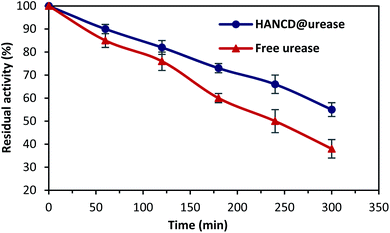
Because of the importance of the thermal stability, reusability, and storage of enzymes in practical uses,50 the activity-loss of the incubated free and HANCD-immobilized ureases at 70 °C were evaluated at numerous time intervals, with assays for urea detection repeated for five runs and the results analyzed to estimate the experimental error using Statistic software version 6 (Fig. 7).
The results supported the higher residual activity and lower activity-loss rate for HANCD@urease than for free urease at all incubation times. This shows the efficacy of urease immobilization on HANCD. Moreover, the month-long control experiment for the biosensor HANCD@urease in 1 mM urea solution showed 100% preservation of the enzyme activity after 15 days and 10% activity-loss after 35 days.
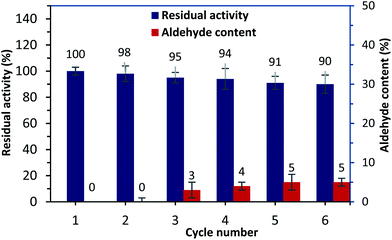
Alternatively, to overcome the recovery issues for free urease,10 the operating stability of the HANCD@urease was examined by reusability tests. After each experiment, the recycled immobilized urease was washed with deionized water and reused, and 90% of the residual enzyme activity was retained after the sixth run. Tracking the aldehyde content for the reused HANCD@urease after enzymatic reaction runs showed 5% aldehyde content for the recovered immobilized enzyme after the sixth run (Fig. 8).
To check the HANCD@urease for the estimation of blood urea, three human blood serum samples with 82, 40, and 20 mg mL−1 urea (from a clinical auto-analyzer in Yazd Medical Lab) were assayed with the biosensor HANCD@urease. The selection of these samples was due to the available experimental data for immobilized urease on alginate@urease and chitosan@urease urea biosensors, as prepared and used by Kumar et al.24 We repeated their procedure five times and the results were expressed as means ± deviation standard (DS) for logical comparison (Table 2). Nessler's reagent was added every 5 minutes to the lab serum samples treated with HANCD@urease, the absorbance of the color complex was measured at wavelength 460 nm, and the urea concentration was calculated by a calibration curve.
| Clinical serum sample | Auto-analyzer urea (mg dL−1) | Alginate@urease urea24 (mg dL−1) | HANCD@urease urea (mg dL−1) (this work) |
|---|---|---|---|
| a The urea amount was determined based on Experimental section “The performance assays for urea detection by HANCD@urease” (n = 3). | |||
| 1 | 40 ± 0.2 | 38 ± 0.3 | 40 ± 0.3 |
| 2 | 82 ± 0.2 | 81 ± 0.2 | 82 ± 0.2 |
| 3 | 20 ± 0.2 | 19 ± 0.5 | 20 ± 0.2 |
The results from HANCD@urease were similar to the clinical auto-analyzer amounts and compatible with the previous data reported by Kumar et al.24 with respect to both precision and accuracy (Table 2). However, HANCD@urease can also be used as a biosensor to determine the urea in the other real biological samples.
Catalytic evaluation of HANCD@urease for bio-production of NH3 in THPPs synthesis
Given that THPPs are synthesized by MCRs with excess hygroscopic ammonium salts, organic solvents, and bio-incompatible catalysts,41–45 we attempted the in situ bio-production of ammonia by HANCD@urease-catalyzed hydrolysis of urea in water for the synthesis of THPPs. To optimize the reaction settings, we chose hydrazine hydrate, ethyl acetoacetate, and benzaldehyde (2![[thin space (1/6-em)]](https://www.rsc.org/images/entities/char_2009.gif) :
:![[thin space (1/6-em)]](https://www.rsc.org/images/entities/char_2009.gif) 2
2![[thin space (1/6-em)]](https://www.rsc.org/images/entities/char_2009.gif) :
:![[thin space (1/6-em)]](https://www.rsc.org/images/entities/char_2009.gif) 1) as model substrates and screened their reactions in water with the urea/HANCD@urease couple for the synthesis of 3,5-dimethyl-4-phenyl-1,4,7,8-tetrahydrodipyrazolo[3,4-b:4′,3′-e]pyridine under various conditions (Table 3).
1) as model substrates and screened their reactions in water with the urea/HANCD@urease couple for the synthesis of 3,5-dimethyl-4-phenyl-1,4,7,8-tetrahydrodipyrazolo[3,4-b:4′,3′-e]pyridine under various conditions (Table 3).
| Entry | NANCD@urease (mg) | Solvent/°C | Time (min) | Yield (%) |
|---|---|---|---|---|
| a Reaction with free urease. | ||||
| 1 | 0.005 | EtOH/60 | 50 | 45 |
| 2 | 0.005 | CH2Cl2/60 | 50 | 15 |
| 3 | 0.005 | H2O/60 | 50 | 65 |
| 4 | 0.01 | H2O/60 | 50 | 80 |
| 5 | 0.02 | H2O/60 | 50 | 76 |
| 6 | 0.01 | H2O/60 | 60 | 85 |
| 7 | 0.01 | H2O/60 | 70 | 96 |
| 8 | 0.01 | H2O/60 | 80 | 95 |
| 9 | 0.01 | H2O/70 | 70 | 75 |
| 10 | 0.01 | H2O/80 | 70 | 60 |
| 11 | 0.01a | H2O/60 | 70 | 92 |
| 12 | — | H2O/60 | 70 | 0 |
As the results show, carrying out the model reaction with 0.01 g HANCD@urease in water at 70 °C gives a maximum 96% yield of the precipitated product within 70 min (entry 8), while the reaction with free urease at the same time resulted in 92% yield of product (entry 11). To isolate the catalyst, the precipitated product was dissolved in EtOAc; the catalyst HANCD@urease was filtered, washed with EtOAc and then EtOH/H2O; and the product was isolated after evaporation of the solvent and filtration after addition of water. After structural confirmation of the product, further experiments were followed with the HANCD@urease because of the higher efficiency and more feasible reusability of HANCD-loaded urease than free-urease. Also, the reusability of the biocatalyst HANCD@urease was examined, so after each model experiment, the recycled HANCD@urease was washed with phosphate buffer solution and reused. The results showed that after the sixth run, the yield of product (94%) was reduced only 2%.
Next, we extended the substrate and catalytic activity of HANCD@urease for bio-production of ammonia from urea by employing 0.01 g of this catalyst with 0.18 g urea per 1 mmol of aldehyde in a pseudo-six-component reaction of a number of alkyl acetoacetates and aldehydes with hydrazine hydrate in a molar ratio of 2![[thin space (1/6-em)]](https://www.rsc.org/images/entities/char_2009.gif) :
:![[thin space (1/6-em)]](https://www.rsc.org/images/entities/char_2009.gif) 1
1![[thin space (1/6-em)]](https://www.rsc.org/images/entities/char_2009.gif) :
:![[thin space (1/6-em)]](https://www.rsc.org/images/entities/char_2009.gif) 2 in water at 70 °C (Table 4).
2 in water at 70 °C (Table 4).
| Entry | R | R11 | Time (min) | Yield (%) | Mp (°C)43–45, found (reported) |
|---|---|---|---|---|---|
| 1 | C6H5 | OEt | 80 | 96 | 240–242 (240–242) |
| 2 | 4-Me2NC6H4 | OEt | 110 | 89 | 215–217 (217–218) |
| 3 | 4-Me2NC6H4 | OMe | 90 | 90 | 215–217 (217–218) |
| 4 | 4-O2NC6H4 | OEt | 60 | 98 | <300 (<300) |
| 5 | 4-ClC6H4 | OEt | 70 | 95 | 251–253 (252–254) |
| 6 | 3-O2NC6H4 | OEt | 70 | 97 | 284–286 (286–288) |
| 7 | 4-OH | OEt | 110 | 90 | 216–219 (217–218) |
| 8 | 4-OH | OMe | 80 | 91 | 216–219 (217–218) |
| 9 | 2-ClC6H4 | OEt | 90 | 92 | 219–221 (220–221) |
| 10 | 2-O2NC6H4 | OEt | 70 | 89 | 185–187 (187–188) |
| 11 | 2-O2NC6H4 | OMe | 55 | 90 | 185–187 (187–188) |
According to the results, HANCD-catalyzed synthesis of THPPs in water provides access to a green high yield synthesis of THPPs from the ammonia produced in situ by urea hydrolysis. The performance of HANCD@urease with respect to the reaction yield and time is better than those of previously reported syntheses of THPPs using ammonium acetate.
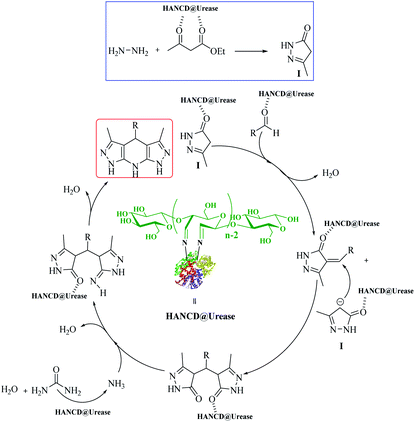
The possible reaction mechanism for HANCD@urease-catalyzed synthesis of THPPs is proposed in Scheme 2. It was presumed that the reaction proceeds by activation of ethyl acetoacetate with HANCD@urease, bio-production of ammonia from urea in the presence of HANCD@urease, and the cooperative role of immobilized urease in closing the reaction components by hydrogen bonding and cyclization of intermediates to final products (Scheme 2).
Conclusions
In this work, various NCDs were prepared by the prewashing of cotton to microcellulose, acid hydrolysis of MC to NC, and periodate oxidation of the given NC under optimized conditions. After determination of the aldehyde content, the HANCD with the highest CHO groups was successfully reacted with urease amino acids to covalently immobilize them as HANCD@urease. The characterized immobilized urease was compared with the free enzyme in respect to activity, stability, and reusability, where the HANCD@urease showed higher thermo-stability than free urease for the in vitro dissociation of urea. The HANCD@urease was used as an in vitro tight source of urease and a stable biosensor for urea determination in blood serum and aqueous samples. Additionally, the urease immobilized on HANCD presented high catalytic activity for the bio-production of ammonia in the efficient synthesis of 3,5-dimethyl-4-aryl-1,4,7,8-tetrahydrodipyrazolo[3,4-b:4′,3′-e]pyridine derivatives in water by a pseudo-six-component reaction of hydrazine hydrate, alkyl acetoacetate, aromatic aldehyde, and urea. High yields, bio-production of ammonia, and facile manipulations are advantages of this useful and green urease-catalyzed protocol.Conflicts of interest
The authors declare no conflicts of interest.Acknowledgements
The authors gratefully acknowledge the Yazd University Research Council.Notes and references
- J. Enoki, M. Linhorst, F. Busch, Á. G. Baraibar, K. Miyamoto, R. Kourist and C. Mügge, Mol. Catal., 2019, 467, 135–142 CrossRef CAS.
- Y. Zhang, S. Xie, M. Yan and O. Ramström, Mol. Catal., 2019, 470, 138–144 CrossRef.
- K. Khoshnevisan, F. Vakhshiteh, M. Barkhi, H. Baharifar, E. Poor-Akbar, N. Zari, H. Stamatis and A.-K. Bordbar, Mol. Catal., 2017, 442, 66–73 CrossRef CAS.
- J. Zdarta, A. S. Meyer, T. Jesionowski and M. Pinelo, Catalysts, 2018, 8, 92 CrossRef.
- E. P. Cipolatti, A. Valério, R. O. Henriques, D. E. Moritz, J. L. Ninow, D. M. G. Freire, E. A. Manoel, R. Fernandez-Lafuente and D. de Oliveira, RSC Adv., 2016, 6, 104675–104692 RSC.
- F. Tamaddon, D. Arab and E. Ahmadi-AhmadAbadi, Carbohydr. Polym., 2020, 229, 115471 CrossRef.
- Z. Y. Zhao, J. Liu, M. Hahn, S. Qiao, A. P. J. Middelberg and L. He, RSC Adv., 2013, 3, 22008–22013 RSC.
- J. C. Polacco, P. Mazzafera and T. Tezotto, Plant Sci., 2013, 199, 79–90 CrossRef.
- M. Lv, X. Ma, D. P. Anderson and P. R. Chang, Cellulose, 2018, 25, 233–243 CrossRef CAS.
- B. L. Krishna, A. N. Singh, S. Patra and V. K. Dubey, Process Biochem., 2011, 46, 1486–1491 CrossRef CAS.
- A. Y. Vargas, H. A. Rojas, G. P. Romanelli and J. J. Martínez, Green Process. Synth., 2017, 6, 377–384 CAS.
- P. Zucca and E. Sanjust, Molecules, 2014, 19, 14139–14194 CrossRef PubMed.
- F. Tamaddon and S. Ghazi, Catal. Commun., 2015, 72, 63–67 CrossRef CAS.
- F. Tamaddon, S. Ghazi and M. R. Noorbala, J. Mol. Catal. B: Enzym., 2016, 127, 89–92 CrossRef CAS.
- M. Hartmann and X. Kostrov, Chem. Soc. Rev., 2013, 42, 6277–6289 RSC.
- S. Sulaiman, M. N. Mokhtar, M. N. Naim, A. S. Baharuddin and A. Sulaiman, Appl. Biochem. Biotechnol., 2015, 175, 1817–1842 CrossRef CAS PubMed.
- B. Sahoo, S. K. Sahu and P. Pramanik, J. Mol. Catal. B: Enzym., 2011, 69, 95–102 CrossRef CAS.
- H. D. Mai, G. Y. Sung and H. Yoo, RSC Adv., 2015, 5, 78807–78814 RSC.
- H.-c. Tsai and R.-a. Doong, Biosens. Bioelectron., 2007, 23, 66–73 CrossRef CAS PubMed.
- H.-H. Deng, H.-P. Peng, K.-Y. Huang, S.-B. He, Q.-F. Yuan, Z. Lin, R.-T. Chen, X.-H. Xia and W. Chen, ACS Sens., 2019, 4, 344–352 CrossRef CAS PubMed.
- E. Hearn and R. J. Neufeld, Process Biochem., 2000, 35, 1253–1260 CrossRef CAS.
- Y. Ispirli Doğaç, İ. Deveci, M. Teke and B. Mercimek, Mater. Sci. Eng., C, 2014, 42, 429–435 CrossRef PubMed.
- K. Gabrovska, A. Georgieva, T. Godjevargova, O. Stoilova and N. Manolova, J. Biotechnol., 2007, 129, 674–680 CrossRef CAS.
- S. Kumar, A. Dwevedi and A. M. Kayastha, J. Mol. Catal. B: Enzym., 2009, 58, 138–145 CrossRef CAS.
- S. Sungur, M. Elcin and U. Akbulut, Biomaterials, 1992, 13, 795–800 CrossRef CAS PubMed.
- S. Mulagalapalli, S. Kumar, R. C. R. Kalathur and A. M. Kayastha, Appl. Biochem. Biotechnol., 2007, 142, 291–297 CrossRef CAS PubMed.
- L. Andrich, M. Esti and M. Moresi, J. Agric. Food Chem., 2010, 58, 6747–6753 CrossRef CAS PubMed.
- E. Çevik, M. Şenel and M. F. Abasıyanık, J. Solid State Electrochem., 2012, 16, 367–373 CrossRef.
- S. J. Eichhorn, Soft Matter, 2011, 7, 303–315 RSC.
- L. K. Kian, M. Jawaid, H. Ariffin and Z. Karim, Int. J. Biol. Macromol., 2018, 114, 54–63 CrossRef CAS.
- F. Tamaddon and D. Arab, Int. J. Biol. Macromol., 2019, 134, 1–10 CrossRef CAS PubMed.
- U.-J. Kim, Y. R. Lee, T. H. Kang, J. W. Choi, S. Kimura and M. Wada, Carbohydr. Polym., 2017, 163, 34–42 CrossRef CAS PubMed.
- L. Münster, Z. Capáková, M. Fišera, I. Kuřitka and J. Vícha, Carbohydr. Polym., 2019, 218, 333–342 CrossRef PubMed.
- C.-F. Huang, C.-W. Tu, R.-H. Lee, C.-H. Yang, W.-C. Hung and K.-Y. Andrew Lin, Polym. Degrad. Stab., 2019, 161, 206–212 CrossRef CAS.
- S. Hokkanen, A. Bhatnagar and M. Sillanpää, Water Res., 2016, 91, 156–173 CrossRef CAS PubMed.
- K. Zhang, M. Shen, H. Liu, S. Shang, D. Wang and H. Liimatainen, Carbohydr. Polym., 2018, 186, 132–139 CrossRef CAS.
- T. Lu, Q. Li, W. Chen and H. Yu, Compos. Sci. Technol., 2014, 94, 132–138 CrossRef CAS.
- K. Rahbar Shamskar, H. Heidari and A. Rashidi, Ind. Crops Prod., 2016, 93, 203–211 CrossRef CAS.
- D. Anand, P. K. Yadav, O. P. Patel, N. Parmar, R. K. Maurya, P. Vishwakarma, K. S. Raju, I. Taneja, M. Wahajuddin and S. Kar, J. Med. Chem., 2017, 60, 1041–1059 CrossRef CAS PubMed.
- J. Safaei-Ghomi, R. Sadeghzadeh and H. Shahbazi-Alavi, RSC Adv., 2016, 6, 33676–33685 RSC.
- Z. Chen, Y. Shi, Q. Shen, H. Xu and F. Zhang, Tetrahedron Lett., 2015, 56, 4749–4752 CrossRef CAS.
- C. Liu, Z. Li, L. Zhao and L. Shen, ARKIVOC, 2009, 2, 258–268 Search PubMed.
- K. Zhao, M. Lei, L. Ma and L. Hu, Monatsh. Chem., 2011, 142, 1169 CrossRef CAS.
- M. Dabiri, P. Salehi, M. Koohshari, Z. Hajizadeh and D. I. MaGee, ARKIVOC, 2014, 204, 204–214 Search PubMed.
- N. G. Shabalala, R. Pagadala and S. B. Jonnalagadda, Ultrason. Sonochem., 2015, 27, 423–429 CrossRef CAS PubMed.
- J. C. Polacco, A. L. Thomas and P. J. Bledsoe, Plant Physiol., 1982, 69, 1233–1240 CrossRef CAS.
- S. M. A. S. Keshk, A. M. Ramadan and S. Bondock, Carbohydr. Polym., 2015, 127, 246–251 CrossRef CAS PubMed.
- T. Saito, S. Kimura, Y. Nishiyama and A. Isogai, Biomacromolecules, 2007, 8, 2485–2491 CrossRef CAS PubMed.
- W. Chen, K. Abe, K. Uetani, H. Yu, Y. Liu and H. Yano, Cellulose, 2014, 21, 1517–1528 CrossRef CAS.
- M. Monier and A. M. A. El-Sokkary, Int. J. Biol. Macromol., 2012, 51, 18–24 CrossRef CAS PubMed.
| This journal is © The Royal Society of Chemistry 2019 |

