 Open Access Article
Creative Commons Attribution 3.0 Unported Licence
Dendrite formation in Li-metal anodes: an atomistic molecular dynamics study
Luis A. Selis and
Jorge M. Seminario *
*
Department of Chemical Engineering, Department of Electrical and Computer Engineering, Department of Materials Science and Engineering, Texas A&M University, College Station, TX 77843, USA. E-mail: seminario@tamu.edu; Tel: +1-979-845-3301
First published on 4th September 2019
Abstract
Lithium-metal is a desired material for anodes of Li-ion and beyond Li-ion batteries because of its large theoretical specific capacity of 3860 mA h g−1 (the highest known so far), low density, and extremely low potential. Unfortunately, there are several problems that restrict the practical application of lithium-metal anodes, such as the formation of dendrites and reactivity with electrolytes. We present here a study of lithium dendrite formation on a Li-metal anode covered by a cracked solid electrolyte interface (SEI) of LiF in contact with a typical liquid electrolyte composed of 1 M LiPF6 salt solvated in ethylene carbonate. The study uses classical molecular dynamics on a model nanobattery. We tested three ways to charge the nanobattery: (1) constant current at a rate of one Li+ per 0.4 ps, (2) pulse train 10 Li+ per 4 ps, and (3) constant number ions in the electrolyte: one Li+ enters the electrolyte from the cathode as one Li+ exits the electrolyte to the anode. We found that although the SEI does not interfere with the lithiation, the mere presence of a crack in the SEI boosts and guides dendrite formation at temperatures between 325 K and 410.7 K at any C-rate, being more favorable at 325 K than at 410.7 K. On the other hand, we find that a higher C-rate (2.2C) favors the lithium dendrite formation compared to a lower C-rate (1.6C). Thus the battery could store more energy in a safe way at a lower C-rate.
Introduction
Combustion of fossil fuels is currently the principal source of energy for transportation and electric power needs. However, due to air pollution and limited reserves, renewable energy sources are of immediate interest. Lithium-ion batteries (LIB) are excellent devices to store energy and are now used in electric vehicles and electronic devices.1,2 With the growing demand for batteries with higher energy density, cathodes and anodes with greater theoretical capacity for the next generation of LIB are needed.2–5Lithium-metal is an ideal anode for rechargeable LIBs due to its low density 0.59 g cm−3,6 very low absolute electrode potential of 1.40 V (−3.04 V vs. standard hydrogen electrode)7–9 and its extremely high theoretical specific capacity of 3860 mA h g−1 (ref. 9–11) compared with current commercial graphite anodes with densities between 2.09 and 2.23 g cm−3 and absolute electrode potential of 1.52 V (+0.12 V vs. Li/Li+)12 and a theoretical specific capacity of 372 mA h g−1.13,14 However, problems such as Li dendrite growth and cracking have limited the practical application of lithium-metal batteries;15–18 lithium dendrite growth can expedite the capacity fade of a battery and make batteries vulnerable to security issues such as burning or destruction of devices during the charge and discharge cycles with liquid electrolytes.8,19,20
Lithium dendrite growth has been extensively investigated in the last decades,21 but lithium dendrite growth is still almost inevitable during charge and discharge cycles of the battery.22,23 Lithium dendrites growth has been detected at the solid–electrolyte interphase (SEI) cracks.16,21 On the other hand, recently Zhang et al. were able to produce dendrite free electrodes using FEC/LiNO3 electrolyte,24 and Mashayek et al.25 has reported Li-ion diffusion through the SEI of Li-metal batteries. In this work we perform MD simulations of a Li-metal anode covered by a SEI of LiF that is initially cracked, and we analyze the effects of the crack on dendrite formation at few conditions of temperature and C-rate as well as of charging protocols. We choose LiF as SEI because the large amount of theoretical and experimental studies since it is one of the main components of SEI when PF6− is used as counterion.24 It was also reported that the lithium ions can diffuse through LiF,25 which certainly hinders to some extent the entry of lithium ions into the anode but does not completely block their entry.
Methodology
All molecular dynamics (MD) simulations are performed using the Large-Scale Atomic/Molecular Massively Parallel Simulator (LAMMPS) program developed by Plimpton et al.26–28 The initial simulation box contains a Li-metal anode covered with a SEI already cracked and an electrolyte of ethylene carbonate (EC) with a 1 M concentration of LiPF6. We choose EC as solvent because it is the most popular solvent for current LIBs;29,30 one of the reasons is its large dielectric constant of 90.5.31,32 The initial simulation box size is 40.8 Å × 54.0 Å × 40.8 Å and contains 640 LiF pairs, 936 Li-metal atoms, 424 EC molecules and 28 LiPF6 ion pairs. The initial geometry of the SEI is taken from an earlier work,33 which was focused in a LiSi anode. Then for this work, we develop an amorphous Li-metal anode which fits geometrically with the SEI. This yields an amorphous geometry in and around the SEI. The metal Li and SEI has a volume of 29![[thin space (1/6-em)]](https://www.rsc.org/images/entities/char_2009.gif) 587 Å3, and the electrolyte (EC and LiPF6) has a volume of 51
587 Å3, and the electrolyte (EC and LiPF6) has a volume of 51![[thin space (1/6-em)]](https://www.rsc.org/images/entities/char_2009.gif) 980 Å3, corresponding to a density of 1.313 g cm−3 of the EC and 1.460 g cm−3 of the electrolyte mix. The initial atomic coordinates of the EC molecules and PF6− ions are obtained through ab initio optimizations of the geometry using Gaussian 09.34 These geometries are used to obtain the whole electrolyte using the Packing Optimization for Molecular Dynamics Simulations (PACKMOL).35 Snapshots of the simulation box are obtained using the Visual Molecular Dynamics software (VMD)36 and 3D visualization Open Visualization Tool (OVITO).37
980 Å3, corresponding to a density of 1.313 g cm−3 of the EC and 1.460 g cm−3 of the electrolyte mix. The initial atomic coordinates of the EC molecules and PF6− ions are obtained through ab initio optimizations of the geometry using Gaussian 09.34 These geometries are used to obtain the whole electrolyte using the Packing Optimization for Molecular Dynamics Simulations (PACKMOL).35 Snapshots of the simulation box are obtained using the Visual Molecular Dynamics software (VMD)36 and 3D visualization Open Visualization Tool (OVITO).37
The cathode in this nanobattery is simplified to a controllable source of ions composed of two layers of 400 frozen strongly bonded pseudo atoms separated by 10 Å (Fig. 1a and b). Li-ions are created in the empty space between the two layers of pseudo atoms. These layers also avoid the periodicity along the electric field direction during all MD simulations (equilibrations and lithiations) which are performed under an NPT ensemble. The nearest neighbor distance between pseudo atoms is set to 2 Å and with a repulsive Lennard-Jones barrier (ε = 1.5 kcal mol−1, σ = 2.5 Å) to avoid interactions between the top and bottom of the simulation box; these barriers prevent any atom traveling from end to end, but they are sufficiently shallow to avoid bond formation, deforming the nearby structures. The layer of pseudo atoms near the electrolyte is at a distance of 2.5 Å from the nearest atoms in the electrolyte. The coordinates of Li-ions created in the Li+ reservoir are randomly determined (Fig. 1b).
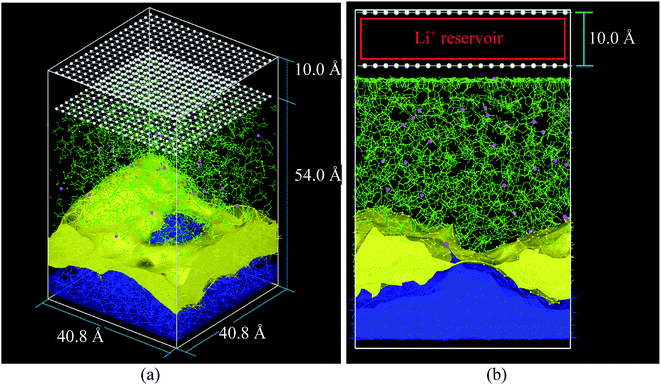 | ||
| Fig. 1 (a) Initial simulation box before the equilibrium, (b) simulation box at the beginning of lithiation. Li-metal (blue), Li+ (pink), EC and PF6− (green), pseudo atoms (white), LiF (yellow) structure taken from an earlier work.33 | ||
Force fields
The interactions between Li-metal atoms and Li-metal atoms with Li+ ions are modeled by a second nearest-neighbor (2NN) embedded MEAM force field,38,39 as it was used in a previous work.40 The MEAM interaction is given by the equation:where Fi(ρi) is the embedding function, ρi is the background electron density at the site atom i occupies, and ψij(Rij) is the pair interaction between atoms i and j at a distance Rij. The background electron density ρ is composed of several partial electron density terms. Each partial electron density is a function of atomic configuration and atomic electron density. The quantities used to generate the functions Fi using density functional theory are given in Table 1. Since Li+ can be seen as a hole (e+ charge) plus a neutral Li0 as per coulombic interactions only, Li+–Li can be partitioned into a Li–Li interaction plus a e+–Li0 interaction. The latter reduces to zero and the former is only useful for distances smaller than 2.5 Å due to the fact that Li+ is reduced at distances smaller than 2.5 Å from the Li-metal atoms. Therefore, we use the same MEAM force field parameters of Li–Li interactions for the interaction between both Li-metal and Li+ at distances smaller than 2.5 Å.
| Parameter | Value |
|---|---|
| Lattice type | BCC |
| Ec (eV) | 38.05 |
| Lattice constant (Å) | 3.509 |
| Z | 8 |
| Weight (g mol−1) | 6.939 |
| rc (Å) | 10 |
Ec is the energy per atom, z is the number of nearest neighbors in the reference structure and rc is the cut off distance. The equilibrium distance in a lithium diatomic molecule using a MEAM force field is 2.419 Å,40 which is close to the experimental distance of 2.672 Å.41
The interactions among the SEI (LiF) atoms are modeled with the Born–Mayer potential,42
| Pair | A (J mol−1) | B (Å−1) | C (J Å6 mol−1) |
|---|---|---|---|
| Li–Li | 1.03 | 1.442 | 10.0 |
| Li–F | 0.28 | 2.934 | −4.0 |
| F–F | 1.31 | 3.695 | 13.9 |
All the interaction between Li+, P, F, C, O, H atoms (electrolyte atoms) are modeled with an updated ReaxFF developed by Mahbubul et al.44 The ReaxFF is a bond-order based potential, including a polarizable charge calculation45–47 that allows the breaking and formation of new bonds and, in consequence, the formation or dissociation of molecules during the simulation.
Nonbonded interactions between the solvent and Li-metal, solvent and SEI, SEI and Li-metal are simulated using a Lennard-Jones (L-J) potential in conjunction with coulombic parameters (Table 3).
It is important to consider that the simulation times used in this work and the experimental times in commercial batteries cannot be compared directly. The simulation time and experimental times are calculated and measured in different scales; thus, we can accelerate the lithiation process and perform simulations in a reasonable computational time. We use large electric fields, which are explained in the Results section. The lithiation process in these simulations only takes a few ps instead of minutes or hours as it would in a real battery.
We define three protocols to charge the battery:
(1) Pulse train (PT): a pulse of 10 Li+ is created at random locations in the Li+ reservoir every 4 ps, regardless of the number of Li+ in the box or the number of Li+ that are reduced at the anode. Thus, the net charge is not necessarily 0 and current is roughly constant.
(2) Constant number of ions (CI): a Li+ is created at random location in the Li+ reservoir every moment that a Li+ is reduced at the anode, i.e., concerted redox reactions. Thus, the number of Li+ in the box remains constant and the total charge is always 0. Under this protocol, current increases with time because Li+ travel distance to reach the anode becomes shorter and shorter due to plating; therefore, Li+ ions reach the anode and new Li+ ions are created more frequently. By comparison, other protocols keep Li+ creation rate constant, and the Li+ travel distance does not change the current.
(3) Constant current (CC): a Li+ is created at random location in the Li+ reservoir every 0.4 ps. The current is closer to be constant than in the PT protocol and the net charge on the whole battery is not necessarily 0 (there must be 28 Li+ in the electrolyte to have 0 total charge).
In these three protocols, when a Li+ reaches the anode, it transforms to a Li-metal atom. We consider a Li+ as having reached the anode when it is at a distance smaller than 2.5 Å from any Li-metal atom.
Lithiation simulations
We consider eight cases, using several electric fields, C-rates, temperatures and protocols to determine what factors favor or restrict lithium dendrite formation. We also use different values of electric field for the Li+, Li, F, and the other atoms in the box. We apply strong electric fields between 1.46 and 1.5 V Å−1 to Li+ to accelerate the lithiation process.The molecular dynamics of all cases are performed under a NPT ensemble with the temperature set at 300 K, but due to the arrival of new ions to the simulation box and the chemical reactions in the electrolyte, the temperature raises to more than 300 K between 325 K and 410 K in average depending of each case. These data are provided and analyzed in the result part, thus short temperature relaxation times of 30 and 50 fs (60 and 100 timesteps) are used to avoid high temperatures that could melt lithium. Also, 100 timesteps is a reasonable value for the temperature relaxation in MD simulations.50 For pressure relaxation at 1 atm we use 10 ps, which is also in the order of the reasonable value by the authors of the program and other MD specialists,51 0.5 ps (1000 timesteps). This relatively large pressure relaxation-time does not allow large changes of volume, which changes due to new few hundreds Li when the total sample has 7880 atoms. Therefore, volume changes are very small. The low change of volume during the whole simulation allows us to use a large pressure relaxation time of 10 ps, which is a time comparable with the times simulated under electrical field. The main parameters of the 8 cases considered are summarized in Table 4.
 is the electric field for Li+,
  is the electric field apply for EC and PF6−, tTrel is the temperature relaxation time and QEq indicate whether charge equilibration is used or not
Electric fields are applied in different ways to atoms and molecules as explained next. We do not apply electric fields to the LiF because an electric field of 1.5 V Å−1 can break the LiF material, mainly because of the large and opposite ionic charges of ±1. The coulombic attraction force and dissociation force by an electric field of 1.5 V Å−1 are 1.04 nN and 2.4 nN, respectively, in a crystalline structure. The LiF SEI is already cracked with an amorphous structure and several broken bonds, and its structure dissociates easily. We apply an electric field of 0.5 V Å−1 to the EC and PF6− in cases 1–5, which do not have charge equilibration (no QEq) because a stronger field (e.g., of 1.5 V Å−1) only increases their mobility, making the lithiation slower. Cases 6–8 have charge equilibration (using QEq) on the atoms that compose the electrolyte, thus the electrolyte atom charges can change. This characteristic helps reactions to take place and makes a more realistic simulation. A problem with performing a charge equilibration is that the computational time increases due to two reasons: the necessary additional calculations for QEq to get the charge of each atom, and the charge change of a Li+ from +1 to a value around +0.55, which means the electric field applies less force to the ions. We ran the previous simulation, and based in the observed results, we estimate that would be approximately 11 times longer than cases without QEq; therefore, to avoid this problem in cases 6–8 (using QEq), the electric field applied to EC and PF6− is 0. This change makes a faster lithiation possible and uses less computational resources because without electric field, the EC and PF6− vibrate less and hinder the passage of the ions less.
Case 5 is the standard or reference one due to the fact that is one of the most used methods to charge a battery. Thus, extended calculations such as the compressive stress and porosity are performed for this case.
Results and Discussions
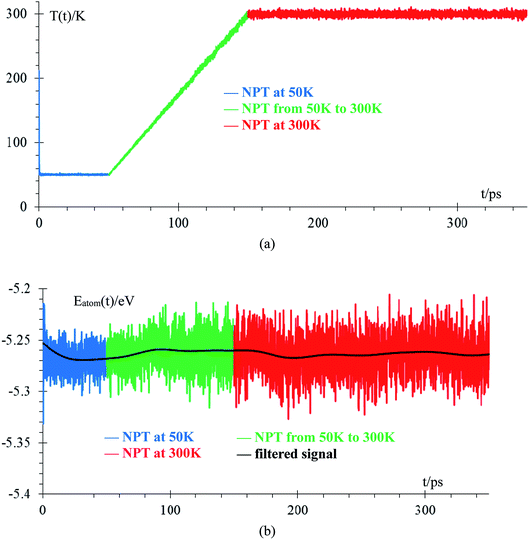
We performed an equilibration of the box in three stages: the first stage is performed at 50 K for 50 ps to eliminate any hot spots in the initial geometry. Then, in the second stage, the temperature is increased from 50 K to 300 K at a rate of 2.5 K ps−1, and finally, in the third stage, the box is equilibrated at 300 K for 200 ps. These 3 stages are performed using the NPT ensemble with a temperature relaxation time of 50 fs and 1 atmosphere, with a pressure relaxation time of 10 ps. Temperature noise increases as temperature increases until reaching 300 K ± 10 K (3% error margin) and we consider the sample equilibrated (Fig. 2a). The total energy per atom for the three stages of the equilibration are shown in Fig. 2b. The filtered average energy for all atom signals is also shown. Increasing the temperature from 50 K to 300 K minimally changes the average energy, less than 1%.The amorphous Li-metal anode stays amorphous after equilibration, but it keeps the properties of bulk Li-metal; for example, the anode has a volume of 18![[thin space (1/6-em)]](https://www.rsc.org/images/entities/char_2009.gif) 618 Å3 and a density of 0.579 g cm−3, which is close to the experimental value of 0.59 g cm−3.6 Nearest neighbor distance in the anode is 3.038 Å (Fig. 3a), and the BCC structure has 8 nearest neighbors, which is the most common nearest neighbor number in this anode by the end of equilibration (Fig. 3b). To determine the number of nearest neighbors, we define the Li–Li cutoff distance as 3.273 Å, taken from the average of the experimental nearest neighbor distance in Li-metal of 3.038 Å and the second-nearest neighbor distance of 3.508 Å.
618 Å3 and a density of 0.579 g cm−3, which is close to the experimental value of 0.59 g cm−3.6 Nearest neighbor distance in the anode is 3.038 Å (Fig. 3a), and the BCC structure has 8 nearest neighbors, which is the most common nearest neighbor number in this anode by the end of equilibration (Fig. 3b). To determine the number of nearest neighbors, we define the Li–Li cutoff distance as 3.273 Å, taken from the average of the experimental nearest neighbor distance in Li-metal of 3.038 Å and the second-nearest neighbor distance of 3.508 Å.
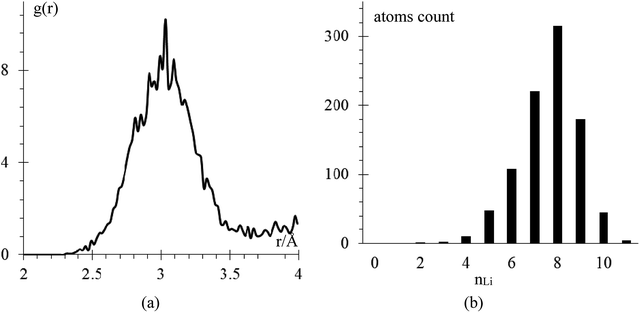 | ||
| Fig. 3 (a) RDF Li–Li after equilibration (b) number of Li atoms in the anode having nLi atom neighbors versus number nLi. There is a total of 936 Li-atoms in the anode. | ||
Different protocols yield different short-circuit times. We define the short-circuit time as the time that takes to the dendrite to growth and touch the cathode as shown in Fig. 4. The charge equilibration roughly doubles the short-circuit time as it reduces the charge of any Li+, thus increasing the short-circuit time. Therefore, we classify the 8 cases in Table 4 into two groups. Cases 1–5 do not perform charge equilibration (no QEq), and cases 6–8 do (QEq). A lithium dendrite forms similarly in 7 of the 8 cases. The exception is the case of htTrel–CI (case 2), where the lithium dendrite grows in a very irregular pattern (Fig. 4).
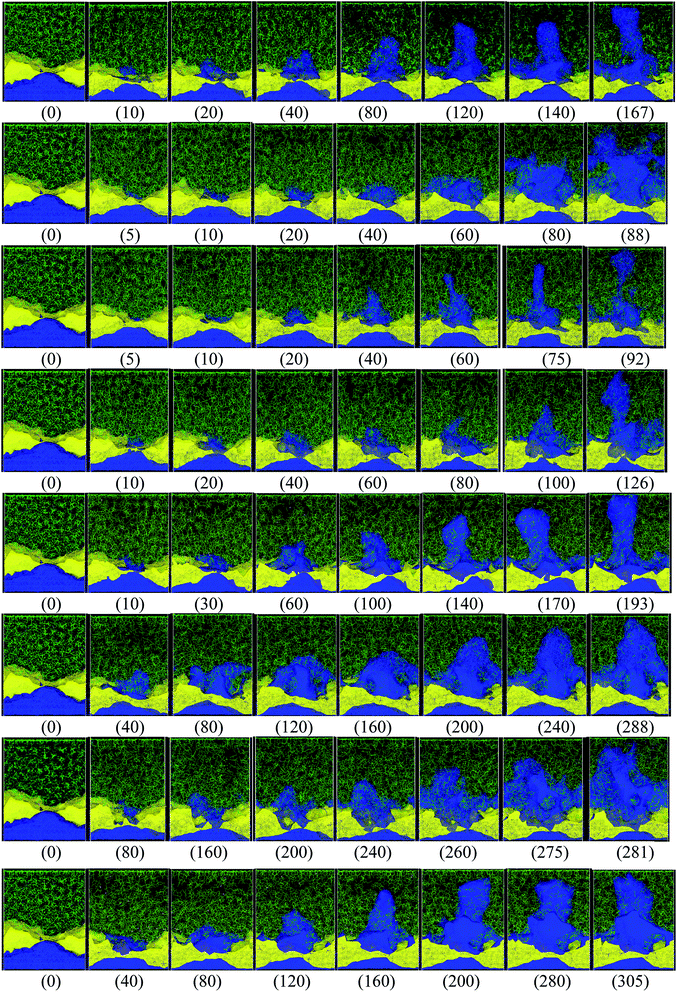 | ||
| Fig. 4 Dendrite growth for cases 1–8, respectively (shown from top to bottom rows, in the same order as shown in Table 4), the label (inside parentheses) indicates the time in ps when the snapshot is taken. Color code: Li-metal (blue), Li+ (pink, very hard to see them), EC and PF6 (green), LiF (yellow). | ||
Temperature and energy per atom change very differently. Temperature (Fig. 5a) is always around 300 K for cases 6–8, i.e., they have similar average temperatures; therefore, these cases could dictate the protocol for better charging of the battery. For the case of the pulse train, every 4 ps, there is a peak in the temperature every 4 ps. When 10 new Li+ enter to the electrolyte, they produce a strong disturbance to the box, which increases random motion and therefore, the temperature increases. Total energies per atom for each case are shown in Fig. 5b. Except for the case 2, all other seems to equilibrate to an steady state; however the strong fluctuations due to the metal–electrolyte interactions can be clearly observed. Volume variations are between 3% and 6%, and variation in length of the simulation box are between 1% and 2% (Fig. 5c). Thus the maximum difference of final volumes is less than 3%, which means that the maximum different in final heights will be less than 1%; therefore, we can assume for the sake of comparisons that all cases yield the same final height at the end of the simulations.
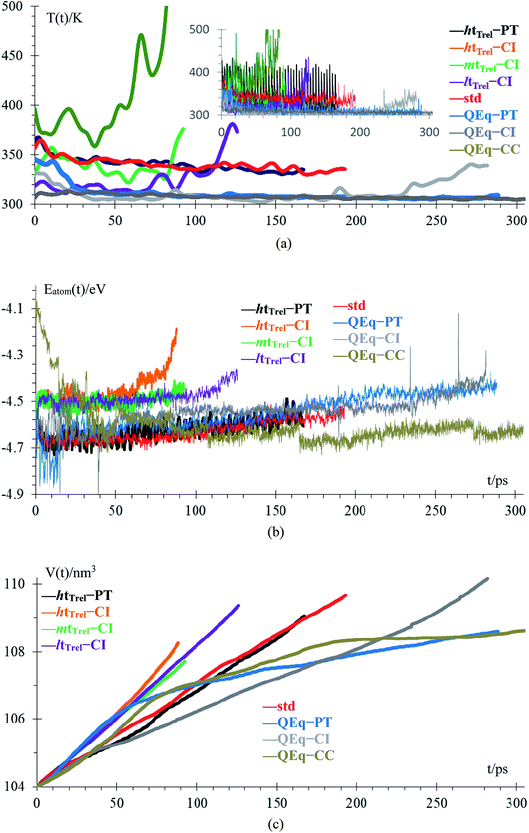 | ||
| Fig. 5 (a) Low-pass filtered temperature signal; original signal in the inset, (b) energy per atom, (c) volume of the box. | ||
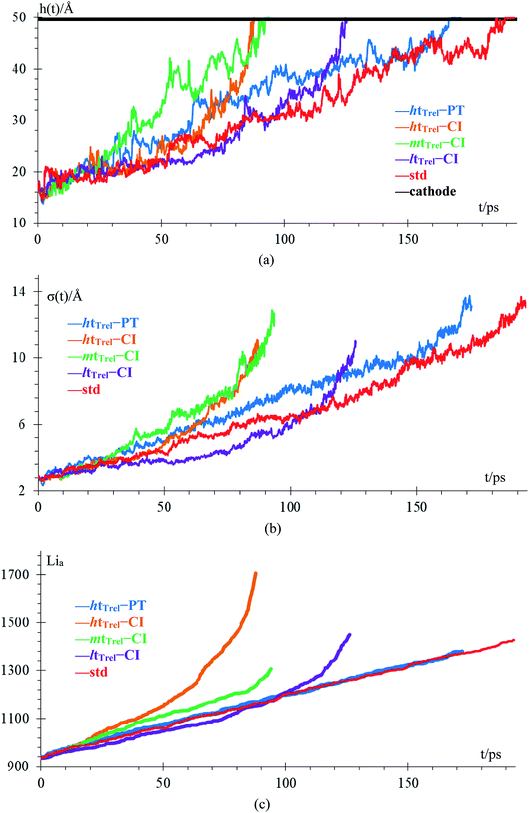
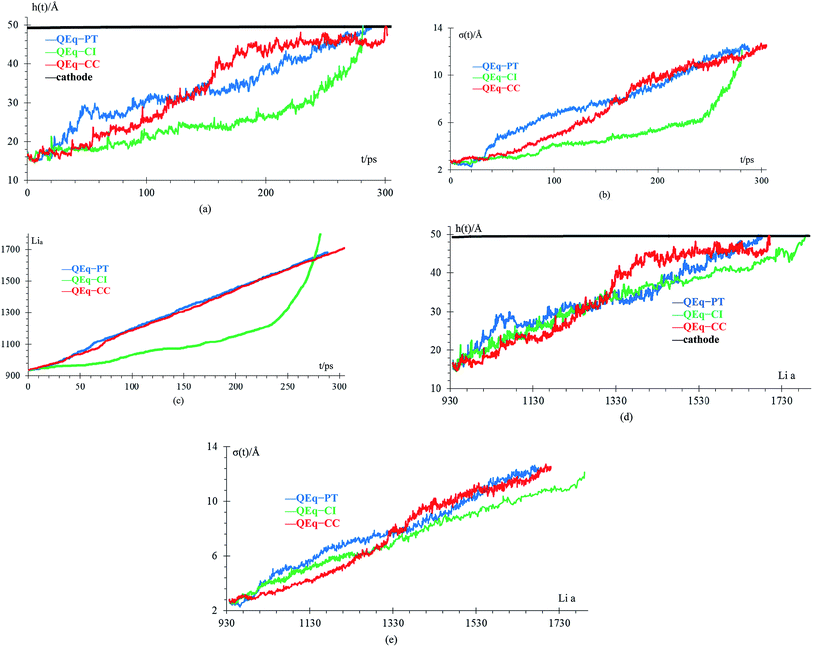
We compare first the cases 1–5 (no QEq) to have a better idea of how the dendrite grows in each case. We calculate the height of the highest dendrite peak corresponding to the highest Li atom that belongs to the dendrite (Fig. 6a). We calculate the standard deviation of heights of lithium atoms in the anode surface with respect to the anode surface (Fig. 6b) to analyze how the shape of the dendrite evolves due to the arrival of lithium atoms in each case. The dendrite height always increases (spatially), and the standard deviation of the heights of lithium atoms in the anode surface increases with time; therefore, the growth is never uniform. We calculate the number of lithium atoms in the anode in each case (Fig. 6c), which is equivalent to the stored potential energy in the battery. The number of lithium atoms in the anode before the short-circuit is different in each case; thus, each case can store a different amount of energy before the short-circuit. The standard deviation of the heights of lithium atoms in the anode surface is given by,
![[h with combining macron]](https://www.rsc.org/images/entities/i_char_0068_0304.gif) is the average height among the highest Li-metal atoms from each sector,
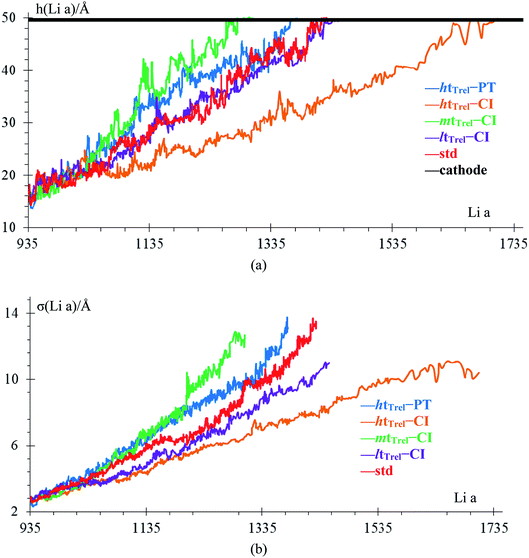
is the average height among the highest Li-metal atoms from each sector,Although we compare cases 1–5 (no QEq), the time comparisons are not a good way to compare them because of the different total simulation times. A better way to compare the cases 1–5 is by using the stored energy, which is equivalent to the number of lithium atoms in the anode (Fig. 7). Height of the highest dendrite peak and standard deviation of heights of lithium atoms in the anode surface tend to grow linearly respect to number of lithium atoms in the anode (stored energy) in all cases.
In cases 1–5, lithium concentrates on the LiF crack, starting the formation of a dendrite. Except for htTrel–CI, the dendrite becomes taller and sharper; however, for htTrel–CI, the dendrite grows very differently than in the other cases. The speed of growth of the dendrite is different for each case, determining the possible rate of charge for a safe use of the battery. We calculate the average temperature during each lithiation and the Li-metal amount before the short circuit in cases 1–5, or no QEq cases (Table 5). Notice that the average temperatures in all cases is always above 325 K, which is higher than the melting temperature of EC (310 K).
| # | Case | Li count | ttotal (ps) | Tave (ps) |
|---|---|---|---|---|
| 1 | htTrel–PT | 1368 | 166.8 | 340.5 |
| 2 | htTrel–CI | 1678 | 88.4 | 410.7 |
| 3 | mtTrel–CI | 1275 | 92.5 | 339.4 |
| 4 | ltTrel–CI | 1402 | 126.2 | 325.0 |
| 5 | Std | 1408 | 193.2 | 340.3 |
In the case of htTrel–CI, the battery can be charged more than in the other cases before the dendrite reaches the top of the electrolyte. This is because the temperatures are higher than in any of the other cases. The velocity of all the atoms increases, and dendrite grows in all directions, making a dendrite with high volume but low height. Therefore, a high temperature could hinder dendrite formation, and the low temperature helps the lithium dendrite growth. The previous result is in accord with previous experiments53,54 and previous computational works.55
In the case of htTrel–CI, 742 Li-ions reach the anode in 88 ps while in the case of mtTrel–CI, 303 Li-ions reach the anode in 88 ps. In the case of ltTrel–CI in the same time period, 217 Li atoms reach the anode. Using this data, we calculate the C-rate for cases 2–4 (Table 6). Assuming the battery has a capacity of 55 A h, the C-rates are scaled to a realistic value, comparing the size of the battery with a typical 55 A h lithium ion battery using the following relationship:
| Case | nLi | I (A g−1) | I (μA) | t1 (h) | Cr (μC) | Crs (C) |
|---|---|---|---|---|---|---|
| htTrel–CI | 742 | 13![[thin space (1/6-em)]](https://www.rsc.org/images/entities/char_2009.gif) 904 904 |
1.349 | 40, 770, 941 | 0.0245 | 5.390 |
| mtTrel–CI | 303 | 13![[thin space (1/6-em)]](https://www.rsc.org/images/entities/char_2009.gif) 883 883 |
0.551 | 99, 848, 511 | 0.0100 | 2.200 |
| ltTrel–CI | 217 | 13![[thin space (1/6-em)]](https://www.rsc.org/images/entities/char_2009.gif) 897 897 |
0.395 | 139, 240, 506 | 0.0072 | 1.584 |
The case of ltTrel–CI can be charged more than the mtTrel–CI, therefore, a high C-rate helps dendrite growth; this result is in agreement with previous experiments.56,57 High C-rate is less important than high temperature for the grow of dendrites. Because of this, the case at htTrel–CI can support more lithium atoms in its anode than any other case.
Due to the fact that an electric field increases the velocity of Li+ ions, lithium dendrite has a high growth rate between 17 and 40 m s−1. Therefore, to compare to experimental results, we need to scale the growth rate using the same factor that we used previously to scale the C-rate (Table 7).
Scaled growth rate is in the same order of magnitude than observed in experiments.58 Actual values of the simulated scaled growth rates are a little lower than in the experiments because temperatures in our simulations are higher than 300 K, which deter dendrite formation.
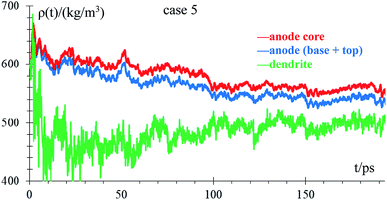
We analyze how the time evolution of the anode density changes during lithiation and whether the density in the anode core is different from that of the dendrite in the standard case. We consider a Li-metal atom to be part of the top of the anode if its height is greater than the height of highest Li-metal at time 0. In case the Li-metal atoms are not part of the top, we consider them part of the anode core regardless of their neighbors. The dendrite has very few atoms at the beginning of lithiation (10 atoms), and the graph of the density of this part has a lot of noise during the firsts ps. Density decreases with time from the beginning of the lithiation (theoretical density is 579 kg m−3) due to the anode becoming porous, with the most porous part being the dendrite. This porosity allows the formation of a low-density lithium dendrite (Fig. 8).
We analyze the compressive stress that the Li-metal anode applies to electrolyte and SEI in standard case (Fig. 9), which performs at an average temperature of 340.3 K, and we calculate the compressive stress from
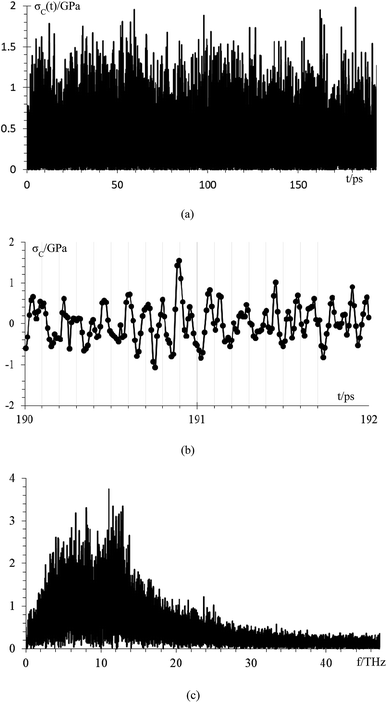 | ||
| Fig. 9 (a) Compressive stress from Li-metal to electrolyte and SEI for case 5, (b) compressive stress from 190 ps to 192 ps, (c) frequency spectrum of the compressive stress signal. | ||
Compressive stress could reach peaks between 1.5 GPa and 2 GPa (Fig. 9a); therefore, the SEI must support this amount of compressive stress to avoid the lithium dendrite formation in a Li-metal anode without structural damage. We estimate, based on the data points of a final part of the signal from 190 to 192 ps (Fig. 9b), that the principal frequency of compressive stress signal is approximately 11 THz, and our sampling frequency is approximately 100 THz which corresponds to taking one sample every ∼9 fs. Therefore, our sampling frequency follows quite well the shape of the signal. To confirm that our sample frequency is appropriate, we calculate the frequency spectrum of the compressive stress signal (Fig. 9c). The principal frequencies are below 15 THz and after 40 THz there are only noise as we are able to remake the original signal from the frequency spectrum up to 40 THz yielding an error margin of less than 1%; therefore, we can consider 40 THz as the maximum frequency and as the sampling frequency of 100 THz is more than twice the maximum frequency of compressive stress, and according to Nyquist–Shannon sampling theorem,59 our sampling frequency is appropriate to represent in the frequency domain, the original time-domain signal.
We compare cases 6–8 using QEq (Fig. 10), and we get that the amount of Li-metal before the short circuit at constant current is greater than at the pulse train, indicating that charging the battery at constant current is more effective than using a pulse train. In each case, a lithium dendrite grows. Li fills in the crack, even having a uniform lithiation, then forms a dendrite until the short-circuit takes place. The standard deviation of heights of lithium atoms in the anode surface also increases with time. All the behavior described before is the same as cases 1–5 (no QEq), which is not being changed by the electronic distribution. Consequentially, all results that we get for cases without QEq would be similar if we made them with charge equilibration.
Finally, case 5 (std) and case 8 (QEq–CC) have the same lithiation rate of 1 Li+ every 0.4 ps, but the case QEq–CC can be charged more before the dendrite reaches the cathode. The main difference between these 2 cases is the use of charge equilibration, which facilitates the reaction in the electrolyte delaying the formation of lithium dendrites.
Conclusions
It is found that the electrolyte reactions delay the dendrite formation. Previous works showed that parts of the lithium dendrite break and remain in the electrolyte through charge/discharge cycles resulting in the formation of dead Li.60 In this work, we show that the dendrite is considerably more porous than the rest of the anode, allowing the formation of larger dendrites with low density and vulnerability to breaking, forming dead Li over multiple charge/discharge cycles. Also, the dendrite never grows spatially homogeneous even under uniform lithiation, but lithium always has a preference to deposit at specific parts of the anode, which causes the shape of the dendrite to change vertically with respect to the surface, increasing the distance between the anode peaks and anode valleys. We conclude that the mere presence of a cracked SEI greatly favors the lithium dendrite formation at the crack. Even if lithiation is uniform throughout the area, the lithium metal naturally will accumulate over the crack, forming a dendrite, and this takes place regardless of how the battery is charged. Certainly, LiF crack is the main driver for the growth of the dendrite. However, Li-ions also go through the uncracked areas of the LiF and get reduced and deposited on the metallic Li-anode underneath, which is still covered by the LiF shell. These deposited Li increase the internal pressure toward further expansion and more cracking of the LiF shell and they actually contribute and help the growth of the dendrite from the bottom in addition to the growth from the top caused by those ions falling on top of the crack or of the growing dendrite tip. Finally, we estimated that the electrolyte must support a compressive stress of at least 2 GPa to avoid the dendrite formation without suffering structural damage at 340 K.Conflicts of interest
There are no conflicts of interest to declare.Acknowledgements
This material is based upon work supported by the U.S. Department of Energy's Office of Energy Efficiency and Renewable Energy (EERE), as part of the Battery 500 Consortium, Award Number DE-EE0008210. We also appreciate the support of computational resources from Texas A and M High Performance Research Computing (TAMU-HPRC) and the Texas Advanced Computing Center (TACC).References
- J. Lu, Z. Chen, Z. Ma, F. Pan, L. A. Curtiss and K. Amine, The role of nanotechnology in the development of battery materials for electric vehicles, Nat. Nanotechnol., 2016, 11(12), 1031 CrossRef CAS PubMed.
- W. Waag, C. Fleischer and D. U. Sauer, Critical review of the methods for monitoring of lithium-ion batteries in electric and hybrid vehicles, J. Power Sources, 2014, 258, 321–339 CrossRef CAS.
- S. Ziemann, D. B. Müller, L. Schebek and M. Weil, Modeling the potential impact of lithium recycling from EV batteries on lithium demand: a dynamic MFA approach, Resour., Conserv. Recycl., 2018, 133, 76–85 CrossRef.
- C. Zhang, W. Lv, Y. Tao and Q.-H. Yang, Towards superior volumetric performance: design and preparation of novel carbon materials for energy storage, Energy Environ. Sci., 2015, 8(5), 1390–1403 RSC.
- X. Zhang, X. Cheng and Q. Zhang, Nanostructured energy materials for electrochemical energy conversion and storage: a review, J. Energy Chem., 2016, 25(6), 967–984 CrossRef.
- P. Bai, J. Li, F. R. Brushett and M. Z. Bazant, Transition of lithium growth mechanisms in liquid electrolytes, Energy Environ. Sci., 2016, 9(10), 3221–3229 RSC.
- A. Zhamu, G. Chen, C. Liu, D. Neff, Q. Fang, Z. Yu, W. Xiong, Y. Wang, X. Wang and B. Z. Jang, Reviving rechargeable lithium metal batteries: enabling next-generation high-energy and high-power cells, Energy Environ. Sci., 2012, 5(2), 5701–5707 RSC.
- C. Wang, Y. Yang, X. Liu, H. Zhong, H. Xu, Z. Xu, H. Shao and F. Ding, Suppression of Lithium Dendrite Formation by Using LAGP-PEO (LiTFSI) Composite Solid Electrolyte and Lithium Metal Anode Modified by PEO (LiTFSI) in All-Solid-State Lithium Batteries, ACS Appl. Mater. Interfaces, 2017, 9(15), 13694–13702 CrossRef CAS PubMed.
- W. Xu, J. Wang, F. Ding, X. Chen, E. Nasybulin, Y. Zhang and J.-G. Zhang, Lithium metal anodes for rechargeable batteries, Energy Environ. Sci., 2014, 7(2), 513–537 RSC.
- G. Zheng, S. W. Lee, Z. Liang, H.-W. Lee, K. Yan, H. Yao, H. Wang, W. Li, S. Chu and Y. Cui, Interconnected hollow carbon nanospheres for stable lithium metal anodes, Nat. Nanotechnol., 2014, 9, 618 CrossRef CAS PubMed.
- D. E. Galvez-Aranda, V. Ponce and J. M. Seminario, Molecular dynamics simulations of the first charge of a Li-ion—Si-anode nanobattery, J. Mol. Model., 2017, 23(4), 120 CrossRef PubMed.
- A. J. Bard, R. Parsons and J. Jordan, Standard Potentials in Aqueous Solution, CRC Press, 1985, vol. 6 Search PubMed.
- E. Peled, C. Menachem, D. Bar-Tow and A. Melman, Improved Graphite Anode for Lithium-Ion Batteries Chemically Bonded Solid Electrolyte Interface and Nanochannel Formation, J. Electrochem. Soc., 1996, 143(1), L4–L7 CrossRef CAS.
- H. Zheng, K. Jiang, T. Abe and Z. Ogumi, Electrochemical intercalation of lithium into a natural graphite anode in quaternary ammonium-based ionic liquid electrolytes, Carbon, 2006, 44(2), 203–210 CrossRef CAS.
- J. Cui, T.-G. Zhan, K.-D. Zhang and D. Chen, The recent advances in constructing designed electrode in lithium metal batteries, Chin. Chem. Lett., 2017, 28(12), 2171–2179 CrossRef CAS.
- C. Yang, K. Fu, Y. Zhang, E. Hitz and L. Hu, Protected Lithium-Metal Anodes in Batteries: From Liquid to Solid, Adv. Mater., 2017, 29(36), 1701169 CrossRef PubMed.
- A. Jana and R. E. García, Lithium dendrite growth mechanisms in liquid electrolytes, Nano Energy, 2017, 41, 552–565 CrossRef CAS.
- P. Barai, K. Higa and V. Srinivasan, Lithium dendrite growth mechanisms in polymer electrolytes and prevention strategies, Phys. Chem. Chem. Phys., 2017, 19(31), 20493–20505 RSC.
- G. Gachot, S. Grugeon, M. Armand, S. Pilard, P. Guenot, J.-M. Tarascon and S. Laruelle, Deciphering the multi-step degradation mechanisms of carbonate-based electrolyte in Li batteries, J. Power Sources, 2008, 178(1), 409–421 CrossRef CAS.
- C. Zhang, Z. Huang, W. Lv, Q. Yun, F. Kang and Q.-H. Yang, Carbon enables the practical use of lithium metal in a battery, Carbon, 2017, 123, 744–755 CrossRef CAS.
- Y. Guo, H. Li and T. Zhai, Reviving Lithium-Metal Anodes for Next-Generation High-Energy Batteries, Adv. Mater., 2017, 29(29), 1700007 CrossRef PubMed.
- F. Wu, Y.-X. Yuan, X.-B. Cheng, Y. Bai, Y. Li, C. Wu and Q. Zhang, Perspectives for restraining harsh lithium dendrite growth: towards robust lithium metal anodes, Energy Storage Materials, 2018, 15, 148–170 CrossRef.
- F. A. Soto, J. M. Martinez de la Hoz, J. M. Seminario and P. B. Balbuena, Modeling solid-electrolyte interfacial phenomena in silicon anodes, Curr. Opin. Chem. Eng., 2016, 13, 179–185 CrossRef.
- X.-Q. Zhang, X. Chen, X.-B. Cheng, B.-Q. Li, X. Shen, C. Yan, J.-Q. Huang and Q. Zhang, Highly Stable Lithium Metal Batteries Enabled by Regulating the Solvation of Lithium Ions in Nonaqueous Electrolytes, Angew. Chem., Int. Ed., 2018, 57, 5301–5305 CrossRef CAS PubMed.
- A. Ramasubramanian, V. Yurkiv, T. Foroozan, M. Ragone, R. Shahbazian-Yassar and F. Mashayek, Lithium Diffusion Mechanism through Solid–Electrolyte Interphase in Rechargeable Lithium Batteries, J. Phys. Chem. C, 2019, 123(16), 10237–10245 CrossRef CAS.
- S. Plimpton, Fast parallel algorithms for short-range molecular dynamics, J. Comput. Phys., 1995, 117(1), 1–19 CrossRef CAS.
- W. M. Brown, P. Wang, S. J. Plimpton and A. N. Tharrington, Implementing molecular dynamics on hybrid high performance computers – short range forces, Comput. Phys. Commun., 2011, 182(4), 898–911 CrossRef CAS.
- W. M. Brown, A. Kohlmeyer, S. J. Plimpton and A. N. Tharrington, Implementing molecular dynamics on hybrid high performance computers – particle–particle particle-mesh, Comput. Phys. Commun., 2012, 183(3), 449–459 CrossRef CAS.
- V. Ponce, D. E. Galvez-Aranda and J. M. Seminario, Analysis of a Li-Ion Nanobattery with Graphite Anode Using Molecular Dynamics Simulations, J. Phys. Chem. C, 2017, 121(23), 12959–12971 CrossRef CAS.
- J. M. Martinez de la Hoz, F. A. Soto and P. B. Balbuena, Effect of the Electrolyte Composition on SEI Reactions at Si Anodes of Li-Ion Batteries, J. Phys. Chem. C, 2015, 119(13), 7060–7068 CrossRef CAS.
- R. Payne and I. E. Theodorou, Dielectric properties and relaxation in ethylene carbonate and propylene carbonate, J. Phys. Chem., 1972, 76(20), 2892–2900 CrossRef CAS.
- Y. Chernyak, Dielectric Constant, Dipole Moment, and Solubility Parameters of Some Cyclic Acid Esters, J. Chem. Eng. Data, 2006, 51(2), 416–418 CrossRef CAS.
- D. E. Galvez-Aranda and J. M. Seminario, Simulations of a LiF Solid Electrolyte Interphase Cracking on Silicon Anodes Using Molecular Dynamics, J. Electrochem. Soc., 2018, 165(3), A717–A730 CrossRef CAS.
- M. J. Frisch, G. W. Trucks, H. B. Schlegel, G. E. Scuseria, M. A. Robb, J. R. Cheeseman, G. Scalmani, V. Barone, G. A. Petersson, H. Nakatsuji, X. Li, M. Caricato, A. Marenich, J. Bloino, B. G. Janesko, R. Gomperts, B. Mennucci, H. P. Hratchian, J. V. Ortiz, A. F. Izmaylov, J. L. Sonnenberg, D. Williams-Young, F. Ding, F. Lipparini, F. Egidi, J. Goings, B. Peng, A. Petrone, T. Henderson, D. Ranasinghe, V. G. Zakrzewski, J. Gao, N. Rega, G. Zheng, W. Liang, M. Hada, M. Ehara, K. Toyota, R. Fukuda, J. Hasegawa, M. Ishida, T. Nakajima, Y. Honda, O. Kitao, H. Nakai, T. Vreven, K. Throssell, J. A. Montgomery Jr, J. E. Peralta, F. Ogliaro, M. Bearpark, J. J. Heyd, E. Brothers, K. N. Kudin, V. N. Staroverov, T. KeithR. Kobayashi, J. Normand, K. Raghavachari, A. Rendell, J. C. Burant, S. S. Iyengar, J. Tomasi, M. Cossi, J. M. Millam, M. KleneC. Adamo, R. Cammi, J. Ochterski, R. Martin, K. Morokuma, O. Farkas, J. Foresman and D. Fox, Gaussian 09; Revision A. 02, Gaussian. Inc., Wallingford, CT, USA, 2016 Search PubMed.
- L. Martínez, R. Andrade, E. G. Birgin and J. M. Martínez, PACKMOL: a package for building initial configurations for molecular dynamics simulations, J. Comput. Chem., 2009, 30(13), 2157–2164 CrossRef PubMed.
- W. Humphrey, A. Dalke and K. Schulten, VMD: visual molecular dynamics, J. Mol. Graphics, 1996, 14(1), 33–38 CrossRef CAS PubMed.
- S. Alexander, Visualization and analysis of atomistic simulation data with OVITO–the Open Visualization Tool, Modell. Simul. Mater. Sci. Eng., 2010, 18(1), 015012 CrossRef.
- Z. Cui, F. Gao, Z. Cui and J. Qu, A second nearest-neighbor embedded atom method interatomic potential for Li–Si alloys, J. Power Sources, 2012, 207, 150–159 CrossRef CAS.
- H. Wang, X. Ji, C. Chen, K. Xu and L. Miao, Lithium diffusion in silicon and induced structure disorder: a molecular dynamics study, AIP Adv., 2013, 3(11), 112102 CrossRef.
- L. A. Selis and J. Seminario, Dendrite formation in silicon anodes of lithium-ion batteries, RSC Adv., 2018, 8(10), 5255–5267 RSC.
- K.-P. Huber, Molecular spectra and molecular structure: IV. Constants of diatomic molecules, Springer Science & Business Media, 2013 Search PubMed.
- M. J. L. Sangster and M. Dixon, Interionic potentials in alkali halides and their use in simulations of the molten salts, Adv. Phys., 1976, 25(3), 247–342 CrossRef CAS.
- H. Luo, S. Xiao, S. Wang, P. Huai, H. Deng and W. Hu, Molecular dynamics simulation of diffusion and viscosity of liquid lithium fluoride, Comput. Mater. Sci., 2016, 111, 203–208 CrossRef CAS.
- M. M. Islam and A. C. T. van Duin, Reductive Decomposition Reactions of Ethylene Carbonate by Explicit Electron Transfer from Lithium: An eReaxFF Molecular Dynamics Study, J. Phys. Chem. C, 2016, 120(48), 27128–27134 CrossRef CAS.
- W. J. Mortier, S. K. Ghosh and S. Shankar, Electronegativity-equalization method for the calculation of atomic charges in molecules, J. Am. Chem. Soc., 1986, 108(15), 4315–4320 CrossRef CAS.
- D. Bedrov, G. D. Smith and A. C. T. van Duin, Reactions of Singly-Reduced Ethylene Carbonate in Lithium Battery Electrolytes: A Molecular Dynamics Simulation Study Using the ReaxFF, J. Phys. Chem. A, 2012, 116(11), 2978–2985 CrossRef CAS PubMed.
- S.-P. Kim, A. C. T. v. Duin and V. B. Shenoy, Effect of electrolytes on the structure and evolution of the solid electrolyte interphase (SEI) in Li-ion batteries: a molecular dynamics study, J. Power Sources, 2011, 196(20), 8590–8597 CrossRef CAS.
- A. K. Rappe, C. J. Casewit, K. S. Colwell, W. A. Goddard and W. M. Skiff, UFF, a full periodic table force field for molecular mechanics and molecular dynamics simulations, J. Am. Chem. Soc., 1992, 114(25), 10024–10035 CrossRef CAS.
- N. Kumar and J. M. Seminario, Lithium-Ion Model Behavior in an Ethylene Carbonate Electrolyte Using Molecular Dynamics, J. Phys. Chem. C, 2016, 120(30), 16322–16332 CrossRef CAS.
- J. Haile and S. Gupta, Extensions of the molecular dynamics simulation method. II. Isothermal systems, J. Chem. Phys., 1983, 79(6), 3067–3076 CrossRef CAS.
- S. Nosé, A unified formulation of the constant temperature molecular dynamics methods, J. Chem. Phys., 1984, 81(1), 511–519 CrossRef.
- M. R. Nadler and C. P. Kempier, Crystallographic Data 186. Lithium, Anal. Chem., 1959, 31(12), 2109 CrossRef CAS.
- A. Aryanfar, A. J. Colussi and M. R. Hoffmann, Lithium dendrite growth control using local temperature variation, Mater. Res. Soc. Symp. Proc., 2014, 1680 Search PubMed.
- C. T. Love, O. A. Baturina and K. E. Swider-Lyons, Observation of lithium dendrites at ambient temperature and below, ECS Electrochem. Lett., 2015, 4(2), A24–A27 CrossRef CAS.
- H. Yan, Y. Bie, X. Cui, G. Xiong and L. Chen, A computational investigation of thermal effect on lithium dendrite growth, Energy Convers. Manage., 2018, 161, 193–204 CrossRef CAS.
- D. Aurbach, E. Zinigrad, Y. Cohen and H. Teller, A short review of failure mechanisms of lithium metal and lithiated graphite anodes in liquid electrolyte solutions, Solid State Ionics, 2002, 148(3), 405–416 CrossRef CAS.
- D. Aurbach, E. Zinigrad, H. Teller and P. Dan, Factors Which Limit the Cycle Life of Rechargeable Lithium (Metal) Batteries, J. Electrochem. Soc., 2000, 147(4), 1274–1279 CrossRef CAS.
- L. Kong, Y. Xing and M. G. Pecht, In Situ Observations of Lithium Dendrite Growth, IEEE Access, 2018, 6, 8387–8393 Search PubMed.
- H. Nyquist, Certain topics in telegraph transmission theory, Trans. Am. Inst. Electr. Eng., 1928, 47(2), 617–644 Search PubMed.
- K.-H. Chen, K. N. Wood, E. Kazyak, W. S. LePage, A. L. Davis, A. J. Sanchez and N. P. Dasgupta, Dead lithium: mass transport effects on voltage, capacity, and failure of lithium metal anodes, J. Mater. Chem. A, 2017, 5(23), 11671–11681 RSC.
| This journal is © The Royal Society of Chemistry 2019 |


![[double bond, length as m-dash]](https://www.rsc.org/images/entities/char_e001.gif)


