DOI:
10.1039/C9RA05016G
(Paper)
RSC Adv., 2019,
9, 34283-34292
An ultra-sensitive label-free electrochemiluminescence CKMB immunosensor using a novel nanocomposite-modified printed electrode†
Received
3rd July 2019
, Accepted 8th October 2019
First published on 24th October 2019
Abstract
This study presents a novel and ultrasensitive electrochemiluminescence approach for the quantitative assessment of creatine kinase MB (CK-MB). Both carbon, carbon nano-onions (CNOs) and metal-based nanoparticles, such as gold nanoparticles (AuNPs) and iron oxide (Fe3O4), were combined to generate a unique nanocomposite for the detection of CKMB. The immunosensor construction involved the deposition of the nanocomposite on the working electrode, followed by the incubation of an antibody and a blocking agent. Tris(2,2′-bipyridyl)-ruthenium(II) chloride ([Ru(bpy)3]2+Cl) was used as a luminophore, where tri-n-propylamine (TPrA) was selected as the co-reactant due to its aqueous immobility and luminescence properties. The analytical performance was demonstrated by cyclic voltammetry on ECL. The characterization of each absorbed layer was performed by cyclic voltammetry (CV) and chronocoulometry (CC) techniques in both EC and ECL. For further characterization of iron oxide, gold nanoparticles and carbon nano-onions, scanning electron microscopy (SEM), transmission electron microscopy (TEM) and X-ray diffraction (XRD) were performed. The proposed immunosensor showcases a wide linear range (10 ng mL−1 to 50 fg mL−1), with an extremely low limit of detection (5 fg mL−1). This CKMB immunosensor also exhibits remarkable selectivity, reproducibility, stability and resistance capability towards common interferences available in human serum. In addition, the immunosensor holds great potential to work with real serum samples for clinical diagnosis.
1. Introduction
Cardiovascular disorders (CVDs) is one of the leading causes of global deaths, accounting for nearly 32% fatalities annually.1 According to the World Health Organization (WHO), nearly 17.5 million people die annually due to cardiovascular diseases and by 2030, the number may rise to 23.3 million worldwide.2 Therefore, the early detection of cardiac biomarkers is important to combat and mitigate the prevalence of this epidemic. Several cardiac biomarkers, such as creatine kinase MB (CKMB), cardiac troponin (cTnT), aspartate transaminase (AST), have been used to detect different coronary conditions. Among these cardiac proteins, the CKMB level remains elevated up to 10–12 hours, making it a valuable and reliable candidate to detect cardiac abnormalities.3,4 Clinically, human creatine kinase is one of the most important biomarkers, and is examined as an indicator of several coronary disorders, such as acute myocardial infraction (AMI), myocarditis, cardiomyopathy, acute coronary syndrome, congenital heart defect, atrial fibrillation, and hypertensive heart disease.5 The CKMB test is mainly conducted when the overall CPK level is raised.6
Several methods, such as conventional blood tests, electrocardiograms (ECG), echocardiograms, CT angiograms, and coronary angiography, are available to detect the CKMB range in several cardiac disorders.7 Later, electrophoresis, ion-exchange chromatography, mass spectrometry, protein mass determination, luminescence, and colorimetric detection, have been introduced.8 Unfortunately, none of these methods are capable of providing the desired information necessary for the early diagnosis of cardiac conditions as these methods are costly and require an expert technician and a high-end laboratory setup.9 Hence, the point of care techniques can be promising alternatives for the early prognosis of several heart complications. Table 1 comprises some of the recently used methods to detect CKMB.
Table 1 Advantages of this study in comparison to other conventional immunoassay methods
| Sensing platform |
Method |
Linear range |
LOD |
References |
| PANI nanowire-based EC biosensors |
DPV |
(100–1000) fg mL−1 |
150 fg mL−1 |
6 |
| Time resolved fluorescence detection |
Nitrogen pulse laser |
(20–500) μg mL−1 |
1 μg mL−1 |
33 |
| Fluorescence intensity detection |
Confocal microscopy |
(10–200) ng mL−1 |
10 ng mL−1 |
26 |
| Chemiluminometric detection |
Chemiluminometry |
(1.0–250) μg mL−1 |
1.23 μg mL−1 |
34 |
| Electrochemical detection |
Chronoamperometry |
(20–200) μg mL−1 |
0.5 μg mL−1 |
35 |
| Electrochemiluminescence detection |
CV |
(10 ng mL−1 to 50 fg mL−1) |
5 fg mL−1 |
Our study |
Recently, electrochemiluminescence-based biosensors are on-trend as they are rapid, highly sensitive and involve no hazardous reagents.10 Electrochemiluminescence (ECL) is a type of chemiluminescence that is generated via electrochemically generated reactive species involved in electron transfer reactions, and can excite a chosen luminophore and is responsible for the emission of light in the presence of an applied potential.11 Different organic luminophores, for instance, tris(2,2′-bipyridyl)-ruthenium(II) ([Ru(bpy)3]2+), quantum dots, and inorganic luminophores, such as yttrium oxide and zinc orthosilicate, are currently being used in several ECL-based techniques.12 In this study, tris(2,2′-bipyridyl)-ruthenium(II) ([Ru(bpy)3]2+) and tri-n-propylamine (TPrA) were selected as the luminophore and co-reactant, respectively, owing to their high aqueous stability and robust luminescence properties. The mechanism of the reaction between ECL [Ru(bpy)3]2+ and TPrA is given below:
| [Ru(bpy)3]2+ − e− → [Ru(bpy)3]3+ |
| [Ru(bpy)3]3+ + TPrA˙ → [Ru(bpy)3]3+ + TPrA fragment |
| [Ru(bpy)3]2+˙ → [Ru(bpy)3]2+ + hν (∼620 nm) |
Since the past decade, screen-printed electrodes (SPEs) are being widely utilized to develop biosensors for the detection of biomarkers as they are capable of carrying out fast, simple and inexpensive fabrication methods along with the luxury of miniaturization.13 The SPE used for this particular study is pre-modified with single-walled carbon nanotubes (SWCNTs), which comprise single-layered rolled-up carbon sheets providing a strong and stable bond that can tolerate extreme conditions (i.e. high temperature and pressure).14 Consequently, the SWCNT-SPE turns into a suitable thermal and electrical conductor,15 possessing characteristics, such as enhanced surface to volume ratio, superior tensile strength, good dispersity and elasticity, allowing uniform morphology throughout the surface of the working electrode.16
Currently, the use of different carbon and metal-based nanomaterials to fabricate highly sensitive immunosensors, which give a remarkable signal amplification is on the rise.17 The inclusion of different nanoparticles having diverse functions and multipurpose sensing areas, with electrochemiluminescence (ECL) has certainly expanded the applications and the acceptability of ECL-based sensors.18 Our proposed immunosensor was fabricated with carbon and metal-based nanoparticles (CNOs, AuNPs, and Fe3O4) to generate a unique nanocomposite (CNOs/AuNPs/Fe3O4/Chi) for a better ECL response. All the nanoparticles used in this study have unique characteristics and potentiality. Gold nanoparticles (AuNPs), for instance, is a well-known signal amplifier having enhanced conductivity and superior shelf life compared to most other available nanoparticles.19 Carbon nanoonion (CNO) is a biocompatible nanomaterial that possesses substantial physical, mechanical, and electronic properties.20 CNOs have a higher conductivity and a large surface area and also serve as a linking layer between AuNPs and the target biomolecule, resulting in a stronger signal amplification.21 Apart from being an excellent conductive nanomaterial, the water solubility and the incredible bio-accessibility of Fe3O4 allows it to retain the thermochemical properties in both high and low pH conditions as well as high temperatures, confirming the significant stability and versatility.22 Finally, chitosan (CS), a polysaccharide which is extensively used as an immobilization matrix for having excellent membrane-forming ability, good adhesion quality and high permeability,23 has been utilized to act as a binder to allow better absorption of different nanomaterials on the working electrode surface.24
In this study, we have developed a novel-label free ECL-based immunosensor incorporating a unique combination of CNOs, AuNPs, Fe3O4 and chitosan to detect CKMB with improved sensitivity and stability. The maximum ECL intensity was observed after the CNOs/AuNPs/Fe3O4/CS formed a thin layer on the surface of the working electrode. Extensive studies were conducted to optimize the immobilization time, blocking, immunocomplex formation time, antibody concentration, detection limit, specificity, and the effect of interferes on the label-free immunosensor. The novelty of this proposed immunosensor lies in the strength of finding better sensitivity to detect traces of CKMB as compared to the recently stated immunosensors,25 without the use of harmful-complex components, enzymes, time-consuming pre-treatments, and labelling of antibody/antigen required in other conventional immunoassay methods.26
2. Materials and methods
2.1 Synthesis of the CNO/Fe3O4/AuNP/CS nanocomposite
The details of reagents and apparatus used for the synthesis of the nanocomposite are described in the ESI sections.† In brief, 100 μg mL−1 CNOs was first prepared by dissolving the stock in distilled water and was sonicated for 3 h for proper dispersion and later, the required concentration (1 μg mL−1) was achieved by serial dilution. Similarly, the Fe3O4 stock was prepared by serially diluting the main stock (20 mg mL−1) into our required concentration (20 μg mL−1) and was sonicated for 30 min. Following that, 20 μg mL−1 AuNPs was prepared by serially diluting the main stock, which was 60 μg mL−1 and was sonicated for 1 h. Subsequently, for the synthesis of CNO/Fe3O4/AuNP/CS nanocomposite, 1 μg mL−1 CNOs, 20 μg mL−1 AuNPs and 20 μg mL−1 Fe3O4 were mixed in 1![[thin space (1/6-em)]](https://www.rsc.org/images/entities/char_2009.gif) :
:![[thin space (1/6-em)]](https://www.rsc.org/images/entities/char_2009.gif) 1 ratio by using a magnetic stirrer for 6 h. After that, 0.1% chitosan was prepared by dissolving 0.01 g of chitosan in 1% acetic acid. Finally, before incubation on the electrode surface, chitosan was mixed with the CNOs/Fe3O4/AuNP composite and ultrasonicated for 1 h to prepare the final CNOs/Fe3O4/AuNP/CS nanocomposite.
1 ratio by using a magnetic stirrer for 6 h. After that, 0.1% chitosan was prepared by dissolving 0.01 g of chitosan in 1% acetic acid. Finally, before incubation on the electrode surface, chitosan was mixed with the CNOs/Fe3O4/AuNP composite and ultrasonicated for 1 h to prepare the final CNOs/Fe3O4/AuNP/CS nanocomposite.
2.2 Fabrication of ECL immunosensor
For the fabrication of the immunosensor, 10 μL of the CNO/Fe3O4/AuNP/CS nanocomposite was drop-casted onto the SWCNT-SPE and left to dry for 2 h at RT for 1 h to allow the formation of a thin film of the nanocomposite. Then, 10 μg mL−1 of anti-CKMB (20 μL) was spiked onto the SWCNT-SPE/CNOs/Fe3O4/AuNP/CS and incubated for 12 h ± 1 at 4 °C. Following that, the working electrode was washed with 10 mM PBS pH 7.4 and dried at RT. Consequent incubation with 0.1% BSA in 0.1% NaN3 (w/v) for 1 h at RT was done to minimize the nonspecific binding sites (as shown in Fig. 1). After appropriate washing and drying steps, the sensor was kept at 4 °C. The electrochemical change and the surface topography for each step of the fabricated immunosensor were examined by ECL, cyclic voltammetry and chronocoulometry. Now, this CKMB immunosensor can be represented as SWCNT-SPE/CNO/Fe3O4/AuNP/CS/anti-CKMB/BSA.
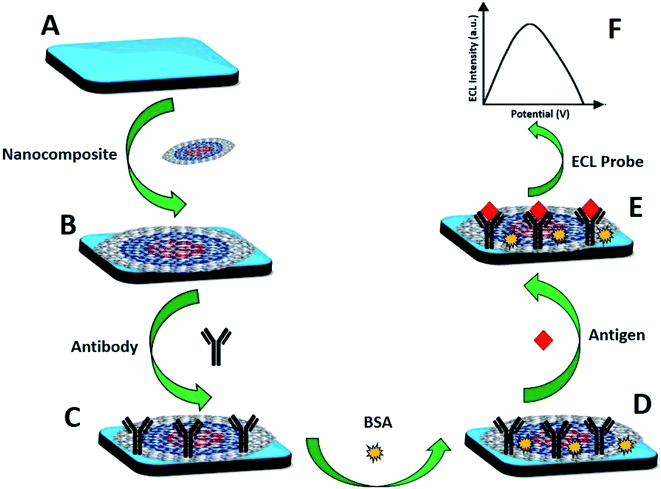 |
| | Fig. 1 Schematic for the fabrication of the label-free electrochemiluminescence CKMB immunosensor and the detection principle: (A) SWCNTs-SPE; (B) CNOs/Fe3O4/AuNPs/CS modified SPE; (C) anti-CKMB spiked immunosensor; (D) BSA blocked immunosensor; (E) immunosensor spiked with the target antigen (CKMB); (F) ECL signal. | |
2.3 ECL detection of CKMB
For the detection of antigen CKMB utilizing our proposed immunosensor, a series of CKMB solutions of different concentrations (10 μL) were spiked on SWCNT-SPE/CNO/Fe3O4/AuNP/CS/anti-CKMB/BSA and incubated for 30 min at room temperature to allow the immunoreaction between the antibody and the analyte (CKMB). The next step was washing by applying 10 mM PBS (pH 7.4) and drying at 21 °C ± 0.5. Following that, the ECL determination of the immunosensor was completed using 1 mL [Ru(bpy)3]2+ and 1 mL TPrA having a molar ratio of 1![[thin space (1/6-em)]](https://www.rsc.org/images/entities/char_2009.gif) :
:![[thin space (1/6-em)]](https://www.rsc.org/images/entities/char_2009.gif) 100. The ECL cell volume was sustained at 4 mL by the addition of 10 mM PBS at pH 7.4. The cell was made up of a 5 cm tubular translucent glass tube entirely enfolded with a silver-mirror film, keeping only the bottom part (diameter 1.5 cm) exposed to allow the transportation of the ECL light to a photomultiplier tube (PMT). The ECL cell was placed above the central part of the PMT, which is capable of detecting ECL intensity inside the light-resistant black container. All ECL signals were determined having a primary voltage of 0.2 V, maximum voltage of 1.25 V, minimum voltage of 0.2 V, scan rate of 100 mV s−1, amplifying series of 3, sensitivity (A/V) of 1 × 10⁻⁶ and a PMT voltage of 700 V. Highest ECL intensity was attained at ∼10 second after the initialization of each practice. Error bars indicate the standard deviations of at least three replicates (n = 3) for all experiments. The study was carried out in accordance with the ethical standard of Helsinki Declaration of 1975, which was revised in 2013 and also with the consent of Universiti Brunei Darussalam's Faculty of Science Research Ethics Committee and the sample donor.
100. The ECL cell volume was sustained at 4 mL by the addition of 10 mM PBS at pH 7.4. The cell was made up of a 5 cm tubular translucent glass tube entirely enfolded with a silver-mirror film, keeping only the bottom part (diameter 1.5 cm) exposed to allow the transportation of the ECL light to a photomultiplier tube (PMT). The ECL cell was placed above the central part of the PMT, which is capable of detecting ECL intensity inside the light-resistant black container. All ECL signals were determined having a primary voltage of 0.2 V, maximum voltage of 1.25 V, minimum voltage of 0.2 V, scan rate of 100 mV s−1, amplifying series of 3, sensitivity (A/V) of 1 × 10⁻⁶ and a PMT voltage of 700 V. Highest ECL intensity was attained at ∼10 second after the initialization of each practice. Error bars indicate the standard deviations of at least three replicates (n = 3) for all experiments. The study was carried out in accordance with the ethical standard of Helsinki Declaration of 1975, which was revised in 2013 and also with the consent of Universiti Brunei Darussalam's Faculty of Science Research Ethics Committee and the sample donor.
3. Results and discussion
3.1 EC and ECL characterization of CNO/Fe3O4/AuNP/CS nanocomposite
For the characterization of the proposed CNO/Fe3O4/AuNP/CS nanocomposite, both ECL (cyclic voltammetry) and EC (cyclic voltammetry, chronocoulometry) analyses were performed, and subsequently the responses when each nanoparticles were added were compared with the bare SPE. The highest ECL peak was recorded when all the nanoparticles were combined and fabricated together as a nanocomposite on the bare SPE electrode, Fig. 2A(e). Furthermore, an increase in the ECL intensity was observed upon the addition of each nanoparticle. Hence, the CNO/Fe3O4/AuNP/CS nanocomposite was selected and chosen as a nanocomposite for further analysis. This increase in the ECL intensity may have arisen from the high electrical conductive properties and the large surface areas of the above mentioned nanoparticles. A similar trend was observed in the electrochemical (EC) detection using cyclic voltammetry and chronocoulometry characterization, Fig. 2B and C, respectively.
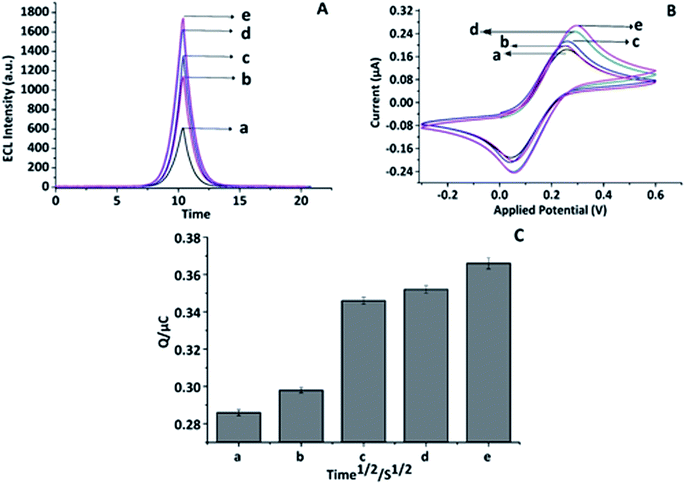 |
| | Fig. 2 Nanocomposite characterization in EC and ECL using cyclic voltammetry and chronocoulometry: (A) ECL: CV line graph of (a) SWCNT-SPE, (b) CNO/SWCNT-SPE, (c) AuNP/CNO/SWCNT-SPE, (d) Fe3O4/AuNP/CNO/SWCNT-SPE, (e) CS/Fe3O4/AuNP/CNO/SWCNTs. (B) EC: CV line graph of (a) SWCNT-SPE, (b) CNO/SWCNT-SPE, (c) AuNP/CNO/SWCNT-SPE, (d) Fe3O4/AuNP/CNO/SWCNT-SPE, (e) CS/Fe3O4/AuNP/CNO/SWCNTs. (C) EC: CC bar diagram of (a) SWCNT-SPE, (b) CNO/SWCNT-SPE, (c) AuNP/CNO/SWCNT-SPE, (d) Fe3O4/AuNP/CNO/SWCNT-SPE, (e) CS/Fe3O4/AuNP/CNO/SWCNTs, (n = 3) at 21.5 ± 0.5 °C in 10 mM PBS, pH 7.4 (n = 3). | |
3.2 Characterization of nanocomposite using scanning electron microscopy (SEM), transmission electron microscopy (TEM) and X-ray diffraction (XRD)
For further confirmation of each layer on the surface of the working electrode, scanning electron microscopy (SEM) was performed. At first, bare SWCNT electrode was analysed. Following that, iron oxide-blue circles (Fe3O4) (Fig. 3A), gold nanoparticles-red circles (AuNPs) (Fig. 3B) and carbon nano-onion-yellow circles (CNOs) (Fig. 3C) were also analysed accordingly. Fe3O4 had small circular-like structures, while AuNPs showed slightly cylindrical bright features. On the addition of CNOs, the electrode surface became less smooth, showcasing more dense and cloudy regions. Thus, all these distinctive features in each layer confirm the visual absorption of three different nanoparticles on the surface of the working electrode successfully. Next, the nanoparticles were characterized by transmission electron microscopy (TEM). The TEM image of carbon nano-onions (CNOs) showed a ring like structure, reconfirming its proper adsorption on the working electrode surface (Fig. 4A). On the other hand, the TEM image of colloidal gold nanoparticles (AuNPs) had a circular surface distribution (Fig. 4B), while the TEM image of iron oxide (Fe3O4) nanoparticles displayed crystal like spherical structures, confirming a uniform morphology throughout the surface (Fig. 4C). Furthermore, the presence of Fe3O4, carbon nano onion and AuNPs were found to be in agreement with their X-ray diffraction patterns (ESI Fig. S10†).
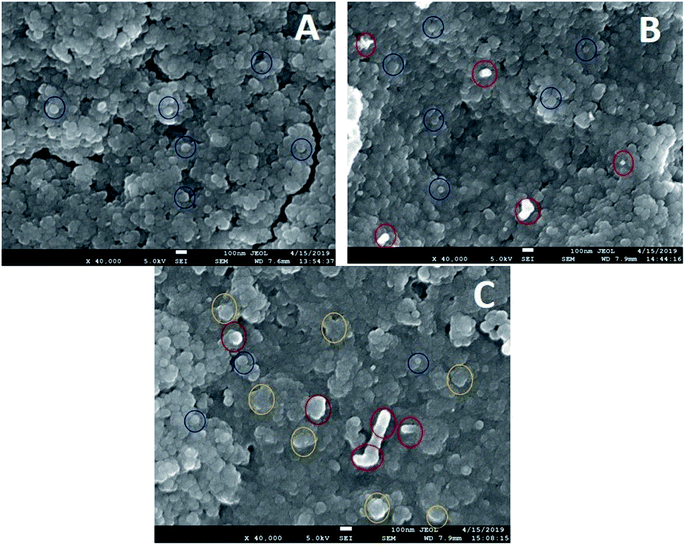 |
| | Fig. 3 SEM images of iron oxide (Fe3O4) (A), gold nanoparticles (AuNPs) (B) and carbon nano-onions (CNOs) (C) at 40![[thin space (1/6-em)]](https://www.rsc.org/images/entities/char_2009.gif) 000×. 000×. | |
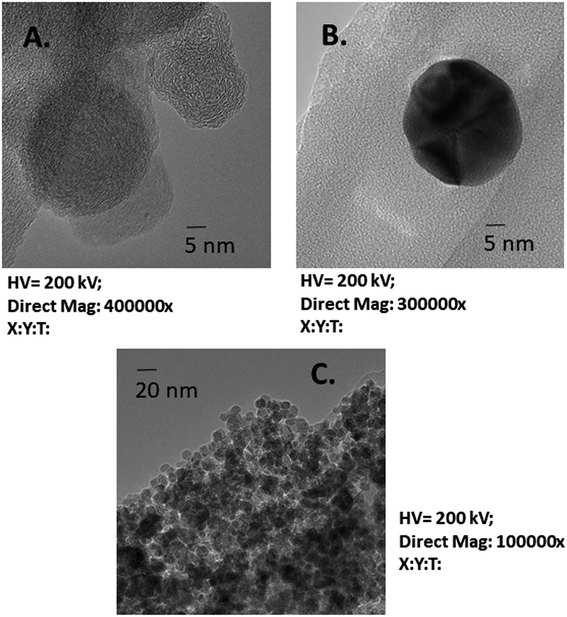 |
| | Fig. 4 TEM images of carbon nano-onions (CNOs at 5 nm) (A), gold nanoparticles (AuNPs at 5 nm) (B) and iron oxide (Fe3O4 at 20 nm) (C). | |
3.3 ECL characterization of SWCNT-SPE/CNOs/Fe3O4/AuNP/CS/anti-CKMB/BSA/Ag
Layer by layer characterization study provided evidence of stepwise absorption of each layer on the surface of the working electrode. At first, the ECL characterization of the SWCNT-SPE/CNO/Fe3O4/AuNP/CS/anti-CKMB/BSA/Ag was performed by applying the CV technique. Here, the ECL response (ECL intensity) was plotted against the potential applied to the working electrode surface and appeared as CV curves shown in Fig. 5A. The bare electrode had the lowest ECL peak (Fig. 5A(a)) whereas the maximum ECL response was recorded when it was fabricated with the freshly prepared nanocomposite (CNOs/Fe3O4/AuNP/CS) (Fig. 5A(b)). The highly conductive behaviour of the nanoparticles and the increase in surface area due to the use of Fe3O4, AuNPs and CNOs may have contributed to the enhanced ECL intensity. However, a slightly gradual decrease in the ECL intensity was observed as more layers (antibody) (Fig. 5A(c)) were subsequently added on the pre-modified SWCNTs working electrode. The lowest ECL response was found when the nanocomposite and antibody fabricated electrodes were incubated with the blocking agent, 0.1% BSA to inhibit specific non-specific binding sites along with the target antigen (Fig. 5A(d)). Henceforth, SWCNTs-SPE/CNOs/Fe3O4/AuNPs/CS/anti-CKMB/BSA was selected to detect different concentrations of the analyte (CKMB).
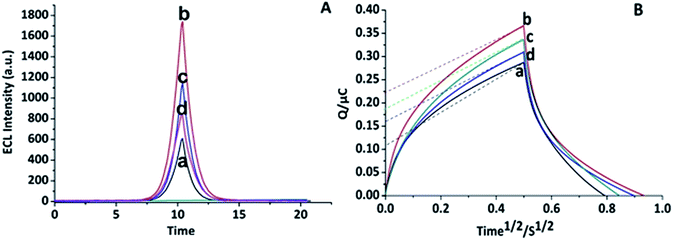 |
| | Fig. 5 Step-wise layer-by-layer characterization study of CKMB immunosensors using ECL (A) cyclic voltammetry: (a) SWCNT-SPE, (b) CNO/Fe3O4/AuNPs/CS/SWCNT-SPE, (c) Ab/CNO/Fe3O4/AuNP/CS/SWCNT-SPE, (d) Ag/BSA/Ab/CNO/Fe3O4/AuNP/CS/SWCNT-SPE measured in luminophore solution, CSE = 100 mV s−1 using 1![[thin space (1/6-em)]](https://www.rsc.org/images/entities/char_2009.gif) : :![[thin space (1/6-em)]](https://www.rsc.org/images/entities/char_2009.gif) 100 [Ru(bpy)3]Cl2–TPrA solution containing 10 mM PBS, pH 7.4; and EC (B) chronocoulometry: (a) SWCNTs-SPE, (b) CNOs/Fe3O4/AuNP/CS/SWCNT-SPE, (c) Ab/CNO/Fe3O4/AuNP/CS/SWCNT-SPE, (d) Ag/BSA/Ab/CNOs/Fe3O4/AuNP/CS/SWCNT-SPE measured in redox probe (5 mM [Fe(CN)6]3−/[Fe(CN)6]4−) solution, CSE = 100 mV s−1 at 21.5 ± 0.5 °C in 10 mM PBS, pH 7.4 (n = 3). 100 [Ru(bpy)3]Cl2–TPrA solution containing 10 mM PBS, pH 7.4; and EC (B) chronocoulometry: (a) SWCNTs-SPE, (b) CNOs/Fe3O4/AuNP/CS/SWCNT-SPE, (c) Ab/CNO/Fe3O4/AuNP/CS/SWCNT-SPE, (d) Ag/BSA/Ab/CNOs/Fe3O4/AuNP/CS/SWCNT-SPE measured in redox probe (5 mM [Fe(CN)6]3−/[Fe(CN)6]4−) solution, CSE = 100 mV s−1 at 21.5 ± 0.5 °C in 10 mM PBS, pH 7.4 (n = 3). | |
3.4 EC characterization of SWCNT-SPE/CNO/Fe3O4/AuN/CS/anti-CKMB/BSA/Ag
Following the ECL characterization of the SWCNT-SPE/CNO/Fe3O4/AuNP/CS/anti-CKMB/BSA/Ag platform, electrochemical (EC) characterization was performed by applying chronocoulometry (CC) for further confirmation. At first, the electrochemically generated charge for each step was analysed. As expected, both EC and ECL characterizations showcase almost similar trends. In brief, the minimum EC signal was recorded with bare SWCNTs-SPE (Fig. 5B(a)) and the highest CC response was found when the working electrode was incubated with the proposed nanocomposite (Fig. 5B(b)). Later, the CC response for antibody (Fig. 5B(c)) and antigen were taken (Fig. 5B(d)). The electrochemical signal gradually decreases after the incorporation of each layer over the thin film of nanocomposite. The lowest signal was found after forming the BSA layer on the electrode, confirming the successful immobilization of each layer on the working electrode surface, ultimately resulting in a highly sensitive CKMB immunosensor.
3.5 Calibration curve and analytical performance
This proposed immunosensor was then evaluated for its capability to determine various concentrations of CKMB from 50 fg mL−1 to 10 ng mL−1 (Fig. 6A). The calibration plot (Fig. 6B) exhibited a negative linear relationship between the log concentrations of CKMB and the current from 50 fg mL−1 to 10 ng mL−1 (R2 = 0.97718) under optimum conditions (at 21 ± 0.5 °C in an air-conditioned research laboratory, in 10 mM PBS pH 7.4, 100 mM [Ru(bpy)3]Cl2 10 mM TPrA under standard atmospheric pressure). As anticipated, with increasing CKMB concentrations, a rise in ECL intensity was noticed. A linear relationship between the log![[thin space (1/6-em)]](https://www.rsc.org/images/entities/char_2009.gif) CKMB concentrations from 50 fg mL−1 to 10 ng mL−1 and the ECL intensity of the CKMB signal was detected as revealed by the calibration graph in Fig. 6B. An exceptionally low experimentally calculated limit of detection (LOD) of 5 fg mL−1 was attained and it is the lowest concentration of CKMB that can be identified in solutions. This minimum LOD might be partially due to the improved ECL properties and conductivity rising from the CNOs/Fe3O4/AuNPs/CS nanocomposite.27 Moreover, the accessibility of a large surface area of the carbon nanomaterial on a carbon-based electrode (SWCNTs-modified SPE) helps to aid fast electron transference and contributes to increased specificity.28
CKMB concentrations from 50 fg mL−1 to 10 ng mL−1 and the ECL intensity of the CKMB signal was detected as revealed by the calibration graph in Fig. 6B. An exceptionally low experimentally calculated limit of detection (LOD) of 5 fg mL−1 was attained and it is the lowest concentration of CKMB that can be identified in solutions. This minimum LOD might be partially due to the improved ECL properties and conductivity rising from the CNOs/Fe3O4/AuNPs/CS nanocomposite.27 Moreover, the accessibility of a large surface area of the carbon nanomaterial on a carbon-based electrode (SWCNTs-modified SPE) helps to aid fast electron transference and contributes to increased specificity.28
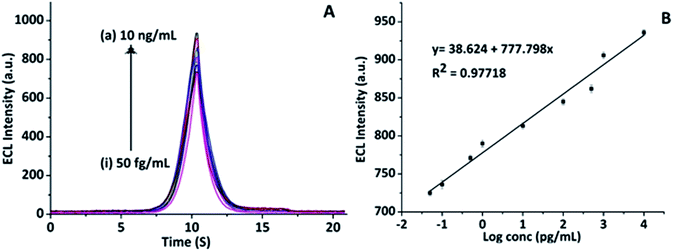 |
| | Fig. 6 Study of the analytical performance of the fabricated immunosensor in detecting CKMB: (A) CV line graph representing different concentrations of CKMB antigens from 10 ng mL−1 to 50 fg mL−1: (a) 10 ng mL−1, (b) 1 ng mL−1, (c) 500 pg mL−1, (d) 100 pg mL−1, (e) 10 pg mL−1, (f) 1 pg mL−1, (g) 0.5 pg mL−1, (h) 0.1 pg mL−1, (i) 0.05 pg mL−1. (B) The calibration curves of the CKMB immunosensors towards different concentrations from 10 ng mL−1 to 50 fg mL−1 of CKMB, graph has been plotted as ECL intensity vs. log concentration for best fitting (n = 3). | |
3.6 Label-free detection principle
In this work, the label-free ECL immunosensor (SWCNTs-SPE/CNOs/Fe3O4/AuNPs/CS/anti-CKMB/BSA) was originally verified for its capacity to determine 100 pg mL−1 CKMB, with the response detected as ECL intensity (ESI Fig. S4A and B†). The relative standard deviation (RSD) value below 5% specified the analytical accuracy of this biosensor.25 Moreover, the isoelectric point (pI) of CKMB is 5.3,29 confirming that it will carry an overall negative charge at the working pH 7.4, attracting the positively charged luminophore ([Ru(bpy)3]Cl2) and the co-reactant (TPrA).30 Consequently, the dissemination of [Ru(bpy)3]Cl2–TPrA onto the immunocomplex amplified with the increasing CKMB concentration, resulting in an enhanced ECL response. Meanwhile, a persistent and distinctive ECL signal was measured in the presence of 100 pg mL−1 of CKMB, attributing to the diffusion of [Ru(bpy)3]Cl2–TPrA onto the surface of the immunosensor after the emergence of the immunocomplex. To further confirm that the ECL system is dependent on the diffusion controlled electrochemiluminescence process of [Ru(bpy)3]Cl2–TPrA, cyclic voltammetry analysis (ESI Fig. S5†) was performed, which revealed that in the presence of the analyte (CKMB), the total charge determined was enhanced, representing that more [Ru(bpy)3]Cl2 dispersed towards the CKMB protein. In addition to that, diffusion kinetics were studied using cyclic voltammetry on EC in the existence of [Fe(CN)6]3−/[Fe(CN)6]4− correspondingly on the immunosensor surface at the scan rates of 20 mVs−1 to 100 mV s−1 (ESI Fig. S7†). The linear relationship between the oxidation-reduction peaks and the square root of the scan rate was established in EC as in both cases, the height of the peaks increased with the increasing scan rate (Fig. S8A and B†), confirming the dependency on electrochemical diffusion.31 Similarly, in ECL, the graph (and ESI Fig. S6A and B†) representing the oxidation and reduction peaks vs. square root of scan rates exposed a linear association supporting the earlier findings. Moreover, chronocoulometry analysis was performed to confirm the [Ru(bpy)3]Cl2–TPrA diffusion-controlled electrochemical process (ESI Fig. S3A and B†).
3.7 Reproducibility, stability, selectivity and interference assessment
In order to evaluate the reproducible ability of our fabricated CKMB, five different electrodes were tested at five distinct times using the same concentration (100 pg mL−1) and the incubation time with the target protein (CKMB). Following that, each response of those fabricated electrodes was recorded and compared accordingly, Fig. 7A. The proposed immunosensor was found to have an extremely significant reproducibility confirming the potentiality required to be a valuable biosensor. For the stability assessment of the immunosensor, the ECL signal was recorded at each five-day interval to estimate how long the immunosensors provide similar signals compared to the freshly prepared sensors, Fig. 7B. The electrodes were stored at 4 °C for long term storage. We found that the immunosensor has an exceptional stability up to twenty-one days of incubation. Next, the specificity of the immunosensor was checked by incubating the sensor with ten different proteins commonly found in human serum and the ECL response was compared with the same concentration (100 pg mL−1) of the target protein, Fig. 7C. As expected, the ECL peak height was a maximum when the immunosensor was incubated with the target protein (CKMB). Finally, to monitor the interference capability of the CKMB sensors, the target protein was mixed with three other cardiac proteins and the ECL analysis was performed. The immunosensor was found to possess excellent interference ability as no significant response was obtained as shown in Fig. 7D. This evidently stipulates that this proposed immunosensor is selective towards serum CKMB.
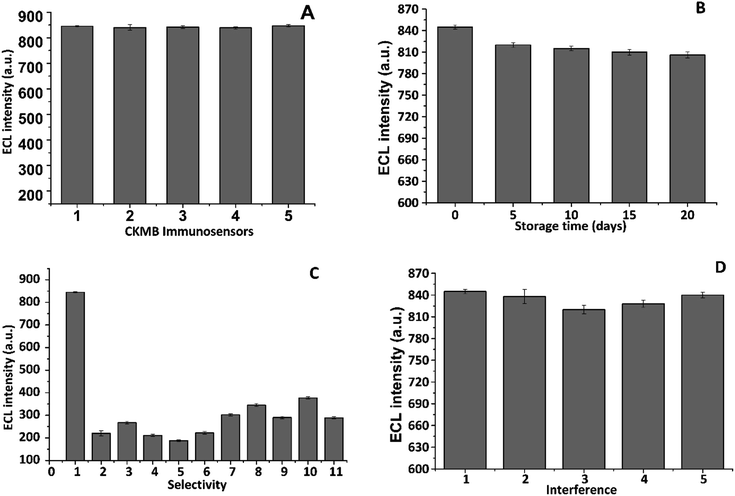 |
| | Fig. 7 Analysis of reproducibility, stability, selectivity and interference-resistance of the immunosensor. (A) BSA/CNOs/Fe3O4/AuNPs/CS/SWCNTs-SPE immunosensors were incubated with 100 pg mL−1 CKMB and their signals were recorded; (B) BSA/CNOs/Fe3O4/AuNPs/CS/SWCNTs-SPE immunosensor incubated with 100 pg mL−1 CKMB and stored at 4 °C. Signals were recorded and assessed at five-day intervals to study the long-term stability of the immunosensors; (C) CKMB immunosensor was tested against other analytes known to be present in serum and the signal was recorded. The different samples tested were: (1) 100 pg mL−1 CKMB; (2) 100 pg mL−1 HP; (3) 100 pg mL−1 HCG; (4) 100 pg mL−1 leptin; (5) 100 pg mL−1 CRP; (6) 100 pg mL−1 CEA; (7) 100 pg mL−1 cTnT; (8) 100 pg mL−1 cTnI; (9) 100 pg mL−1 cortisol; (10) 100 pg mL−1 β-2M; (11) 100 pg mL−1 AFP (n = 3); and (D) CKMB immunosensor was tested against 100 pg mL−1 of CKMB in combination with 1000 pg mL−1 of other analytes known to be present in serum and the signal recorded. The samples tested were (1) CKMB only, (2) CKMB + cTnT, (3) CKMB + cTnI, (4) CKMB + β-2M, (5) CKMB + cTnT + cTnI + β-2M (n = 3). | |
3.8 Real sample analysis
The capability of the label-free electrochemical immunosensor for the real-world applications was examined by determining the concentration of CKMB in serum samples of a healthy donor. At first, serum samples were diluted with 10 mM pH 7.4. PBS buffer to 10×, 100×, 1000× and 10![[thin space (1/6-em)]](https://www.rsc.org/images/entities/char_2009.gif) 000×. Next, 100 pg mL−1 CKMB was introduced to each dilution. The highest reduction in the signal was observed at dilutions higher than 1000× (ESI Fig. S9†). Later, three different concentrations of CKMB (200, 300 and 500 pg mL−1) were examined for the immunosensor's practical application in identifying CKMB at a dilution factor of 1000×. The RSD (relative standard deviation) value for each CKMB concentration used here is between 0.52% to 0.81% and the recovery range is between 98–103%. These results, summarized in Table 2, validate that the fabricated immunosensor has a substantial prospective for the detection of CKMB in real serum samples.
000×. Next, 100 pg mL−1 CKMB was introduced to each dilution. The highest reduction in the signal was observed at dilutions higher than 1000× (ESI Fig. S9†). Later, three different concentrations of CKMB (200, 300 and 500 pg mL−1) were examined for the immunosensor's practical application in identifying CKMB at a dilution factor of 1000×. The RSD (relative standard deviation) value for each CKMB concentration used here is between 0.52% to 0.81% and the recovery range is between 98–103%. These results, summarized in Table 2, validate that the fabricated immunosensor has a substantial prospective for the detection of CKMB in real serum samples.
Table 2 Recovery of the fabricated label-free electrochemiluminescence CKMB immunosensor in real human serum samples
| Dilution factors of the serum samples |
Added conc. (pg mL−1) |
Found conc. (pg mL−1) |
RSD% |
Recovery% |
| 1000× |
200 |
207 |
0.52 |
103 |
| 300 |
296 |
0.67 |
98 |
| 500 |
509 |
0.81 |
101 |
4. Conclusion
In our work, we have established a novel and label-free ECL immunosensor for the determination of CKMB using the CNOs/Fe3O4/AuNPs/CS nanocomposite on modified SWCNTs-SPEs. The modified platform of SWCNTs-SPE/CNOs/Fe3O4/AuNPs/CS has been used for the very first time for the fabrication of label-free ECL immunosensors representing enhanced sensitivity in comparison to existing immunosensors.32 In addition, the improved analytical performance was confirmed regarding the sensitivity by determining a remarkably low detection limit (LOD) of 5 fg mL−1. Additionally, the proposed immunosensor showcased an extensive linear range of detection between 50 fg mL−1 and 10 ng mL−1, with a promising potentiality to evaluate the deficiency and the excessive expression of the target (analyte). Besides the decent repeatability, stability and specificity ensured its constructive applications for the analysis of CKMB in real serum samples, which can be employed ubiquitously from the hospital to patient's house with great possibility for commercial applications compared to the currently available biosensors.
Funding
This project was partly supported by the Brunei Research Council [grant no. 10] of Negara Brunei Darussalam and “Nanotechnology Platform Project (Nanotechnology Open Facilities in Osaka University)” of Ministry of Education, Culture, Sports, Science and Technology, Japan [grant no. A-19-OS-0041].
Conflicts of interest
The authors declare no financial or commercial conflict of interest.
Acknowledgements
Juthi Adhikari wishes to thank the UBD's University graduate scholarship (UGS) for her PhD fellowship.
References
- J. Masson, T. Battaglia, P. Khairallah, S. Beaudoin and K. Booksh, Anal. Chem., 2007, 79, 612–619 CrossRef CAS.
- S. Moghadam, C. Oddis and R. Aggarwal, Clevel. Clin. J. Med., 2016, 83, 37–39 CrossRef.
- C. Dellas, M. Puls, M. Lankeit, K. Schafer, M. Cuny, M. Berner, G. Hasenfuss and S. Konstantinides, J. Am. Coll. Cardiol., 2010, 55, 2150–2157 CrossRef CAS.
- B. McDonnell, S. Hearty, P. Leonard and R. O'Kennedy, Clin. Biochem., 2009, 42, 549–561 CrossRef CAS.
- J. Pultar, U. Sauer, P. Domnanich and C. Preininger, Biosens. Bioelectron., 2009, 24, 1456–1461 CrossRef CAS.
- D. Matta, S. Tripathy, S. Krishna, C. Sharma and S. Singh, Biomed. Microdevices, 2016, 18, 111–113 CrossRef.
- S. Shin, Y. Zhang, D. Kim, A. Manbohi and H. Avci, Anal. Chem., 2016, 88, 10019–10027 CrossRef CAS.
- M. Mohammed and M. Desmulliez, Lab Chip, 2011, 11, 569–595 RSC.
- X. Yang, Y. Zhao, L. Sun, H. Qi, Q. Gao and C. Zhang, Sens. Actuators, B, 2018, 257, 60–67 CrossRef CAS.
- M. Rizwan, N. F. Mohd-Naim, N. A. Keasberry and M. U. Ahmed, Anal. Methods, 2017, 9, 2570–2577 RSC.
- M. Rizwan, D. Koh, M. H. Booth and M. U. Ahmed, Sens. Actuators, B, 2018, 255, 557–563 CrossRef CAS.
- S. Roy, S. X. Wei, J. Z. Ying, M. Safavieh and M. U. Ahmed, Biosens. Bioelectron., 2016, 86, 346–352 CrossRef CAS.
- M. Rizwan, S. Elma, S. A. Lim and M. U. Ahmed, Biosens. Bioelectron., 2018, 107, 211–217 CrossRef CAS.
- K. Mistry, K. Layek, A. Mahapatra, C. Chaudhuri and H. Saha, Analyst, 2014, 139, 2289–2311 RSC.
- M. U. Ahmed, M. M. Hossain, M. Y. Safavieh, L. Wong, I. Rahman, M. E. Zourob and E. Tamiya, Crit. Rev. Biotechnol., 2016, 4, 1–11 Search PubMed.
- M. U. Ahmed, I. Saaem and A. S. Brown, Crit. Rev. Biotechnol., 2014, 34, 180–196 CrossRef.
- S. A. Lim, H. Yoshikawa, E. Tamiya and M. U. Ahmed, RSC Adv., 2014, 4, 58460–58466 RSC.
- S. A. Lim and M. U. Ahmed, RSC Adv., 2016, 6, 24995–25014 RSC.
- E. Hutter, S. Boridy, S. Labrecque, M. Lalancette, J. Kriz, F. M. Winnik and D. Maysinger, ACS Nano, 2010, 2595–2606 CrossRef CAS.
- R. N. Goyal, V. K. Gupta and S. Chatterjee, Sens. Actuators, B, 2010, 149, 252–258 CrossRef CAS.
- J. Bartelmess and S. Giordani, Beilstein J. Nanotechnol., 2014, 5, 1980–1998 CrossRef.
- V. Orel, A. Shevchenko, A. Romanov, M. Tselepi, T. Mitrelias, C. H. W. Barnes, A. Burlaka and S. Lukin, Nanomedicine, 2015, 11, 47–55 CrossRef CAS.
- K. J. Huang, Z. W. Wu, Y. Y. Wu and Y. M. Liu, Can. J. Chem., 2012, 90, 608–615 CrossRef CAS.
- J. Wang, Y. Shan, W. Zhao, J. Xu and H. Y. Chen, Anal. Chem., 2012, 83, 4004–4011 CrossRef.
- K. J. Huang, D. J. Niu, W. Z. Xie and W. Wang, Anal. Chim. Acta, 2010, 659, 102–108 CrossRef CAS.
- W. Jiandong, D. Meili, S. Susy, R. Claudio, L. Yong and L. Francis, Sensors, 2017, 17, 2934 CrossRef PubMed.
- G. Oliviero, M. Chiari, E. Lorenzi, R. Colombo, M. Cretich, F. Damin, S. Federici and E. Depero, Sens. Actuators, B, 2013, 176, 1026–1031 CrossRef CAS.
- W. Kong, H. Zhou, H. Ouyang, Z. Lia and Z. Fu, Anal. Methods, 2014, 6, 2959–2964 RSC.
- H. Yue, Z. Zhou, P. Wang, X. Wang, L. Wang and Z. Fu, Talanta, 2016, 153, 401–406 CrossRef CAS.
- A. Qureshi, Y. Gurbuz and J. Niazi, Sens. Actuators, B, 2012, 171, 62–76 CrossRef.
- C. Renato, M. C. R. Monteiro, N. Laure, B. Jean and L. Phillipe, Kidney Int., 1985, 28, 666–671 CrossRef PubMed.
- H. Xing, Q. Zhai, X. Zhang, J. Li and E. Wang, Anal. Chem., 2018, 90, 2141–2147 CrossRef CAS.
- X. Huang, Z. Aguilar, H. Xu, W. Lai and Y. Xiong, Biosens. Bioelectron., 2016, 75, 166–180 CrossRef CAS.
- Y. Dong, T. Gao, Y. Zhou, L. Jiang and J. Zhu, Sci. Rep., 2015, 5, 1–10 CAS.
- F. Zhou, M. Lu, W. Wang, Z. Bian, R. Zhang and J. Zhu, Clin. Chem., 2010, 56, 1701 CrossRef CAS.
Footnote |
| † Electronic supplementary information (ESI) available. See DOI: 10.1039/c9ra05016g |
|
| This journal is © The Royal Society of Chemistry 2019 |
Click here to see how this site uses Cookies. View our privacy policy here.  Open Access Article
 a,
Natasha Ann Keasberry
 a,
Abdul Hanif Mahadi
 b,
Hiroyuki Yoshikawa
 c,
Eiichi Tamiya
 cd and
Minhaz Uddin Ahmed
 *a
*a
![[thin space (1/6-em)]](https://www.rsc.org/images/entities/char_2009.gif) :
:![[thin space (1/6-em)]](https://www.rsc.org/images/entities/char_2009.gif) 1 ratio by using a magnetic stirrer for 6 h. After that, 0.1% chitosan was prepared by dissolving 0.01 g of chitosan in 1% acetic acid. Finally, before incubation on the electrode surface, chitosan was mixed with the CNOs/Fe3O4/AuNP composite and ultrasonicated for 1 h to prepare the final CNOs/Fe3O4/AuNP/CS nanocomposite.
1 ratio by using a magnetic stirrer for 6 h. After that, 0.1% chitosan was prepared by dissolving 0.01 g of chitosan in 1% acetic acid. Finally, before incubation on the electrode surface, chitosan was mixed with the CNOs/Fe3O4/AuNP composite and ultrasonicated for 1 h to prepare the final CNOs/Fe3O4/AuNP/CS nanocomposite.
![[thin space (1/6-em)]](https://www.rsc.org/images/entities/char_2009.gif) :
:![[thin space (1/6-em)]](https://www.rsc.org/images/entities/char_2009.gif) 100. The ECL cell volume was sustained at 4 mL by the addition of 10 mM PBS at pH 7.4. The cell was made up of a 5 cm tubular translucent glass tube entirely enfolded with a silver-mirror film, keeping only the bottom part (diameter 1.5 cm) exposed to allow the transportation of the ECL light to a photomultiplier tube (PMT). The ECL cell was placed above the central part of the PMT, which is capable of detecting ECL intensity inside the light-resistant black container. All ECL signals were determined having a primary voltage of 0.2 V, maximum voltage of 1.25 V, minimum voltage of 0.2 V, scan rate of 100 mV s−1, amplifying series of 3, sensitivity (A/V) of 1 × 10⁻⁶ and a PMT voltage of 700 V. Highest ECL intensity was attained at ∼10 second after the initialization of each practice. Error bars indicate the standard deviations of at least three replicates (n = 3) for all experiments. The study was carried out in accordance with the ethical standard of Helsinki Declaration of 1975, which was revised in 2013 and also with the consent of Universiti Brunei Darussalam's Faculty of Science Research Ethics Committee and the sample donor.
100. The ECL cell volume was sustained at 4 mL by the addition of 10 mM PBS at pH 7.4. The cell was made up of a 5 cm tubular translucent glass tube entirely enfolded with a silver-mirror film, keeping only the bottom part (diameter 1.5 cm) exposed to allow the transportation of the ECL light to a photomultiplier tube (PMT). The ECL cell was placed above the central part of the PMT, which is capable of detecting ECL intensity inside the light-resistant black container. All ECL signals were determined having a primary voltage of 0.2 V, maximum voltage of 1.25 V, minimum voltage of 0.2 V, scan rate of 100 mV s−1, amplifying series of 3, sensitivity (A/V) of 1 × 10⁻⁶ and a PMT voltage of 700 V. Highest ECL intensity was attained at ∼10 second after the initialization of each practice. Error bars indicate the standard deviations of at least three replicates (n = 3) for all experiments. The study was carried out in accordance with the ethical standard of Helsinki Declaration of 1975, which was revised in 2013 and also with the consent of Universiti Brunei Darussalam's Faculty of Science Research Ethics Committee and the sample donor.

![[thin space (1/6-em)]](https://www.rsc.org/images/entities/char_2009.gif) 000×.
000×.
![[thin space (1/6-em)]](https://www.rsc.org/images/entities/char_2009.gif) CKMB concentrations from 50 fg mL−1 to 10 ng mL−1 and the ECL intensity of the CKMB signal was detected as revealed by the calibration graph in Fig. 6B. An exceptionally low experimentally calculated limit of detection (LOD) of 5 fg mL−1 was attained and it is the lowest concentration of CKMB that can be identified in solutions. This minimum LOD might be partially due to the improved ECL properties and conductivity rising from the CNOs/Fe3O4/AuNPs/CS nanocomposite.27 Moreover, the accessibility of a large surface area of the carbon nanomaterial on a carbon-based electrode (SWCNTs-modified SPE) helps to aid fast electron transference and contributes to increased specificity.28
CKMB concentrations from 50 fg mL−1 to 10 ng mL−1 and the ECL intensity of the CKMB signal was detected as revealed by the calibration graph in Fig. 6B. An exceptionally low experimentally calculated limit of detection (LOD) of 5 fg mL−1 was attained and it is the lowest concentration of CKMB that can be identified in solutions. This minimum LOD might be partially due to the improved ECL properties and conductivity rising from the CNOs/Fe3O4/AuNPs/CS nanocomposite.27 Moreover, the accessibility of a large surface area of the carbon nanomaterial on a carbon-based electrode (SWCNTs-modified SPE) helps to aid fast electron transference and contributes to increased specificity.28
![[thin space (1/6-em)]](https://www.rsc.org/images/entities/char_2009.gif) 000×. Next, 100 pg mL−1 CKMB was introduced to each dilution. The highest reduction in the signal was observed at dilutions higher than 1000× (ESI Fig. S9†). Later, three different concentrations of CKMB (200, 300 and 500 pg mL−1) were examined for the immunosensor's practical application in identifying CKMB at a dilution factor of 1000×. The RSD (relative standard deviation) value for each CKMB concentration used here is between 0.52% to 0.81% and the recovery range is between 98–103%. These results, summarized in Table 2, validate that the fabricated immunosensor has a substantial prospective for the detection of CKMB in real serum samples.
000×. Next, 100 pg mL−1 CKMB was introduced to each dilution. The highest reduction in the signal was observed at dilutions higher than 1000× (ESI Fig. S9†). Later, three different concentrations of CKMB (200, 300 and 500 pg mL−1) were examined for the immunosensor's practical application in identifying CKMB at a dilution factor of 1000×. The RSD (relative standard deviation) value for each CKMB concentration used here is between 0.52% to 0.81% and the recovery range is between 98–103%. These results, summarized in Table 2, validate that the fabricated immunosensor has a substantial prospective for the detection of CKMB in real serum samples.


