 Open Access Article
Highly dispersed Pt catalyst supported on nanoporous carbon derived from waste PET bottles for reductive alkylation†
Yu
Wenlong
 ,
Chen
Zhe
,
Yu
Shitao
*,
Ding
Junwei
*,
Shan
Yuling
,
Liu
Fusheng
and
Li
Ming
,
Chen
Zhe
,
Yu
Shitao
*,
Ding
Junwei
*,
Shan
Yuling
,
Liu
Fusheng
and
Li
Ming

College of Chemical Engineering, Qingdao University of Science and Technology, 53 Zhengzhou Road, Qingdao 266042, Shandong, China. E-mail: yushitaoqust@126.com; djwnsfc@126.com
First published on 1st October 2019
Abstract
Nanoporous carbon (NPC) derived from waste polyethyleneterephthalate (PET) bottles was prepared by a MgO-templated method and employed as a support for a highly dispersed platinum catalyst. The NPCs and Pt/NPCs catalysts were characterized by BET, SEM, TEM, XRD and ICP-OES. The catalytic performance of the NPC supported Pt catalysts for reductive alkylation of p-aminodiphenylamine (p-ADPA) with methyl isoamyl ketone (MIAK) was investigated. The textural properties of the NPC prepared could be tailored by changing the size of the MgO-template and the MgO/waste PET powder mass ratio. When the pore size was below 14 nm, the catalytic performance of the Pt/NPCs for the reductive alkylation could be improved with increasing the pore size of the NPCs. Profiting from the higher mechanical strength and the ideal pore structure, Pt/O@NPC50(1/1)–PTA had excellent reusability, which could maintain 98% conversion of p-ADPA after reused 10 times.
1. Introduction
Reductive alkylation of amines with ketones is an effective path for the synthesis of higher alkylated amine derivatives. An important class of these alkylated amines is N,N′-disubstituted p-phenylenediamine (DPPD), which plays an significant role in rubber additives.1–8 The reductive alkylation for DPPDs is carried out by condensation reaction between p-phenylenediamine compounds and ketones to form imines,9 also known as Schiff bases, which are converted to N-alkylated products via catalytic hydrogenation.10–12 CuO–ZnO–Al2O3 composite catalysts were widely used in industrial production of DPPDs because of their low cost. However, the low catalytic activity and selectivity of the copper-based catalyst can't meet the quality requirements of the DPPD products. Therefore, supported precious metal catalysts were employed for the preparation of DPPDs with high quality and efficiency.13–15It is well known that the support of heterogeneous catalyst has a great influence on the adsorption and diffusion of reactants, as well as the accessibility of reactants with the active sites, especially for the reactants with relatively larger molecule size.16–22 However, most commonly used support for reductive alkylation catalysts was conventional activated carbon.14,15,23 Unfortunately, limited by raw material and activation method, the narrow pore structures of the conventional activated carbon are not conducive to the diffusion of the reactants with relatively larger molecule size.
In recent carbon science, nanoporous carbon preparation processes have been proposed, using template method to control pore structure, instead of any activation process.24 Nanoporous carbons have attracted more and more attention in the fields of adsorption,25,26 energy storage27 and catalysis20 owing to their adjustable pore structures. A hard-template method is generally used for the preparation of nanoporous carbons, with easily adjustability of their nanostructure by varying the template nano size and proportion. Typically, MgO-templated nanoporous carbon has achieved the commercial application on account of its advantages, such as the reusability of MgO and convenience for dissolving MgO using a diluted acidic solution under more mild conditions.28–32 Furthermore, the MgO-templated nanoporous with interconnected short-range pore structure can effectively reduce the molecular diffusion resistance.33–35
Polyethyleneterephthalate (PET) is one of the most common synthetic polymers widely used in industry and our daily life. However, its excessive use has also caused a grave environmental problem of countless PET wastes.36,37 For several years, incineration and landfill have been the common ways for the treatment of PET residues. However, above-mentioned processes may also cause new environmental problems such as uncontrollable release of heat and volatile compounds. Interestingly, the properties of the PET wastes, for instance, thermoplasticity and relatively high percentage of carbon, make PET an excellent candidate used as a promising precursor in the preparation of hard-templated nanoporous carbons.38–41
In this study, nanoporous carbons (NPCs) with various pore structures were prepared using MgO particles as nano-templates and PET powders derived from waste PET bottles as carbon precursor. Innovatively using PET-based NPCs as supports, highly dispersed Pt/NPC catalysts with very small platinum particles were prepared. The structure–property relationships of NPCs supported Pt catalysts were investigated, and the catalytic performance of Pt/NPCs for the reductive alkylation of p-ADPA with MIAK to N-(1,4-dimethylamyl)-N′-phenyl-p-phenylenediamine (antioxidant 7PPD) were evaluated.
2. Experimental
2.1. Preparation of the NPCs
Waste PET bottles collected from refuse dump were thoroughly washed with water and cut into small pieces. Then the PET pieces were crushed into 100 to 200 mesh powder in a pulverizer. Three nano-MgO samples with 15 nm, 50 nm and 100 nm particle sizes were purchased from Veking New Materials Co., Ltd. (Hangzhou, China). The MgO/PET ratio was defined as the mass ratio of MgO to the waste PET powders.An extremely convenient procedure for preparation of the NPC with a MgO/PET ratio of 1/1 is described as follows. Waste PET powder (10 g) and nano-MgO (10 g) were mixed mechanically in an agate mortar (powder mixing). The mixtures were pyrolyzed in an electric tubular atmosphere furnace at 850 °C for 2 h, in a flow of high purity N2. Heating rate to 850 °C was 3 °C min−1 and flowing rate of N2 was 20 mL min−1. MgO was dissolved out using 10 wt% H2SO4 aqueous solution (40 mL H2SO4 aqueous solution/g MgO) from carbon–MgO mixtures at 50 °C for 5 h. The mixtures were repeatedly dissolved 3 times until the filtrate did not contain Mg2+. Subsequently, the residual solid was washed thoroughly with deionized water until the filtrate was neutral. The NPCs, dried at 120 °C for 12 h, were denoted as NPC15, NPC50 and NPC100, where 15, 50 and 100 refer to the nano-size of the MgO used, 1/3, 1/1, and 3/1 refer to the MgO/PET mass ratio. As a comparison, polyvinyl alcohol (PVA) was also used as carbon precursor. The NPC with a MgO/PVA mass ratio of 1/1 was prepared via the same powder mixing-carbonization method. The PVA-based nanoporous carbon obtained was named as PVA-NPC as a distinction. More than 4 g of each nanoporous carbon was prepared for the subsequent preparation of the supported Pt catalyst.
2.2. Catalyst preparation
Prior to catalyst preparation, the points of zero charge (PZC) of pristine carbon samples were measured approximately equal to 9 following the method described in the ref. 42. Subsequently, the NPC samples were oxidized via immersion in HNO3 (5 N) during 24 h at room temperature in order to obtain a low PZC carbon support for Pt/NPC preparation with platinum cations. The samples were then washed and heated in high purity N2 at 200 °C for 2 h to remove the most unstable components. These samples were labeled “O&NPC”s, and their PZCs were measured approximately equal to 3 following the same method as that used for the pristine carbons.Pt/NPCs with a calculated Pt content of 3.0 wt% were prepared via the dry impregnation technique combined with the strong electrostatic adsorption. H2PtCl6 and [Pt(NH3)4]Cl2 purchased from Sino-Platinum Metals Corp. Ltd. (Kunming, China) were used as anionic (CPA) and cationic (PTA) platinum precursors, respectively. In a typical synthesis, a volume of Pt precursor aqueous solution measured beforehand with desired mass of CPA or PTA was added using a microinjector on the NPCs until it was just wet.
To achieve 3 wt% of Pt with the NPC–CPA pair, 0.158 g of H2PtCl6·6H2O were dissolved in 2.2 mL deionized water, and the initial pH was adjusted to 2 with dilute HNO3; this H2PtCl6 solution was slowly dropped on 2 g of non-oxidized NPC using a 50 μL microinjector. In the case of the O&NPC–PTA pair, and for a similar 3 wt% Pt/O&NPC, the Pt precursor solution was prepared by dissolving 0.103 g [Pt(NH3)4]Cl2 in 2.2 mL deionized water; the pH was adjusted to 12 with ammonia. Subsequently, 2 g of O&NPC was mixed with the PTA chloride solution by adding the latter 50 μL at a time to the O&NPC until it was just wet. For the sake of comparison, 3 wt% Pt/NPC with the non-oxidized NPC–PTA pair was prepared following the same method as that used for the O&NPC–PTA pair described above. All the samples were then dried in a flow of high purity N2 at room temperature for 24 h, and reduced at 200 °C in high purity H2 flow for 2 h. The flowing rate of N2 and H2 were 20 mL min−1 and 50 mL min−1, respectively. The reagents used in the preparation process, such as H2SO4, HNO3 and PVA were purchased from Aladdin Biochemical Technology Co., Ltd. (Shanghai, China) and the gases were provided by Deyi Gas Co., Ltd. (Yantai, China).
The catalysts obtained were labeled using the carbon support name and the Pt precursor name. For instance, Pt/O@NPC50(1/1)–PTA was prepared with the oxidized NPC–PTA pair, while NPC50(1/1) represents the carbon support prepared with 1/1 mass ratio of 50 nm MgO to the waste PET powder.
2.3. Characterization
The micro- and nanostructures of the NPCs were imaged using a cold field emission scanning electron microscope (JSM-7500F, JEOL Ltd.) with an accelerating voltage of 5.0 kV. The specific surface area, pore volume and pore size distribution of the NPCs and Pt/NPC catalysts were determined using a nitrogen adsorption–desorption analyzer (ASAP 2020, Micromeritics Instrument Corp.). The specific surface area and the pore distribution were analyzed using the Brunauer–Emmet–Teller (BET) and Barrett–Joyner–Halenda (BJH) equations, respectively. Dispersion of Pt nanoparticles supported on varied NPCs were analyzed using a transmission electron microscopy (JEM-2100F, JEOL Ltd.). The accelerating voltage of the TEM was 200 kV. X-ray diffraction patterns of the NPCs derived from different carbon precursors were obtained using a D/max 2500 diffractometer (Rigaku Corp.) with CuKα radiation carrying out at 40 kV and 150 mA. The metal contents of different catalysts were analyzed using an ICP-AES analyzer (Agilent 725, Agilent Technologies, Inc.). The particle sizes of the catalysts were determined using a Mastersizer 3000 laser particle size analyzer (Malvern Panalytical Corp.). The N content of the used catalysts was quantified using an elemental analyzer (Vario EL Cube, Elementar).2.4. Reductive alkylation reaction
The catalytic reaction was performed in a 500 mL stainless steel autoclave reactor provided by Huixin Chemical Machinery Corp. Ltd. (Weihai, China), in which 50 g of p-ADPA, 120 g of MIAK and 0.5 g of catalyst were added. The autoclave reactor was then pressurized with H2 to 3.0 MPa and heated up to 383 K with high stirring speed (750 rpm). The catalyst used was separated from the hydrogenation suspension by filtering after reaction. The final products were analyzed using an 7890B gas chromatography (Agilent Technologies, Inc.) equipped with an HP-5 capillary column (30 m × 0.32 mm × 0.25 μm) and an FID detector.The conversion and conversion rate of p-ADPA, the selectivity of the product (7PPD) can be calculated using the following equations respectively:
where X is the p-ADPA conversion, W is the p-ADPA conversion rate, S is the 7PPD selectivity, t is the reaction time, C0 and C denote the initial and final mole fraction, respectively.
3. Results and discussion
3.1. Physical properties of NPCs and catalysts
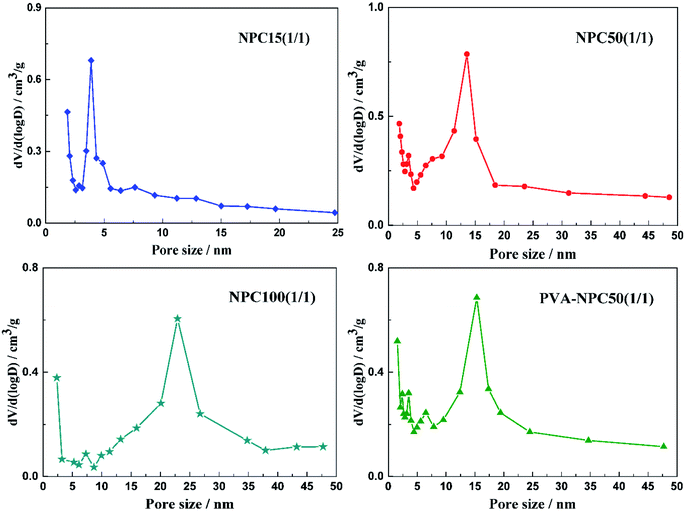
To investigate the porous structure of nanoporous carbon materials, all the samples were analyzed by nitrogen adsorption–desorption method. The pore characteristics of NPCs were listed in Table 1 and the nitrogen adsorption isotherms of the samples were described in Fig. S1.† At the same MgO/PET ratio, the pore volume and BET specific surface area of the NPCs decreased with increased particle sizes of the MgO used as templates. However, using the same nano-MgO (50 nm), the properties mentioned above of the NPC50s increased with an increased MgO/PET mass ratio. Fig. 1 shows the pore size distributions of the NPC samples calculated by the BJH method. The peak pore size in the pore distribution for the NPC15 was about 4 nm. With the nano size of the MgO used increased, the pore size of NPC50 and NPC100 became larger than that of NPC15, presenting a shoulder peak centered at mesopore size, which was 14 nm for the former and 23 nm for the latter. Interestingly, for all the NPCs prepared at different MgO/PET mass ratios with 50 nm nano-MgO as templates, the peak pore sizes in the pore distributions were approximately 14 nm, which indicates that the pore size of the NPC is significantly affected by the size of the template. These results have similar regularity to our previous work, which can also demonstrate that the pore structure of the NPCs can be modified via changing the nano size of MgO templates and the MgO/PET ratio. Furthermore, for the sake of comparison, the PVA-NPC50(1/1) prepared with 1/1 mass ratio of 50 nm MgO to the PVA powders as carbon precursors shows the specific surface area of 413 m2 g−1 with pore volume of 0.97 cm3 g−1. The surface structure difference between NPC50(1/1) and PVA-NPC50(1/1) may result from the pyrolysis characteristics of the two carbon precursors.| Samples | MgO size/nm | MgO/PET (PVA) mass ratio | S BET/m2 g−1 | S Micro a/m2 g−1 | V Total/cm3 g−1 | V Micro a/cm3 g−1 | D de b/nm |
|---|---|---|---|---|---|---|---|
| a Calculated by t-plot method. b The peak pore size in the pore distribution calculated by BJH desorption method. | |||||||
| NPC15(1/1) | 15 | 1/1 | 733 | 104 | 0.61 | 0.03 | 3.8 |
| NPC50(1/3) | 50 | 1/3 | 407 | 93 | 0.99 | 0.09 | 14.0 |
| NPC50(1/1) | 50 | 1/1 | 452 | 97 | 1.02 | 0.14 | 13.6 |
| NPC50(3/1) | 50 | 3/1 | 481 | 112 | 1.07 | 0.17 | 13.8 |
| NPC100(1/1) | 100 | 1/1 | 205 | 76 | 0.79 | 0.10 | 22.8 |
| PVA-NPC50(1/1) | 50 | 1/1 | 413 | 101 | 0.97 | 0.11 | 15.4 |
The surface morphology and microstructure of various NPC samples was investigated by means of SEM. As shown in Fig. 2a–e, the NPCs prepared exhibit 3D foam-like structure with quite a number of macropores and mesopores when the waste PET was used as carbon precursor. At the same MgO/PET mass ratio, larger pores could form on the NPCs prepared when bigger sized nano-MgO templates (Fig. 2a–c) were used. The high magnification SEM images (Fig. 2d and e) clearly show that the carbon wall presents sheet nanostructure, and huge amounts of micropore and mesoporous scale fissures in the carbon layers. The 3D foam-like structure with nanoporous fissures and flake-like carbon walls looking thick and strong, had interconnected channels, which is favorable for the highly efficient diffusion of the reactant molecules. By contrast, the PVA-NPC50(1/1) prepared using PVA powders as carbon precursors also shows hierarchically porous nanostructure with thinner carbon walls compared with the PET-based NPCs from Fig. 2f.
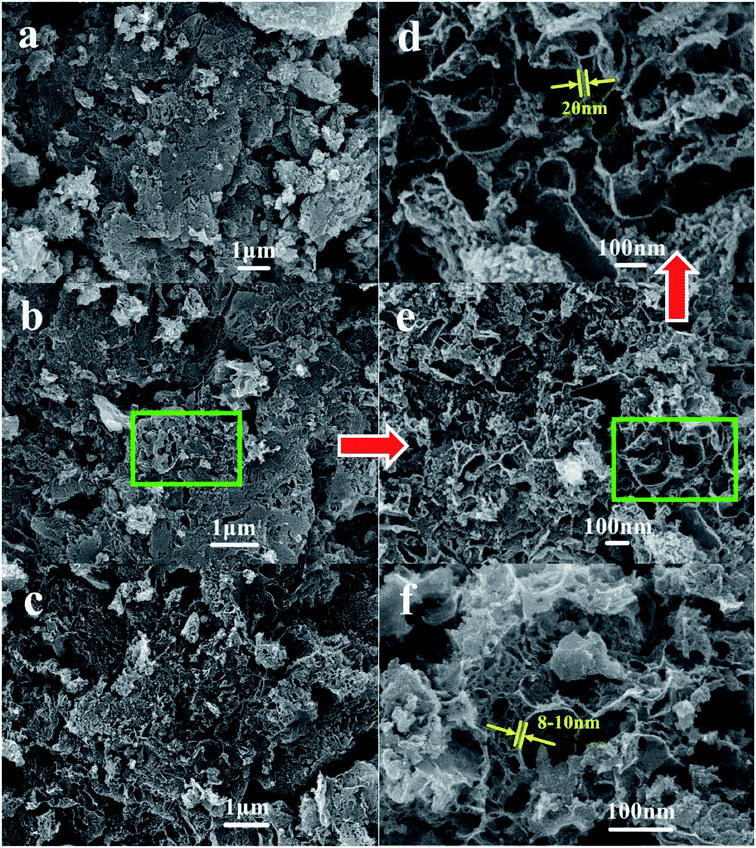 | ||
| Fig. 2 SEM images of NPC samples ((a) NPC15(1/1); (b) NPC50(1/1); (c) NPC100(1/1); (d and e) the interior of the NPC50(1/1) with high magnification; (f) PVA-NPC50(1/1)). | ||
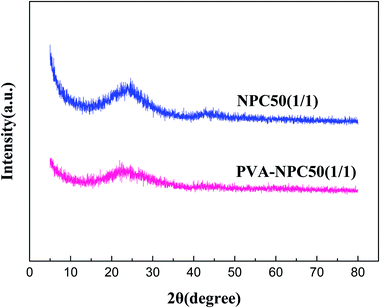
The XRD characterization results of NPC50(1/1) and PVA-NPC50(1/1) are presented in Fig. 3. It was observed that both the PET-based and PVA-based NPCs had no sharp characteristic diffraction peaks (broad peaks at 2θ = 25° attributed to the amorphous carbon), which indicates that the NPCs derived from the two different carbon precursors at 850 °C both had negligible graphitization.
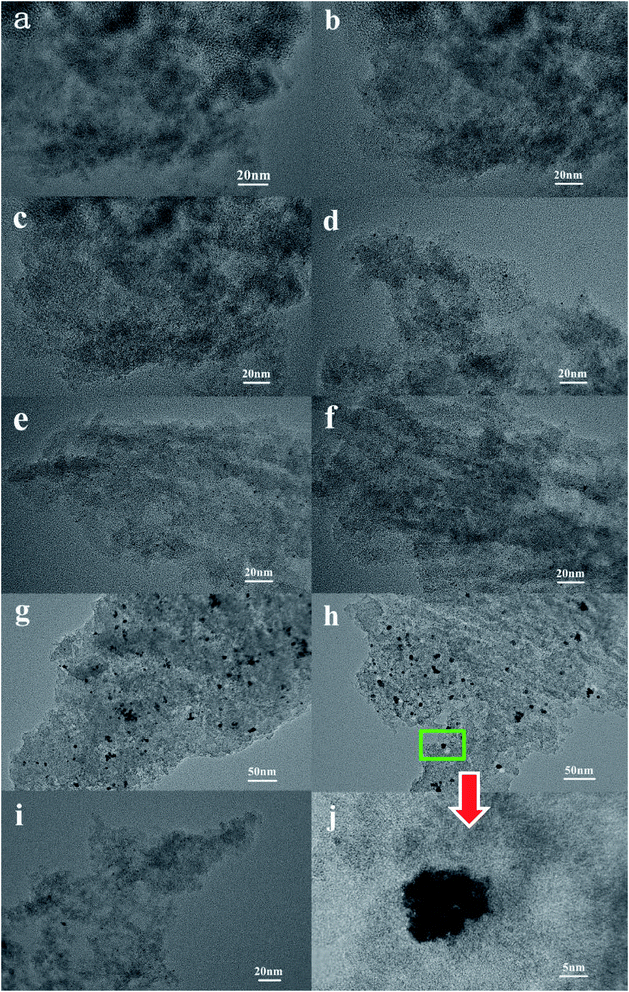
The TEM images of the Pt catalysts supported on various NPCs (given in Fig. 4) show that, in all Pt/NPC catalysts synthesized by the SEA method, whether using the NPC–CPA pair or the O&NPC–PTA pair, the platinum nanoparticles (1 to 2 nm) are highly dispersed and present an extremely low degree of agglomeration (Fig. 4a–f and i). These results indicate that the dispersion state of platinum nanoparticles is significantly affected by the matching relationship between the surface chemical properties of carbon supports and the platinum precursors, instead of the structural properties of the carbon materials. The strong interaction between the carbon support and platinum precursor could effectively improve the dispersion of Pt nanoparticles. By contrast, the carbon supported platinum catalysts synthesized with the NPC–PTA pair (Fig. 4g, h and j) present large platinum particles from 5 to 20 nm with obvious nanoparticles aggregation.
3.2. Catalytic performances
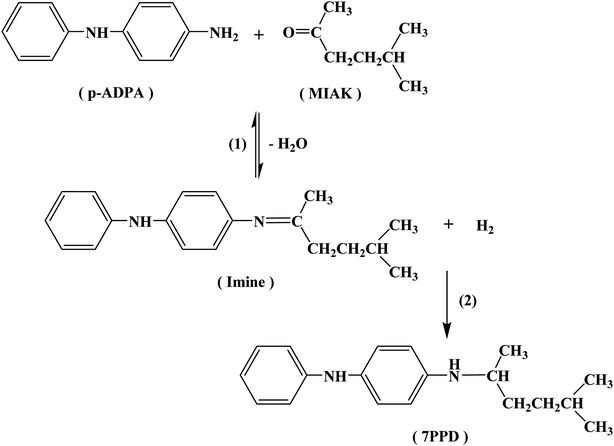
The reaction pathways for the synthesis of antioxidant 7PPD is shown in Scheme 1. The catalytic performances of various catalysts were presented in Table 2 and reaction time vs. conversion of p-ADPA over the Pt/NPCs was shown in Fig. S2.† It is indicated that with the increase of the catalyst pore size, the conversion of p-ADPA was obviously improved. The selectivity of 7PPD over various catalysts had the similar changing trend. All the results above-mentioned show that the catalysts with larger pore structure show better catalytic performance. However, there was just a small difference in catalytic performance between NPC50 (PVA-NPC50) and NPC100 supported platinum catalysts, which indicated that the effect of the pore size of the support on the catalytic performance decreases when the pore size is larger than that of 13 nm. Interestingly, with the same physical structure of the supports, the catalyst prepared with the O&NPC–PTA pair had faster reaction rate but lower selectivity to 7PPD. The main reason for this result may be that the oxidized NPCs had more acidic sites, which catalyzed the formation of the imine. The oxygen-containing functional groups probably acting as acidic sites on various NPCs supported Pt catalysts is shown in Table S1.† According to the literatures, the main by-products were possibly derived from the hydrogenolysis of the intermediate product.| Catalyst | p-ADPA conversion/% | Selectivity/% | ||
|---|---|---|---|---|
| 7PPD | Imine | Others | ||
| a Reaction conditions: p-ADPA = 50 g, MIAK = 120 g, catalyst = 0.5 g, T = 80 °C, P = 2.5 MPa (pure H2), reaction time = 3 h, stirring speed = 750 rpm. | ||||
| Pt/NPC15(1/1)–CPA | 85.2 | 89.3 | 10.2 | 0.5 |
| Pt/O@NPC15(1/1)–PTA | 87.8 | 90.9 | 8.5 | 0.6 |
| Pt/NPC50(1/1)–CPA | 96.5 | 96.5 | 3.3 | 0.2 |
| Pt/O@NPC50(1/1)–PTA | 96.8 | 97.3 | 2.4 | 0.3 |
| Pt/NPC100(1/1)–CPA | 99.0 | 98.4 | 1.6 | — |
| Pt/O@NPC100(1/1)–PTA | 99.2 | 99.0 | 0.9 | 0.1 |
| Pt/O@PVA-NPC50(1/1)–PTA | 97.2 | 96.8 | 3.0 | 0.2 |
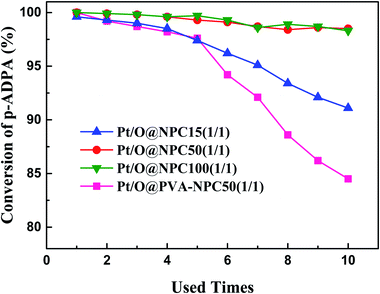
The reusability of the catalyst for reductive alkylation reactions of p-ADPA with MIAK was tested using the same conditions as before. Fig. 5 shows that the p-ADPA conversion remained above 98% after the Pt/O@NPC50(1/1)–PTA and Pt/O@NPC100(1/1)–PTA reused 10 times, respectively. However, the p-ADPA conversion was reduced to 91% over Pt/O@NPC15(1/1)–PTA reused 10 times, which indicates that the narrow pore structure of the NPC surely inhibits the performance of the Pt/NPC. It is noteworthy that, compared with the Pt/O@NPC50(1/1)–PTA, an obvious decrease of the p-ADPA conversion was obtained with the increase of the Pt/O@PVA-NPC50(1/1)–PTA reused times.
3.3. Deactivation of the Pt/NPCs
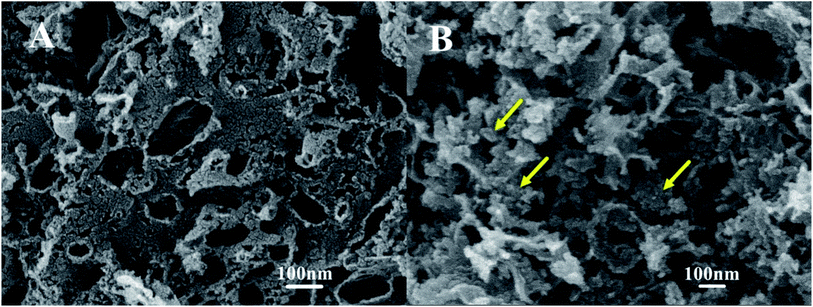
Fig. 6 shows the TEM characterization results of the Pt/O@NPC50(1/1)–PTA and Pt/O@PVA-NPC50(1/1)–PTA reused 10 times, respectively. It is obvious that both the two used catalysts still had the highly dispersed Pt nanoparticles, just like fresh catalysts. In order to explore the surface morphology of the used catalysts, SEM characterization was carried out, as shown in Fig. 7. The used Pt/O@NPC50(1/1)–PTA still exhibited the 3D foam-like pore structure with thick carbon walls connected with each other, which was no significant difference from the fresh NPC50(1/1). However, the carbon structure of the Pt/O@PVA-NPC50(1/1)–PTA reused 10 times seemed to have broken somewhat, with some small carbon pieces.As show in Table 3, the BET specific surface area and pore volume of the Pt/O@NPC50(1/1)–PTA decreased slightly after 10 times of reuse. In our previous work,43 one of the main reasons for the deactivation of traditional activated carbon supported Pt catalyst in reductive alkylation is the blockage of pores and covering of active centers by organic matter. These organics adsorbing on the catalyst mainly contain the product and its derivatives generating by side reactions. The deactivated catalyst usually shows a significant decrease both in the microporous specific surface area and mesoporous specific surface area. However, the Pt/O@PVA-NPC50(1/1)–PTA reused 10 times showed some abnormal information, such as a significant decrease of the BET specific surface area with a slight increase of the micropore specific surface area. In order to explain this anomaly, the verification experiments were carried out with the same conditions as the catalyst stability experiments, except for the absence of the p-ADPA. It is evident from Table 3 that the used Pt/O@PVA-NPC50(1/1)–PTA-V after the verification experiment had the same changes as the stability experiment, which could indicate that the blockage of the pores by various reaction species should not be the real reason for the significant decrease of the mesoporous specific surface area. Considering the SEM characterization of the used catalysts, it can be concluded that the breakage and collapse of the carbon walls in the PVA-based NPC led to a sharp decrease of the mesopores.
| Catalyst samples | S BET/m2 g−1 | S Micro a/m2 g−1 | V Total/cm3 g−1 |
|---|---|---|---|
| a Verification experiments conditions: MIAK = 120 g, catalyst = 0.5 g, T = 100 °C, P = 3.0 MPa (pure H2), stirring speed = 750 rpm. | |||
| Fresh Pt/O@NPC50(1/1)–PTA | 421 | 86 | 0.98 |
| Fresh Pt/O@PVA-NPC50(1/1)–PTA | 394 | 95 | 0.94 |
| Used Pt/O@NPC50(1/1)–PTA | 398 | 77 | 0.93 |
| Used Pt/O@PVA-NPC50(1/1)–PTA | 258 | 102 | 0.63 |
| Pt/O@NPC50(1/1)–PTA-Va | 409 | 84 | 0.97 |
| Pt/O@PVA-NPC50(1/1)–PTA-Va | 270 | 105 | 0.68 |
As listed in Table 4, the N content of both used catalysts (used Pt/O@NPC50(1/1)–PTA and used Pt/O@PVA-NPC50(1/1)–PTA) was about 0.5%, which probably caused by a small amount of 7PPD deposition. Just slight Pt loss was observed in the used Pt/O@NPC50(1/1)–PTA, which won't observably inhibit the catalytic performance. However, the Pt content of the Pt/O@PVA-NPC50(1/1)–PTA reused in stability and verification experiments decreased obviously, which might be brought about by the filtration loss caused by the crush of the PVA-based NPCs. Corresponding, the average particle sizes of used catalysts had a similar trend, which also verified the SEM characterization results.
| Catalyst samples | Pt content/% | N content/% | Average particle size/μm |
|---|---|---|---|
| a Verification experiments conditions: MIAK = 120 g, catalyst = 0.5 g, T = 100 °C, P = 3.0 MPa (pure H2), stirring speed = 750 rpm. | |||
| Fresh Pt/O@NPC50(1/1)–PTA | 2.91 | — | 40 |
| Fresh Pt/O@PVA-NPC50(1/1)–PTA | 2.93 | — | 44 |
| Used Pt/O@NPC50(1/1)–PTA | 2.82 | 0.51 | 37 |
| Used Pt/O@PVA-NPC50(1/1)–PTA | 2.22 | 0.48 | 28 |
| Pt/O@NPC50(1/1)–PTA-Va | 2.86 | — | 38 |
| Pt/O@PVA-NPC50(1/1)–PTA-Va | 2.13 | — | 30 |
4. Conclusions
The preparation of the NPCs derived from waste PET bottles by an extremely convenient MgO-templated method and the highly dispersed Pt-based catalysts supported on the NPCs via strong electrostatic adsorption were investigated. The textural properties of the NPCs can be modified by changing the nano size of MgO templates and the MgO/waste PET powders mass ratio. The catalytic performance of various Pt/NPCs catalysts for the reductive alkylation of p-ADPA with MIAK indicated that, when the pore size is below 14 nm, the catalytic activity and reusability of the catalysts for antioxidant 7PPD synthesis could be improved with increasing pore sizes of the NPCs. The Pt/O@NPC50(1/1)–PTA had excellent reusability, which could maintain 98% conversion of p-ADPA after reused 10 times. By contrast, the PVA-based NPC supported Pt catalyst showed awful stability because of the fragile pore structure.Conflicts of interest
There are no conflicts to declare.Acknowledgements
This work was financially supported by the Natural Science Foundation of Shandong Province (ZR2017ZC0630 and ZR2017BB014), the Primary Research & Developement Plan of Shandong Province (2019GSF109055 and 2019GSF109024), and the Taishan Scholars Construction Projects of Shandong (ts201511033). The authors are grateful for the financial support.References
- F. Cataldo, Eur. Polym. J., 2002, 38, 885–893 CrossRef CAS.
- F. Cataldo, Polym. Degrad. Stab., 2018, 147, 132–141 CrossRef CAS.
- Z. Cibulková, P. Šimon, P. Lehocký and J. Balko, Polym. Degrad. Stab., 2005, 87, 479–486 CrossRef.
- A. Černá, Z. Cibulková, P. Šimon, J. Uhlár and P. Lehocký, Polym. Degrad. Stab., 2012, 97, 1724–1729 CrossRef.
- P. Rapta, A. Vargová, J. Polovková, A. Gatial, L. Omelka, P. Majzlík and M. Breza, Polym. Degrad. Stab., 2009, 94, 1457–1466 CrossRef CAS.
- I. Puškárová and M. Breza, Polym. Degrad. Stab., 2016, 128, 15–21 CrossRef.
- I. Puškárová, Z. Cibulková and M. Breza, Polym. Degrad. Stab., 2017, 144, 1–6 CrossRef.
- I. Puškárová and M. Breza, Chem. Phys. Lett., 2017, 680, 78–82 CrossRef.
- R. Margalef-Català, C. Claver, P. Salagre and E. Fernández, Tetrahedron Lett., 2000, 41, 6583–6588 CrossRef.
- L. Lu, X. Kong, Y. Duan, J. Tian, G. Song and Y. Li, Res. Chem. Intermed., 2015, 41, 549–557 CrossRef CAS.
- Z. D. Pan, Y. J. Ding, L. Yan, X. M. Li, G. P. Jiao and H. Y. Luo, Catal. Lett., 2008, 122, 115–120 CrossRef CAS.
- Z. Pan, Y. Ding, D. Jiang, X. Li, G. Jiao and H. Luo, Appl. Catal., A, 2007, 330, 43–48 CrossRef CAS.
- N. G. Patil, D. Roy, A. S. Chaudhari and R. V. Chaudhari, Ind. Eng. Chem. Res., 2007, 46, 3243–3254 CrossRef CAS.
- Q. Zhang, F. Feng, C. Su, W. Xu, L. Ma, C. Lu and X. Li, RSC Adv., 2015, 5, 66278–66285 RSC.
- W. Xu, J. Ni, Q. Zhang, F. Feng, Y. Xiang and X. Li, J. Mater. Chem. A, 2013, 1, 12811–12817 RSC.
- K. Chandra Mouli, K. Soni, A. Dalai and J. Adjaye, Appl. Catal., A, 2011, 404, 21–29 CrossRef CAS.
- G. Zhao, T. S. Zhao, J. Xu, Z. Lin and X. Yan, Int. J. Hydrogen Energy, 2017, 42, 3325–3334 CrossRef CAS.
- K. Cheng, M. Virginie, V. V. Ordomsky, C. Cordier, P. A. Chernavskii, M. I. Ivantsov, S. Paul, Y. Wang and A. Y. Khodakov, J. Catal., 2015, 328, 139–150 CrossRef CAS.
- D. Song and J. Li, J. Mol. Catal. A: Chem., 2006, 247, 206–212 CrossRef CAS.
- Y. Zhou, G. Lan, B. Zhou, W. Jiang, W. Han, H. Liu and Y. Li, Chin. J. Catal., 2013, 34, 1395–1401 CrossRef CAS.
- Y. Zhao, Z. Guo, H. Zhang, B. Peng, Y. Xu, Y. Wang, J. Zhang, Y. Xu, S. Wang and X. Ma, J. Catal., 2018, 357, 223–237 CrossRef.
- P. G. Blakeman, E. M. Burkholder, H.-Y. Chen, J. E. Collier, J. M. Fedeyko, H. Jobson and R. R. Rajaram, Catal. Today, 2014, 231, 56–63 CrossRef CAS.
- Q. F. Zhang, J. C. Wu, C. Su, F. Feng, Q. L. Ding, Z. L. Yuan, H. Wang, L. Ma, C. S. Lu and X. N. Li, Chin. Chem. Lett., 2012, 23, 1111–1114 CrossRef CAS.
- M. Inagaki, M. Toyoda, Y. Soneda, S. Tsujimura and T. Morishita, Carbon, 2016, 107, 448–473 CrossRef CAS.
- B. Chao, M. I. Konggidinata, L. Lin, M. Zappi and D. D. Gang, Journal of Water Process Engineering, 2017, 17, 256–263 CrossRef.
- R. Guo, J. Guo, F. Yu and D. D. Gang, Microporous Mesoporous Mater., 2013, 175, 141–146 CrossRef CAS.
- B. Wang, Y. Wang, Y. Peng, X. Wang, N. Wang, J. Wang and J. Zhao, Chem. Eng. J., 2018, 348, 850–859 CrossRef CAS.
- T. Morishita, T. Tsumura, M. Toyoda, J. Przepiórski, A. W. Morawski, H. Konno and M. Inagaki, Carbon, 2010, 48, 2690–2707 CrossRef CAS.
- T. Morishita, L. Wang, T. Tsumura, M. Toyoda, H. Konno and M. Inagaki, Carbon, 2010, 48, 3001 CrossRef.
- H. Orikasa and T. Morishita, Carbon, 2013, 52, 621 CrossRef CAS.
- B. Acevedo and C. Barriocanal, Microporous Mesoporous Mater., 2015, 209, 30–37 CrossRef CAS.
- W. Geng, F. Ma, G. Wu, S. Song, J. Wan and M. Di, Electrochim. Acta, 2016, 191, 854–863 CrossRef CAS.
- Z. Adem, F. Guenneau, M.-A. Springuel-Huet, A. Gédéon, J. Iapichella, T. Cacciaguerra and A. Galarneau, J. Phys. Chem. C, 2012, 116, 13749–13759 CrossRef CAS.
- S. Chen, H. Fu, L. Zhang and Y. Wan, Appl. Catal., B, 2019, 248, 22–30 CrossRef CAS.
- J. Kärger and R. Valiullin, Chem. Soc. Rev., 2013, 42, 4172–4197 RSC.
- P. Rai and K. P. Singh, J. Environ. Manage., 2018, 207, 249–261 CrossRef CAS PubMed.
- N. A. El Essawy, S. M. Ali, H. A. Farag, A. H. Konsowa, M. Elnouby and H. A. Hamad, Ecotoxicol. Environ. Saf., 2017, 145, 57–68 CrossRef CAS.
- J. M. Dias, M. C. M. Alvim-Ferraz, M. F. Almeida, J. Rivera-Utrilla and M. Sánchez-Polo, J. Environ. Manage., 2007, 85, 833–846 CrossRef CAS.
- W. Bratek, A. Świątkowski, M. Pakuła, S. Biniak, M. Bystrzejewski and R. Szmigielski, J. Anal. Appl. Pyrolysis, 2013, 100, 192–198 CrossRef CAS.
- E. Lorenc-Grabowska, M. A. Diez and G. Gryglewicz, J. Colloid Interface Sci., 2016, 469, 205–212 CrossRef CAS.
- R. Mendoza-Carrasco, E. M. Cuerda-Correa, M. F. Alexandre-Franco, C. Fernández-González and V. Gómez-Serrano, J. Environ. Manage., 2016, 181, 522–535 CrossRef CAS.
- C. Cao, G. Yang, L. Dubau, F. Maillard, S. D. Lambert, J.-P. Pirard and N. Job, Appl. Catal., B, 2014, 150–151, 101–106 CAS.
- W. Yu, J. Ding, S. Yu and F. Liu, RSC Adv., 2018, 8, 23262–23267 RSC.
Footnote |
| † Electronic supplementary information (ESI) available. See DOI: 10.1039/c9ra04976b |
| This journal is © The Royal Society of Chemistry 2019 |


