 Open Access Article
Design of GO–Ag-functionalized Fe3O4@CS composite for magnetic adsorption of rhodamine B
Lili Xua,
Hongbo Suoa,
Renmin Liua,
Houmei Liu*b and
Hongdeng Qiu *c
*c
aSchool of Pharmacy, Liaocheng University, Liaocheng, Shandong 252059, China
bSchool of Pharmaceutical Sciences, Shandong University, Jinan, Shandong 250012, China. E-mail: hmliu@sdu.edu.cn; Fax: +86-931-8277088; Tel: +86-931-4968877
cKey Laboratory of Chemistry of Northwestern Plant Resources, Key Laboratory for Natural Medicine of Gansu Province, Lanzhou Institute of Chemical Physics, Chinese Academy of Sciences, Lanzhou 730000, China. E-mail: hdqiu@licp.cas.cn
First published on 23rd September 2019
Abstract
In this study, a novel magnetic composite (Fe3O4@CS/GO/Ag) modified with chitosan (CS), graphene oxide (GO) and Ag nanoparticles (Ag NPs) was successfully prepared as an efficient adsorbent for detection of rhodamine B (RB) combined with a fluorescence technique. The properties of the magnetic composite were confirmed by field emission scanning electron microscopy, energy dispersive X-ray spectroscopy, and vibrating sample magnetometry. The components of Fe3O4@CS/GO/Ag endowed it with excellent extraction performance and convenient operation. The main parameters affecting extraction and desorption efficiency were all investigated systematically. Under the optimized experimental conditions, the proposed method showed linear ranges (0.2–6.0 μg L−1) with R2 = 0.9992. The limits of detection (LODs) and quantification (LOQs) were 0.05 and 0.2 μg L−1 (n = 3), respectively. Fe3O4@CS/GO/Ag exhibited outstanding extraction efficiency for RB, compared with CS-coated Fe3O4 nanoparticles (Fe3O4@CS) and GO-modified Fe3O4@CS (Fe3O4@CS/GO). The applicability of the proposed method was investigated by analyzing four real samples (waste water, soft drink, shampoo, and red pencil) and the spiked recoveries ranged between 94% and 97% with RSD ranging from 3% to 6%, which showed that the proposed method had satisfactory practicability and operability.
1 Introduction
As a synthetic dye, rhodamine B (RB) was initially used as a color additive in textiles, foodstuffs and fluorescent labeling.1,2 Afterwards, it was widely applied as a colorant in the cosmetic, pharmaceutical, plastic, leather, dyeing, paper and printing industries, resulting in large amounts of wastewater every year.3,4 Meanwhile, RB is harmful if swallowed by human beings and animals which can cause irritation to the skin, eyes and respiratory tract.5,6 Furthermore, RB has been found to cause cancer in rats and mice through multiple tests.7 Because of its hazardous nature and harmful effects, the development of a simple method for the determination of RB in different samples is necessary. Various techniques have been developed for the determination of RB to date, including ultraviolet spectrophotometry,8–10 capillary chromatography,11,12 high performance liquid chromatography,13,14 fluorescence spectrophotometry.15,16 Due to the complexity of sample matrices and lower concentration of RB in lots of real samples, it is meaningful to develop an effective separation and enrichment technique to determine RB accurately.An appropriate sample pretreatment plays important role in a whole analysis procedure due to low concentration of analytes and complicated matrix in real samples. Solid-phase extraction (SPE) as a useful technique for rapid and selective sample preparation by adsorption on a solid adsorbent has been well developed. Due to its advantages of simple operation, low cost and high enrichment, more and more adsorbents have been developed and widely applied to solve many practical problems.17–19 Recently, magnetic solid-phase extraction (MSPE) has attracted increasing interest owing to its rapid separation process and excellent adsorption efficiency.20–22 It's a technique that uses a magnetic or magnetizable material as absorbent matrix. For MSPE procedures, fast phase separation can be achieved by using a magnet, which greatly simplifies the SPE procedure. The core part of MSPE technique lies at the adsorbent materials, which determine the selectivity and sensitivity of the method to some extent.
In recent years, graphene oxide (GO) and GO composite are popular in adsorption research because of its excellent properties,23,24 such as high specific surface area, abundant π electrons, exceptional mechanical and thermal properties. GO is a layered material bearing abundant of oxygenous groups on their basal planes and edges, which makes it easy to be assembled onto some substrate surfaces. Thus, the negatively charged GO tends to interact with positively charged species such as heavy metal ions and dyes.14,25,26 In addition, based on the presence of benzene rings in RB, there existed π–π interactions between GO and RB. So, for RB extraction, GO and GO composite have the potential to be excellent adsorbent materials.
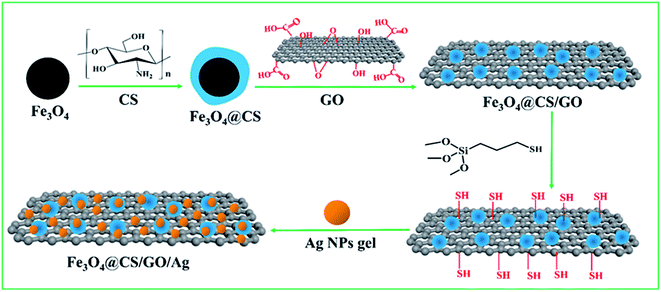
Magnetic GO composites are commonly formed through the adsorption interaction between magnetic Fe3O4 nanoparticles (Fe3O4 NPs) and GO, which is not stable.27 In order to increase the stability of Fe3O4@GO, we proposed chitosan (CS) as modification molecular coated on the surface of Fe3O4 NPs. CS, as a polymer, was characterized as low cost, non-toxicity, high adhesion, good adsorption properties, and easy chemical modification.28 The positive electricity and the presence of –NH2 in CS molecule induce Fe3O4@CS to be stable on the surface of GO substrate. Moreover, CS can further enhance the extraction efficiency of magnetic GO for RB extraction.
Coinage metals (Au, Ag), due to their “noble” characteristics with respect to their relativistic effect and relevance in chemistry, have attracted great attention in recent years.29,30 Relativistic effect brings s–d hybridization, which accelerates the mobilization of their electrons and facilitates the formation of chemical bond. Besides, Ag and Au nanoparticles (NPs) possess many special properties such as long-term stability, a high surface-to-volume ratio, an ease of chemical modification by organic molecules containing sulfhydryl (–SH), and so on. Taking advantage of these characteristics, Au and Ag NPs have been widely used in sample preconcentration and separation science.31–33 And we have successfully synthesized a novel magnetic graphene oxide modified with Au nanoparticles. The magnetic composite was successfully developed as MSPE adsorbents for the determination of trace RB coupled with fluorescence technique achieving satisfactory results.33 The presence of electron transference between RB (π-donor system) and the valency shell of Au can strengthen the affinity, thus the extraction capacity of RB can be improved.30,33 In view of the similar properties of Ag with Au and that Ag has lower costs, Ag NPs modified magnetic graphene oxide was prepared in this paper.
Based on the above considerations, in this study, we prepared a novel magnetic composite (Fe3O4@CS/GO/Ag) modified with chitosan (CS), graphene oxide (GO) and Ag nanoparticles (Ag NPs). By combining the MSPE technique with fluorescence detection, the prepared Fe3O4@CS/GO/Ag was applied for the determination of RB in aqueous solution. Under the optimal conditions, the proposed method was successfully applied for the determination of RB in waste water, soft drink, shampoo and red pencil samples.
2 Experimental
2.1 Chemicals and instruments
Fe3O4 NPs (30 nm), trimethoxysilylpropanethiol and CS were obtained from Aladdin Chemical Reagent Co. Ltd. (Shanghai, China). GO (thickness: 0.55–1.2 nm, width: 0.5–3 μm) was purchased from Nanoon Nanomaterials Science and Technology Co., Ltd. (Beijing, China). Silver nitrate (AgNO3), trisodium citrate, RB and sodium chloride (NaCl) were all purchased from Sinopharm Chemical Reagent Co. Ltd. (Shanghai, China). Hydrochloric acid (HCl), sodium hydroxide (NaOH), ethanol, methanol, acetonitrile, acetone, n-hexane and chloroform were all purchased from Beijing Chemical Factory (Beijing, China).An F-4600 fluorescence spectrophotometer (Hitachi, Japan) equipped with 1 × 1 cm quartz cell and a xenon lamp was used for fluorescence analysis. Spectra measurement were carried out on fluorescence scan mode with the slit widths of 10 nm and the excitation and emission wavelengths of 540 and 575 nm, respectively. The PMT detector was set on 700 V for recording the emission lines. The as-prepared adsorbent was dried in the vacuum oven purchased from Shanghai Yiheng Science Instrument Co. Ltd. (Shanghai, China). An S-4800 field emission scanning electron microscope (Hitachi, Japan) equipped with an energy dispersive X-ray spectroscopy (EDS) was used for investigating the surface characteristics and frameworks of the prepared adsorbents. A vibrating sample magnetometer (VSM, VersaLab, Quantum Design, USA) was used for testing the magnetic properties of the prepared adsorbents at room temperature with a magnetic field from 30 to −30 KOe. A thermostatic oscillator (SHA-B) purchased from Changzhou Zhiborui instrument manufacturing co. Ltd. (Changzhou, China) was used for accelerating the adsorption and desorption process.
2.2 Preparation of Fe3O4@CS/GO/Ag
2.3 Samples collection and preparation
Soft drink and waste water. They were filtered through 0.45 μm cellulose membrane filter (Millipore) and adjusted to 6.0 using HCl/NaOH.
Shampoo. An amount of 1.0 g shampoo was accurately weighed and then dissolved in ultrapure water and diluted to 50 mL in a volumetric flask. Then 0.5 mL of the solution was further diluted to 50 mL with ultrapure water in a volumetric flask and adjusted to 6.0 using HCl/NaOH.
Pencil. An amount of 20 mg red pencil lead was accurately weighed. Then it was dissolved in ultrapure water and filtered subsequently. The filtrate was diluted to 50 mL in a volumetric flask. Then 0.05 mL of the solution was diluted to 50 mL with ultrapure water and adjusted to 6.0 using HCl/NaOH.
All these prepared sample solutions were stored at 4 °C in darkness for further extraction and analysis of RB.
2.4 MSPE procedure
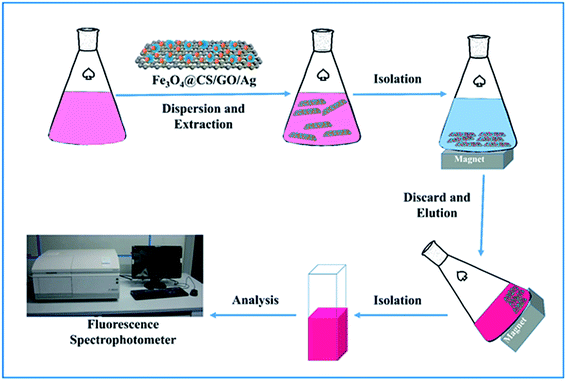
The diagram of MSPE process was shown in Fig. 2. Firstly, Fe3O4@CS/GO/Ag (5 mg) was dispersed into the RB standard or sample solutions (50 mL). Then the mixture was placed on a thermostatic oscillator and allowed to equilibrate for 20 min at 40 °C. Afterwards, the Fe3O4@CS/GO/Ag with RB adsorbed was separated from the solution by using an external magnet. Finally, the isolated Fe3O4@CS/GO/Ag was eluted with ethanol (3.0 mL) for desorption of the earlier adsorbed RB. In the MSPE procedure, an optimal rotating speed (150 rpm) was used to accelerate the extraction and desorption process.3 Results and discussion
3.1 Characterization of the adsorbents
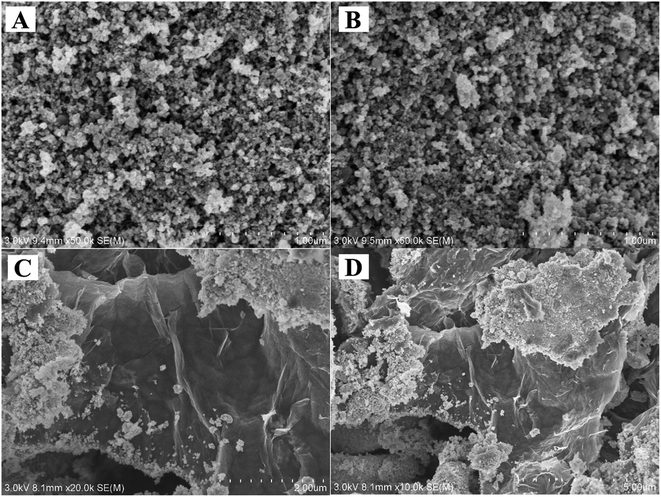
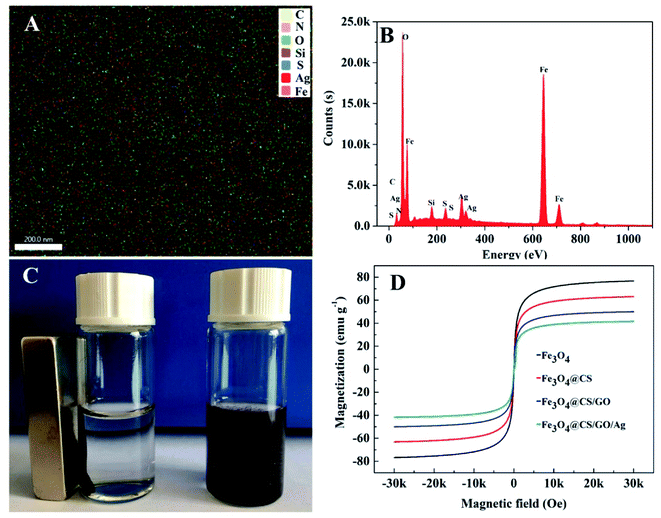
The surface structure and properties of the adsorbents were investigated by an S-4800 field emission scanning electron microscope. The SEM images of Fe3O4 (Fig. 3A), Fe3O4@CS (Fig. 3B), Fe3O4@CS/GO (Fig. 3C) and Fe3O4@CS/GO/Ag (Fig. 3D) were shown in Fig. 3. As shown in Fig. 3A and B, their surface morphologies were very similar, which demonstrated that CS was evenly covered on the surface of Fe3O4. As shown in Fig. 3C, it revealed that Fe3O4@CS NPs have successfully modified onto the surface of GO. From Fig. 3D, it can be observed that more nanoparticles distributed on the surface of Fe3O4@CS/GO. It can be preliminarily indicated that Ag NPs have been modified to the surface of Fe3O4@CS/GO.To further illustrate the successful modification of Ag NPs to the surface of Fe3O4@CS/GO, the elementary composition of Fe3O4@CS/GO/Ag was studied in the work by EDS. EDS results were shown in Fig. 4. As shown in Fig. 4A and B, Fe, Ag, silicon, sulfur etc. were detected on the surface of Fe3O4@CS/GO/Ag, which certified that the successful preparation of Fe3O4@CS/GO/Ag. In addition, as shown in Fig. 4A, we can see that all the elements achieved uniform distribution on the surface of the magnetic adsorbent. Meanwhile, the percentage of each element is 2% C, 1% N, 25% O, 5% Si, 5% S, 54% Fe and 8% Ag, respectively.
The magnetic properties of Fe3O4, Fe3O4@CS, Fe3O4@CS/GO and Fe3O4@CS/GO/Ag were studied by VSM at room temperature. As shown in Fig. 4D, the saturation magnetization (Ms) of Fe3O4 was 76.8 emu g−1, and the Ms decreased to 63.2 emu g−1, 50.0 emu g−1 and 41.8 emu g−1 after the modification of CS, GO and Ag NPs, respectively. From Fig. 4C, although the saturation magnetization value became lower than that of Fe3O4, it stilled enough to meet rapid separation from its water dispersion by an external magnet within 30 s.
3.2 Optimization of extraction and desorption parameters
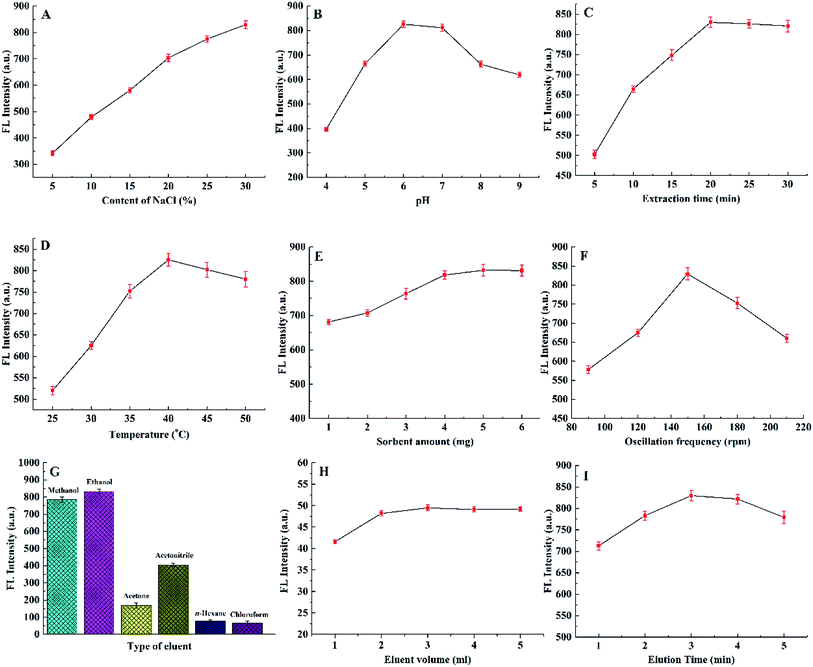
For guaranteeing high extraction efficiency, the following primary extraction parameters (ionic strength, temperature, time, pH, adsorbent amount and oscillation frequency) and desorption parameters (type of eluent, volume of eluent and elution time) were all studied in this work. All the optimization results were shown in Fig. 5. In the work, two rounds of optimization experiments were carried out in the process of optimization. In the first round of optimization process, we optimized the parameters one by one. And then we optimized it as described in Fig. 5. When investigating one parameter, the others were all at optimal conditions that were initially obtained from the first round of optimization process.In the whole extraction process, pH of working media was one of critical parameters for partitioning the analytes especially those bearing ionizable polar groups. The effect of solution pH on the adsorption of RB was presented in Fig. 5B. From pH 4.0 to pH 6.0, the FL intensity of RB was increasing. RB adsorption reached peak-point at pH 6.0, and subsequently decreased at higher pH. The carboxylic group of RB (pKa = 3) becomes deprotonated at pH > 3.15 After deprotonation, the negative electricity leaded to the lowered electrostatic attraction between RB and GO. However, negatively charged RB can lead to better π–π interactions between GO and RB. Also, it can lead to better attraction (electrostatic interaction and electron transference) between Ag NPs and RB. Hence, with pH increased from pH 4.0 to pH 6.0, RB adsorption improved due to the enhanced electrostatic interaction between RB and adsorbent. However, with pH > 6, the negative electricity of adsorbent increased which led to the lowered electrostatic attraction between adsorbent and negatively charged RB. Consequently, pH 6.0 was selected as the optimal value.
The extraction time was defined as the time interval which was decided on the adsorption equilibrium of analytes between the adsorbent and sample solution. In our study, to evaluate the effect of extraction time, the extraction time was investigated from 5 to 30 min. As shown in Fig. 5C, the FL intensity for RB gradually increased up from 5 to 20 min. Further increasing of extraction time (longer than 20 min) can't improve obviously the extraction efficiency. Therefore, the optimum extraction time was set at 20 min, which could meet the need of rapid analysis.
Generally speaking, the extraction temperature also plays an important role in the whole extraction process. On the one hand, an elevated temperature can accelerate the mobility of the molecules and improve extraction rate; on the other hand, the analytes may be desorbed from the adsorbent by exothermic extraction at higher temperatures. Fig. 5D showed the extraction temperature versus FL intensity relationship for RB. 40 °C was chosen as the optimal extraction temperature for the extraction of analytes.
To evaluate the influence of adsorbent amount on extraction efficiency, different amounts of Fe3O4@CS/GO/Ag powder were investigated. Fig. 5E showed the extraction efficiency increased when the adsorbent amount varied form 1 mg to 5 mg, then achieved the maximum and kept invariant in the range of 5–6 mg. Based on the analysis, 5 mg was the optimal amount of adsorbent for the subsequent extraction analysis.
Oscillation can accelerate the mobility of RB molecules from the solution to the adsorbent surface and then improve the extraction efficiency. As shown in Fig. 5F, the FL intensity for RB increased with the oscillation frequency up to 150 rpm. Further increasing of oscillation frequency made the extraction efficiency of RB decreased obviously. Because when the oscillation frequency was higher than 150 rpm, it caused bubble formation which can block the transfer of RB molecules. Hence, 150 rpm was selected as the optimal oscillation frequency.
For the choosing of eluent volume, it should be sufficient enough to desorb all the analytes from the adsorbent and also be as small as possible to increase the enrichment factor. To evaluate the effects of eluent volume, 1 mL, 2 mL, 3 mL, 4 mL, 5 mL, and 6 mL of ethanol were investigated. As shown in Fig. 5H, the quantitative elution (above 98.0%) was obtained when the volume of ethanol was 3.0 mL.
Elution time also played an important role in the whole analysis process. As shown in Fig. 5I, through our exploring, a duration time of 3.0 min appeared to be best for complete desorption. A longer or shorter time was not beneficial for the elution efficiency. Therefore, 3.0 min was selected as the optimum elution time.
3.3 Comparison of different adsorbents
In this study, we compared the adsorption performances of Fe3O4@CS, Fe3O4@CS/GO and Fe3O4@CS/GO/Ag. All the extraction and desorption experiments were performed under the optimal conditions. From Fig. 6, the results illustrated that the extraction efficiency of Fe3O4@CS/GO/Ag was the best. Due to the adding of π–π interactions between GO and RB, the extraction efficiency of Fe3O4@CS/GO increased significantly compared with Fe3O4@CS. After Fe3O4@CS/GO was modified with Ag NPs, the extraction efficiency of Fe3O4@CS/GO/Ag showed a further increasing, which due to Ag NPs' excellent electronic mobility. Therefore, between RB and adsorbents, there existed electrostatic interaction, π–π interactions and electron transference between RB (π-donor system) and Ag (acceptor system), which rendered Fe3O4@CS/GO/Ag excellent extraction efficiency.33,37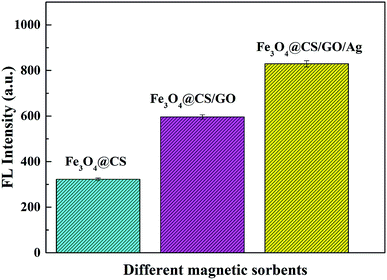 | ||
| Fig. 6 Comparison of extraction efficiencies among Fe3O4@CS, Fe3O4@CS/GO and Fe3O4@CS/GO/Ag with RB concentration 1 μg L−1 and volume 50 mL. | ||
3.4 Method validation and comparison with other methods
Under the optimum conditions, the analytical characteristics of the method, such as linearity, limit of detection (LOD) and limit of quantification (LOQ), reproducibility, were investigated. From Table 1, the proposed method exhibited wide linear ranges (0.2–6.0 μg L−1) with good linearity (R2 = 0.9992), LOD, defined as the concentrations at signal-to-noise ratios (S/N) of 3, was 0.05 μg L−1. LOQ, on the basis of signal-to-noise ratios (S/N) of 10, was 0.2 μg L−1. Before extraction, the initial volume (V0) was 50 mL, the mass of RB in the solution was mo and the concentration of RB was C0 (C0 = mo/V0). After extraction and desorption, the final volume (V1) was 3 mL. Within the linear range, the recovery rate (R) achieved 98%, so the mass of RB in desorption solution was m1 (m1 = mo × R) and the concentration of RB was C1 (C1 = m1/V1 = 98% mo/V1). Therefore, the enrichment factor (EF) of Fe3O4@CS/GO/Ag-based MSPE procedure was 16.7 In addition, the adsorbent of Fe3O4@CS/GO/Ag can be simply recycled and reused with the obtained relative standard deviation (RSD) was less than 3.0%. As shown in Table 1, we also compared with other methods for the extraction of RB. This method with Fe3O4@CS/GO/Ag based MSPE also exhibited a relatively low detection limit.
| Method | Adsorbent | LRa (μg L−1) | LODb (μg L−1) | RSDc (%) | Reference |
|---|---|---|---|---|---|
| a Linear range.b Limit of detection.c Relative standard deviation. | |||||
| MSPE-fluorescence | Fe3O4@CS/GO/Ag | 0.2–6.0 | 0.05 | <3.0 | This method |
| MSPE-fluorescence | Fe3O4/ANI-NA (50–50) | 0.35–5.00 | 0.10 | 2.10–8.20 | 15 |
| MSPE-fluorescence | Fe3O4@SiO2@IL MNPs | 0.4–140.0 | 0.06 | 0.45 | 16 |
| MSPE-fluorescence | Fe3O4@CS/GO/Au | 0.1–6.0 | 0.03 | <3.0 | 33 |
| MSPE-HPLC-UV-visible | Fe3O4@MIPs NPs | 100–8000 | 3.4 | <2 | 7 |
| MSPE-HPLC-DAD | Fe3O4@SiO2@[OMIM]PF6 | 0.5–150.0 | 0.08 | 0.51 | 13 |
3.5 Analysis of real samples
In order to demonstrate the applicability and reliability of the proposed method, it was successfully applied for determining the content of RB in waste water, soft drink, shampoo, and red pencil samples. From the results shown in Table 2, RB was not detected from the soft drink samples while detected in waste water, shampoo, and red pencil samples. To test the accuracy of the established method, two concentrations (0.5 μg L−1 and 2.0 μg L−1) of RB were spiked for the four real samples, respectively. The spiked samples (0.5 and 2.0 μg L−1) were all prepared by adding the RB standard solution to the sample solutions prepared before extraction. As shown in Table 2, the results showed recoveries were between 94% and 97% with RSD from 3% to 6%.| Samples | Spiked (μg L−1) | Found ± SD (μg L−1) | Recovery, RSD (%) | Contents |
|---|---|---|---|---|
| a SD: standard deviation. | ||||
| Waste water | — | 0.65 ± 0.01 | — | 0.65 μg L−1 |
| 0.5 | 1.13 ± 0.02 | 96 ± 4 | ||
| 2.0 | 2.62 ± 0.02 | 97 ± 4 | ||
| Soft drink | — | Not detected | — | Not detected |
| 0.5 | 0.49 ± 0.02 | 95 ± 6 | ||
| 2.0 | 1.92 ± 0.04 | 96 ± 3 | ||
| Shampoo | — | 0.90 ± 0.03 | — | 4.5 μg g−1 |
| 0.5 | 1.38 ± 0.03 | 96 ± 5 | ||
| 2.0 | 2.88 ± 0.02 | 97 ± 3 | ||
| Pencil | — | 0.75 ± 0.03 | — | 1.88 mg g−1 |
| 0.5 | 1.21 ± 0.03 | 94 ± 5 | ||
| 2.0 | 2.70 ± 0.02 | 96 ± 3 | ||
4 Conclusions
For the determination of trace RB, a novel magnetic composite (Fe3O4@CS/GO/Ag) was successfully prepared and characterized. The adsorbent of magnetic graphene oxide modified with chitosan and Ag nanoparticles. The modification of CS, GO and Ag endowed Fe3O4@CS/GO/Ag with high extraction performance. Compared with the Fe3O4@CS/GO, the extraction efficiency of Fe3O4@CS/GO/Ag improved obviously. On the one hand, Ag NPs further increases the specific surface area of the adsorbent; on the other hand, it exist electron transference between RB and Ag which strengthened the affinity. In addition, the main parameters affecting extraction and desorption efficiency were all optimized systematically. Under optimum conditions, good linearity, low LOD and satisfactory spiked recoveries were achieved. The developed method as a simple and efficient extraction and preconcentration technique was successfully applied for trace analysis of RB in waste water, soft drink, shampoo, and red pencil samples, which indicated the resultant adsorbent had satisfactory practicability and operability.Conflicts of interest
The authors declare that they have no competing interests.Acknowledgements
We gratefully acknowledge that financial supports from the National Natural Science Foundation of China (21675071) and the Fundamental Research Funds of Shandong University (2017GN0031).References
- R. Jain, M. Mathur, S. Sikarwar and A. Mittal, J. Environ. Manage., 2007, 85, 956–964 CrossRef CAS PubMed.
- M. R. Longmire, M. Ogawa, Y. Hama, N. Kosaka, C. A. S. Regino and P. L. Choyke, Bioconjugate Chem., 2008, 19, 1735–1742 CrossRef CAS PubMed.
- S. Steplin Paul Selvin, A. Ganesh Kumar, L. Sarala, R. Rajaram, A. Sathiyan, J. Princy Merlin and I. Sharmila Lydia, ACS Sustainable Chem. Eng., 2017, 6, 258–267 CrossRef.
- M. Rahmani, M. Kaykhaii and M. Sasani, Spectrochim. Acta, Part A, 2018, 188, 164–169 CrossRef CAS PubMed.
- W. Wang, Y. Du, Z. Xiao, Y. Li, B. Li and G. Yang, Anal. Sci., 2017, 33, 715–717 CrossRef CAS PubMed.
- S. Wang, B. Yang and Y. Liu, J. Colloid Interface Sci., 2017, 507, 225–233 CrossRef CAS PubMed.
- X. M. Su, X. Y. Li, J. J. Li, M. Liu, F. H. Lei, X. C. Tan, P. F. Li and W. Q. Luo, Food Chem., 2015, 171, 292–297 CrossRef CAS PubMed.
- N. Ozkantar, M. Soylak and M. Tuzen, Turk. J. Chem., 2017, 41, 987–994 CrossRef CAS.
- Y. E. Unsal, M. Soylak and M. Tuzen, Desalin. Water Treat., 2014, 55, 2103–2108 CrossRef.
- M. Soylak, Y. E. Unsal, E. Yilmaz and M. Tuzen, Food Chem. Toxicol., 2011, 49, 1796–1799 CrossRef CAS PubMed.
- C. Desiderio, C. Marra and D. S. Fanali, Electrophoresis, 1998, 19, 1478–1483 CrossRef CAS PubMed.
- A. M. Lopez-Montes, A. L. Dupont, B. Desmazieres and B. Lavedrine, Talanta, 2013, 114, 217–226 CrossRef CAS PubMed.
- J. P. Chen and X. S. Zhu, Food Chem., 2016, 200, 10–15 CrossRef CAS PubMed.
- H. Y. Zhai, L. Huang, Z. G. Chen, Z. H. Su, K. S. Yuan, G. H. Liang and Y. F. Pan, Food Chem., 2017, 214, 664–669 CrossRef CAS PubMed.
- H. Bagheri, R. Daliri and A. Roostaie, Anal. Chim. Acta, 2013, 794, 38–46 CrossRef CAS PubMed.
- A. A. A. A. Bakheet and X. S. Zhu, J. Chem. Sci., 2017, 5, 1–7 CAS.
- W. Q. Xia, P. L. Cui, G. N. Wang, J. Liu and J. P. Wang, Anal. Methods, 2018, 10, 3001–3010 RSC.
- A. Hatamie, M. Nassiri, M. D. Alivand and A. Bhatnagar, Talanta, 2018, 176, 156–164 CrossRef CAS PubMed.
- M. Eftekhari, M. Gheibi, M. Akrami and F. Iranzad, New J. Chem., 2018, 42, 1159–1168 RSC.
- L. Xia, L. Liu, X. Lv, F. Qu, G. Li and J. You, J. Chromatogr. A, 2017, 1500, 24–31 CrossRef CAS PubMed.
- N. A. Kasa, E. Akkaya, B. T. Zaman, G. Çetin and S. Bakirdere, Environ. Monit. Assess., 2018, 190, 589–598 CrossRef PubMed.
- E. O. Er, E. Akkaya, B. Ozbek and S. Bakırdere, Microchem. J., 2019, 147, 269–276 CrossRef CAS.
- Z. L. Cheng, Y. X. Li and Z. Liu, J. Alloys Compd., 2017, 708, 255–263 CrossRef CAS.
- L. Cai, N. Xu, S. Xia, Y. Wang and X. Chen, J. Sep. Sci., 2017, 40, 2925–2932 CrossRef CAS PubMed.
- X. M. Ren, Q. Y. Wu, H. A. Xu, D. D. Shao, X. L. Tan, W. Q. Shi, C. L. Chen, J. X. Li, Z. F. Chai, T. Hayat and X. K. Wang, Environ. Sci. Technol., 2016, 50, 9361–9369 CrossRef CAS PubMed.
- L. M. Cui, X. Y. Guo, Q. Wei, Y. G. Wang, L. Gao, L. G. Yan, T. Yan and B. Du, J. Colloid Interface Sci., 2015, 439, 112–120 CrossRef CAS PubMed.
- S. Mahpishanian and H. Sereshti, J. Chromatogr. A, 2017, 1485, 32–43 CrossRef CAS PubMed.
- H. F. Zhang and Y. P. Shi, Analyst, 2012, 137, 910–916 RSC.
- J. Roithová and D. Schröer, Chem. Rev., 2009, 253, 666–677 Search PubMed.
- J. J. Feng, M. Sun, J. B. Li, X. Liu and S. X. Jiang, Anal. Chim. Acta, 2011, 701, 174–180 CrossRef CAS PubMed.
- Q. X. Zhou, M. Lei, Y. L. Liu, Y. L. Wu and Y. Y. Yuan, Talanta, 2017, 175, 194–199 CrossRef CAS PubMed.
- L. C. Wang, X. D. Hou, J. B. Li, S. J. Liu and Y. Guo, J. Sep. Sci., 2015, 38, 2439–2446 CrossRef CAS PubMed.
- L. L. Xu, H. B. Suo, J. L. Wang, F. X. Cheng, H. M. Liu and H. D. Qiu, Anal. Methods, 2019, 11, 3837–3843 RSC.
- H. B. Suo, L. L. Xu, C. Xu, H. Y. Chen, D. H. Yu, Z. Gao, H. Huang and Y. Hu, Int. J. Biol. Macromol., 2018, 119, 624–632 CrossRef CAS PubMed.
- H. B. Suo, L. L. Xu, C. Xu, X. Qiu, H. Y. Chen, H. Huang and Y. Hu, ACS Sustainable Chem. Eng., 2019, 7, 4486–4494 CrossRef CAS.
- H. M. Liu, Y. Guo, X. S. Wang, X. J. Liang and X. Liu, RSC Adv., 2014, 4, 37381–37388 RSC.
- L. L. Xu, H. B. Suo, X. J. Liang, L. C. Wang, Y. Guo and S. X. Jiang, RSC Adv., 2015, 5, 41536–41543 RSC.
| This journal is © The Royal Society of Chemistry 2019 |

