
 Open Access Article
 This Open Access Article is licensed under a Creative Commons Attribution-Non Commercial 3.0 Unported Licence
Fabrication of a cost-effective lemongrass (Cymbopogon citratus) membrane with antibacterial activity for dye removal
Zengxiao Cai,
Rechana Remadevi,
Md Abdullah Al Faruque,
Mohan Setty,
Linpeng Fan,
Abu Naser Md Ahsanul Haque and
Maryam Naebe *
*
Deakin University, Institute for Frontier Materials, Geelong, Victoria 3216, Australia. E-mail: maryam.naebe@deakin.edu.au
First published on 23rd October 2019
Abstract
Dye wastewater has attracted much attention due to its severe environmental and health problems. The main challenge of separating dyes from wastewater, using adsorption, is developing a functional adsorbent that is cost-effective and sustainable. In this work, we have fabricated a novel low-cost membrane with antibacterial properties from naturally sustainable lemongrass (LG). Lemongrass was cut and milled into powder, then dissolved to prepare a lemongrass membrane. Graphene oxide (GO) was also included to prepare a LG/GO composite membrane. The physiochemical and antibacterial properties of membranes were evaluated and their dye adsorption capability was examined using methylene blue (MB) dye at different concentrations. The kinetic study revealed that the MB adsorption process complied with the pseudo second-order model. The lemongrass membrane showed a rough surface morphology, high reduced modulus and hardness, yet comparable dye adsorption to the LG/GO composite membrane. Considering the natural sustainability of lemongrass as an abundant cellulosic resource, its excellent dye adsorption, antibacterial properties and low cost as well as the facile fabrication technology, the lemongrass membrane could be a promising candidate for dye removal from wastewater with easy separation after use.
Introduction
With the fast development of industrialization, water resources have been seriously contaminated. In the textile industrial sector alone, approximately 200![[thin space (1/6-em)]](https://www.rsc.org/images/entities/char_2009.gif) 000 tons of dye are discharged in effluent each year, which is attributed to the low efficiency of the dyeing process.1 A large quantity of water has been used by the textile industry during the dyeing and finishing process. Due to the substantial amount of wastewater and the complicated composition, the effluent from textile plants has been regarded as the greatest source of water pollution.2 Hence, the dye removal and reusability of the dyed water has attracted much attention.
000 tons of dye are discharged in effluent each year, which is attributed to the low efficiency of the dyeing process.1 A large quantity of water has been used by the textile industry during the dyeing and finishing process. Due to the substantial amount of wastewater and the complicated composition, the effluent from textile plants has been regarded as the greatest source of water pollution.2 Hence, the dye removal and reusability of the dyed water has attracted much attention.
Due to the large quantity, high toxicity and complex composition, dye wastewater induces not only environmental pollution but also health hazards.3 Currently, different methods such as chemical coagulation, electrolysis, oxidation and adsorption have been used to treat wastewater.4–6 However, most of these techniques are limited by their high cost, low adsorption capacity or secondary environmental pollution due to the large quantity of wastewater. The adsorption treatment has been widely used for dye-waste removal because of its simplicity, high efficiency and multifunction.7,8 However, it is still challenging to fabricate a cost-effective environmentally friendly and sustainable adsorbent for dye removal. In addition to the dyes, microorganisms in polluted water can cause biofouling and degradation of metal surfaces which influence industry applications.9 Therefore, it would be beneficial to have dye adsorbent with an antibacterial property.
Although graphene oxide (GO) with a large surface area has demonstrated a high dye adsorption capability and antibacterial property,10,11 the high cost, 2D structure and difficulty of separation after adsorption limit the application of GO in dye adsorption. To solve these problems GO and natural materials have been made into nanocomposites, which have shown a promising application in dye removal.12,13 Natural materials as adsorbent14–16 have attracted more attention because of their low cost, non-toxicity, biodegradability and sustainability.
Lemongrass (LG) is lignocellulose biomass containing around 40% cellulose and approximately 23% hemicellulose.17 Lemongrass, with good biological properties such as antimicrobial, anti-fungal, anti-inflammatory, antioxidant, etc., has been widely used in therapies, cosmetics, food preservation and agriculture.17,18 Due to the good adsorbent characteristics of cellulosic materials,15,16 lemongrass can be a promising candidate for dye adsorption. Additionally the good antibacterial and antifungal properties of lemongrass may further enhance its application in dye adsorption. Previous studies have demonstrated various forms of lemongrass such as powder, ash and extracted oil residual can absorb different metal ions and dye from the aqueous solutions.17,19,20 Only one paper regarding lemongrass dye adsorption has reported that the lemongrass ash is an efficient adsorbent for the adsorption of methylene blue from wastewater.20 However, there is a difficulty of separating ash from the water after dye adsorption. In this study, lemongrass was fabricated into membranes as dye absorbent to study their dye adsorption properties and resolve the separation problem of lemongrass powder or ash.
To the best of our knowledge, there are very few, if any, reports on fabrication of membrane from lemongrass. Therefore, the objective of this study has been to understand the physiochemical and antibacterial properties as well as adsorption kinetics of membranes fabricated from lemongrass. In order to achieve this, we have: (a) fabricated lemongrass membrane and LG/GO composite membrane where separation of membrane from solution is much easier than powder or ash absorbents; and (b) examined the impact of membrane structure on dye adsorption capability of the composite membranes using methylene blue with the aim of rationalising the relationship between the morphology, surface, dye adsorption and mechanical properties. Antibacterial properties of the membranes were also studied to investigate if the fabrication process would retain the natural properties of lemongrass. The finding may assist the fabrication of cost-effective dye adsorbent membrane from natural lemongrass with antibacterial properties.
Results and discussion
Particle size measurement
The particle size distribution of lemongrass snippets (LGSNP) and spray dried powder (LGSDP) are shown in Fig. 1. Table 1 demonstrates the particle size of d (0.1), d (0.5) and d (0.9) at snippets phase and powder phase. While the snippets were converted into spray-dried powder, the particle size distribution changed significantly. The particle size of d (0.5) of LGSNP decreased from 544.34 μm to 7.63 μm while converted into LGSDP. A similar reduction in the particle size was found in case of d (0.1) and d (0.9) during the formation of LGSDP from LGSNP. This depletion of particle size might be due to the intermediate attritor milling process which has been performed before the conversion of LGSNP to LGSDP.21 The attritor mill vessel contains impellers and ceramic balls which rotate at 280 rpm during milling. Hence, the breakdown of the particle size is attributed to the impellers and ceramic balls. It has already been reported that the lower the particle size, the easier the dissolution process.22 Therefore, in this work, to accelerate the dissolution process and to fabricate a uniform membrane the lemongrass spray-dried powder (LGSDP) were selected.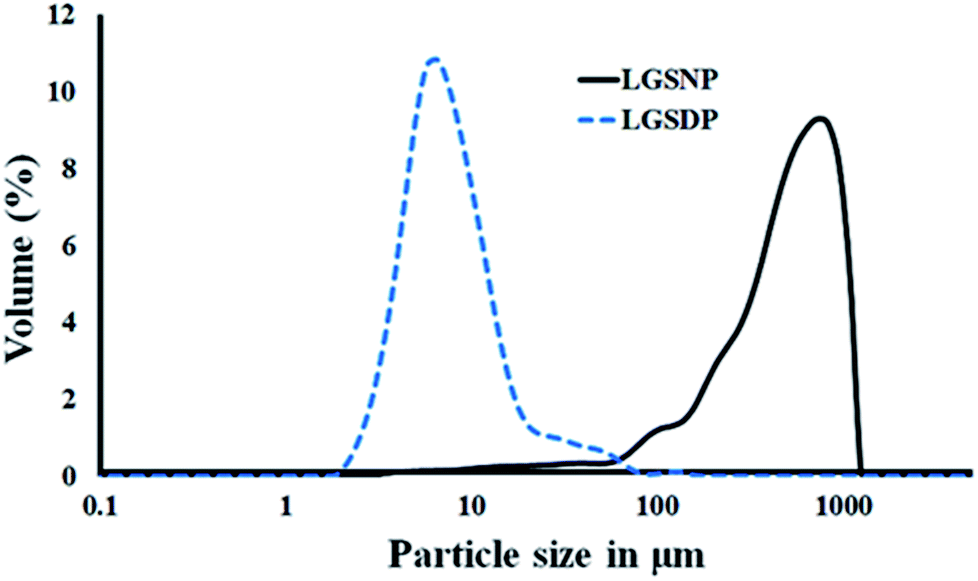 | ||
| Fig. 1 Volume-based particle size distribution of lemongrass snippets (LGSNP) and spray dried powder (LGSDP). | ||
| Sample name | d (0.1) (μm) | d (0.5) (μm) | d (0.9) (μm) |
|---|---|---|---|
| Lemongrass snippets | 133.57 | 544.34 | 1009.65 |
| Lemongrass spray dry powder | 4.20 | 7.63 | 17.87 |
Morphology and structure of the membrane
The surface and cross-section morphology of the prepared membranes are shown in Fig. 2. Cross sections are presented on top right side of images. The LGES membrane showed a relatively smooth surface with many holes on the surface which could be formed due to the local contract of the membrane during the drying time of membrane fabrication. The cross-section image (Fig. 2a) showed a compressed and smooth structure. Fig. 2b shows both rough surface and cross-section morphology of the LGDM membrane, where the small particles induced the roughness due to the controlled dissolution of LG. GO was dispersed uniformly in the membrane as shown in Fig. 2c and d. The cross-section image (Fig. 2a) showed a compressed and smooth structure. Fig. 2b shows both rough surface and cross-section morphology of the LGDM membrane, where the small particles induced the roughness due to the controlled dissolution of LG. GO was dispersed uniformly in the membrane as shown in Fig. 2c and d. The surface of LGES/GO and LGDM/GO membranes (Fig. 2c and d) were rougher compared to their pure corresponding LGES and LGDM membrane without GO. However, LGES/GO showed a smoother surface than that of LGDM. While cross-section images of both LGES/GO and LGDM/GO membranes showed layered structure, some cracks were also observed, which could be attributed to the arrangement of GO layer in the formation of membrane. The results were found to agree with the previous studies, where layered structure in cellulose/graphene nanocomposite paper23 and cellulose/graphene/graphene oxide membrane24 were reported.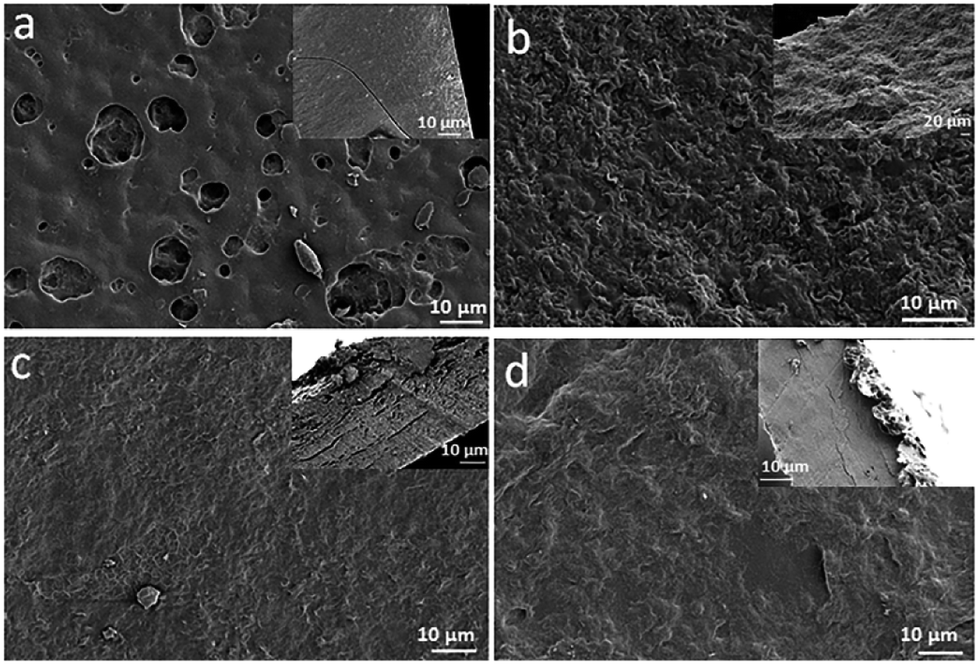 | ||
| Fig. 2 Surface morphology and cross-section images (inset) of lemongrass membranes. (a) LGES (lemongrass extracted solution); (b) LGDM (lemongrass dissolved mixture); (c) LGES/GO (LGES mixed with graphene oxide); (d) LGDM/GO (LGDM mixed with graphene oxide). | ||
FTIR and XRD analysis
Fig. 3a shows the FTIR spectra of lemongrass/GO composite membranes. The peaks at 3305 cm−1 (LGES) and 3296 cm−1 (LGDM) corresponded to the stretching vibration of the hydroxyl (–OH) group. However, there was a shift in the intensity of hydroxyl group in the composite membranes of LGES/GO (3340 cm−1) and LGDM/GO (3344 cm−1) which was attributed to the strong absorption of hydroxyl of GO.25 The peaks at 2918 cm−1 (LGES, LGDM, LGDM/GO), and 2922 cm−1 (LGES/GO) were associated to the stretching vibration of the alkane (C–H) group owing to the methyl and methylene group of cellulose.26 The peak intensity at 1718 cm−1 corresponding to the C![[double bond, length as m-dash]](https://www.rsc.org/images/entities/char_e001.gif) O stretching vibration of –COOH group of GO quite weak in LGES/GO and LGDM/GO composite membrane, which indicated the successful formation of hydrogen bonds with the –OH groups of LGES and LGDM in the composite membrane.26 The peaks at 1635 cm−1 (LGES), 1637 cm−1 (LGDM), 1633 cm−1 (LGES/GO) and 1641 cm−1 (LGDM/GO) were assigned to the CC stretching. The peak at 1410 cm−1 (LGES) and 1417 cm−1 (LGDM) shifted to 1420 cm−1 (LGES/GO) and 1421 cm−1 (LGDM/GO), which indicated the existence of GO in the composite membrane. The peaks at 1031 cm−1 (LGES), 1037 cm−1 (LGDM), 1035 cm−1 (LGES/GO) and 1026 cm−1 (LGDM/GO) were assigned to the C–O stretching. The peaks of the FTIR spectra of LGES/GO and LGDM/GO presented a combination of peaks of pure GO, LGES and LGDM, which indicated the successful dispersion of GO in the nanocomposites. The results are in agreement with morphology analysis that showed the uniform dispersion of GO in the membrane (Fig. 2c and d).
O stretching vibration of –COOH group of GO quite weak in LGES/GO and LGDM/GO composite membrane, which indicated the successful formation of hydrogen bonds with the –OH groups of LGES and LGDM in the composite membrane.26 The peaks at 1635 cm−1 (LGES), 1637 cm−1 (LGDM), 1633 cm−1 (LGES/GO) and 1641 cm−1 (LGDM/GO) were assigned to the CC stretching. The peak at 1410 cm−1 (LGES) and 1417 cm−1 (LGDM) shifted to 1420 cm−1 (LGES/GO) and 1421 cm−1 (LGDM/GO), which indicated the existence of GO in the composite membrane. The peaks at 1031 cm−1 (LGES), 1037 cm−1 (LGDM), 1035 cm−1 (LGES/GO) and 1026 cm−1 (LGDM/GO) were assigned to the C–O stretching. The peaks of the FTIR spectra of LGES/GO and LGDM/GO presented a combination of peaks of pure GO, LGES and LGDM, which indicated the successful dispersion of GO in the nanocomposites. The results are in agreement with morphology analysis that showed the uniform dispersion of GO in the membrane (Fig. 2c and d).
 | ||
| Fig. 3 FTIR spectra (a) and XRD patterns (b) of LGES (lemongrass extracted solution) membrane, LGDM (lemongrass dissolved mixture) membrane, LGES/GO (LGES mixed with graphene oxide) membrane and LGDM/GO (LGDM mixed with graphene oxide) membrane. | ||
XRD patterns of all membranes are shown in Fig. 3b. The characteristic peaks at 20.6° (LGES), 23.2° (LGDM), 20.8° (LGES/GO) and 21.4° (LGDM/GO) corresponded to the cellulose.27 The 2θ peak of GO at 12.0° was not observed in the GO/LG composite membranes. In agreement with study of Han et al. on regenerated cellulose/graphite oxide (GO) blended films,28 the disappearance of the corresponding GO peak might be due to further GO exfoliation into single layer as a result of mixing process. Additionally, it has been reported that the hydrogen bond interactions between cellulose and GO induced the disappearance of the periodic interlayer spacing.29 This interaction has been supported by FTIR, where a shift in the intensity of the hydroxyl group in the composite membranes was observed.
Nano-indentation
Fig. 4a shows hardness results of all fabricated membranes. LGDM membrane showed higher hardness (329.5 ± 16.4 MPa) than LGES membrane (222.2 ± 11.9 MPa). The mixture of the dissolved and undissolved particle as well as the compacted structure (Fig. 2b) may have contributed to the higher hardness of LGDM compared to LGES membrane. With the addition of GO to LGES, hardness increased by 5%, from 222.2 ± 11.9 MPa (LGES) to 232.9 ± 23.2 MPa (LGES/GO). Since GO possess good mechanical properties, it was not surprising that addition of GO enhanced the hardness of the membrane, although it resulted in formation of cracks as shown by SEM cross-section image. Surprisingly, LGDM membrane showed the highest hardness, which was higher than that of the LGDM/GO membrane (176.9 ± 10.4 MPa). This might be due to the fact that the addition of GO destroyed the uniform compacted structure of LGDM membrane as many cracks were formed in LGDM/GO, as shown in Fig. 2b and d.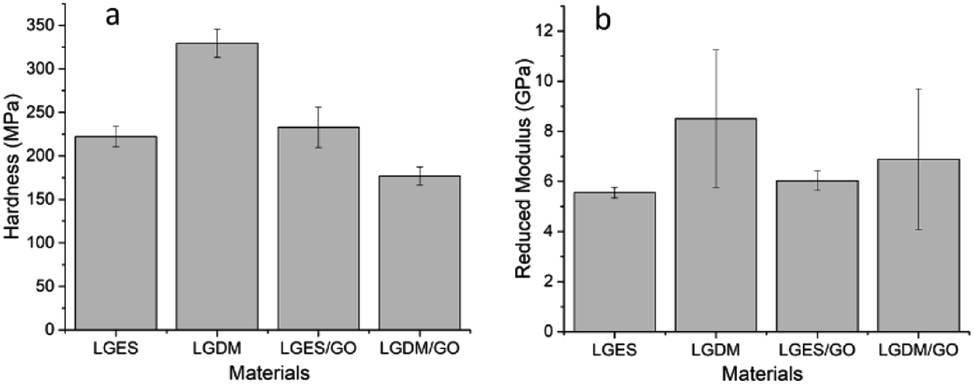 | ||
| Fig. 4 Materials hardness (a) and reduced modulus (b) of 40 indents at a maximum load of 1 mN load. LGES (lemongrass extracted solution) membrane, LGDM (lemongrass dissolved mixture) membrane, LGES/GO (graphene oxide mixed with LGES (5/95 (w/w))) membrane and LGDM/GO (graphene oxide mixed with LGDM (5/95 (w/w))) membrane. Error bars indicated standard deviation. | ||
The reduced modulus of membranes as illustrated in Fig. 4b, demonstrated similar trend with hardness when adding GO and was consistent with the study of Wu et al. in preparation of cellulose nanocrystal films using switchgrass and cotton,30 where the reduced modulus of fabricated films pursued similar trend to the hardness of films. The large standard deviation of reduced modulus of LGDM and LGDM/GO membrane was probably due to the existence of LG particles and GO sheets as shown in Fig. 2b and d.
Fig. 5 showed the SPM image and calculated average roughness (Ra) of fabricated membranes. Consistent with SEM images (Fig. 2), both LGES and LGES/GO membrane showed smoother surfaces compared to LGDM and LGDM/GO. LGDM/GO membrane showed the highest roughness (ranged from 200 nm to 284.6 nm) due to presence of LG particles and GO sheets. A large quantity of LG particles also resulted in higher roughness of LGDM membrane (183.4 ± 52.5 nm) compared to LGES/GO membrane (88.3 ± 9.8 nm). The roughness of membranes would be an advantage, as it may facilitate dye adsorption onto the membrane. This will be discussed further in the following section. The LGES membrane exhibited the lowest roughness (81.7 ± 24.1 nm), which was consistent with the result of SEM images (Fig. 2). The addition of GO slightly increased the roughness of LGES membrane, which might be attributed to the homogeneous mixing and interaction between LGES solution and GO sheets.
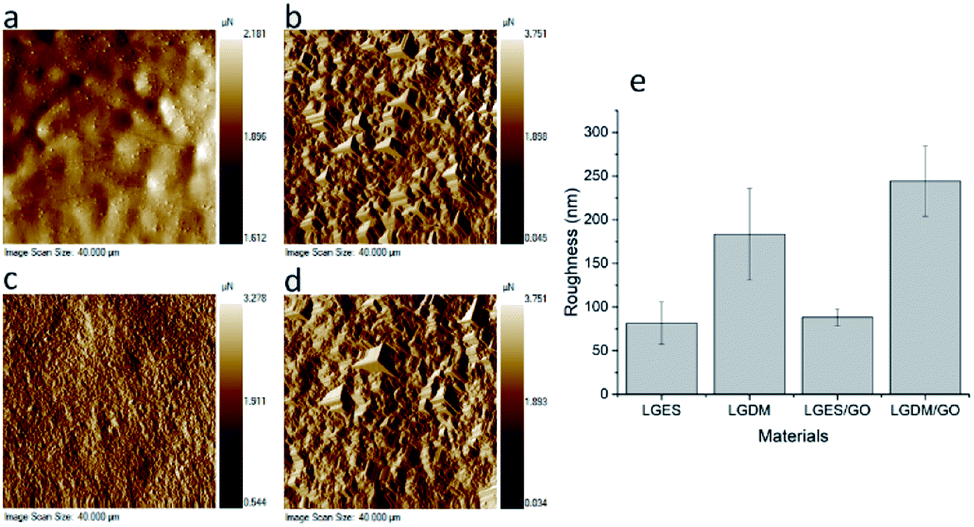 | ||
| Fig. 5 SPM image (left) and Average Roughness (Ra) of materials (right): (a) LGES (lemongrass extracted solution) membrane; (b) LGDM (lemongrass dissolved mixture) membrane; (c) LGES/GO (graphene oxide mixed with LGES (5/95 (w/w))) membrane; (d) LGDM/GO (graphene oxide mixed with LGDM (5/95 (w/w))) membrane and (e) average roughness (Ra) of materials. Error bars indicated standard deviation. | ||
Thermogravimetric analysis
The effect of temperature on weight loss of LGES, LGDM, LGES/GO and LGDM/GO membranes along with LG snippets (LGSNP) for comparison purpose is demonstrated in Fig. 6. While the addition of GO slightly changed the thermal degradation of LGES and LGDM, three stages of thermal degradation can be seen for all samples. The first stage of thermal degradation occurring from room temperature to around 150 °C can be attributed to the loss of moisture and light volatile compounds of lemongrass. LGES showed the highest weight loss in this stage compared to the other four samples. This can be attributed to the higher moisture absorption of the membrane due to the purity of this membrane without any LG particles and GO nanosheets, as well as the higher amount of holes in the structure (as observed by SEM images) which induced more moisture absorption. The weight loss rapidly decreased in the second stage which occurred from 150 °C to approximately 350 °C. This could be attributed to de-volatilization reactions in which most of the organic part of the LG was diminished as volatile matter.14 The third stage occurred between 350 °C and 800 °C, where the weight loss decreased due to the continuous decomposition, however, LGDM showed faster degradation than the other four samples. This could be due to the existence of LG particles, which showed quicker decomposition. The remaining weight at 800 °C represents the char content of the samples: LGSNP (25.2%), LGDM (20.1), LGES (20.0%), LGES/GO (26.4%) and LGDM/GO (22.5%). A sharp weight drop occurred at 800 °C when gas switched from nitrogen to oxygen. The marked weight loss was attributed to the combustion of residual carbon. The final weight corresponded to the ash content of each sample. The remaining content of each sample was LGSNP (9.5%), LGDM (3.9%), LGES (3.4%), LGES/GO (3.3%) and LGDM/GO (5.3%). The high remaining content of LGSNP at 900 °C might be due to the lignin which was not physically and chemically destroyed during sample preparation. It is worth mentioning that thermal degradation stages and ash content of LGDM membrane were found similar to that of milled LG particles reported by Lee et al.,14 which further demonstrated the effect of LG particles on LGDM membrane properties.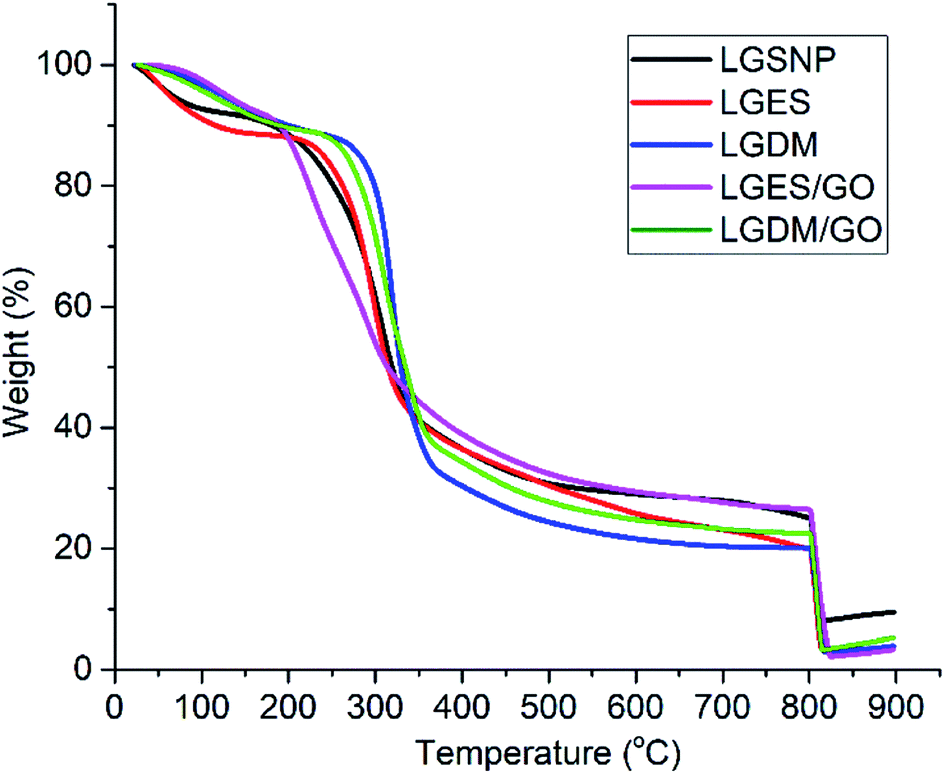 | ||
| Fig. 6 Thermogravimetric analysis of LGSNP (lemongrass snippets), LGES (lemongrass extracted solution), LGDM (lemongrass dissolved mixture), LGES/GO (graphene oxide mixed with LGES (5/95 (w/w))) and LGDM/GO (graphene oxide mixed with LGDM (5/95 (w/w))) membranes. | ||
Dye adsorption analysis
To analyse the dye adsorption of the fabricated membranes, methylene blue (MB) at three different initial concentrations of 15 mg L−1, 100 mg L−1 and 400 mg L−1 was used. Fig. 7 shows MB adsorption behaviour of the prepared membranes within 24 h at room temperature. Table 2 lists the adsorption amount of MB at different initial concentrations after 24 h adsorption. All the prepared membranes showed the highest adsorption capacity at 400 mg L−1 MB concentration (Table 2). As shown in Fig. 7, at the initial 30 minute-mark, the LGDM/GO membrane showed the highest adsorption capacity at all the three MB concentrations, as well as the highest adsorption capacity of 68.4 mg g−1 at 400 mg L−1 MB concentration. This could be due to the combination of rough surface, presence of particles and GO layer in the LGDM/GO membrane (as shown in Fig. 2d and 5d) which increased the surface area and binding sites of dye. At 15 mg L−1 concentration of MB and up to 7 h, the LGDM membrane showed an identical adsorption behaviour to LGES/GO membrane. However, at both concentration of 15 mg L−1 and 100 mg L−1 MB and after 7 h, LGDM and LGDM/GO were almost identical and reached the plateau. The adsorption for both membranes after 24 h, at 15 mg L−1 was almost 100% and at 100 mg L−1 of MB was greater than 80%. The results are promising, as LGDM membrane showed higher MB adsorption (at 15 mg L−1 concentration, Table 2) at equilibrium qe (5.64 mg g−1) than the Daucus carrot leaves powder (4.4 mg g−1) under similar condition.31 Even with different adsorbent dose and MB concentration, LGDM membrane also showed comparable MB adsorption at equilibrium with that of yellow passion-fruit waste peel powder.32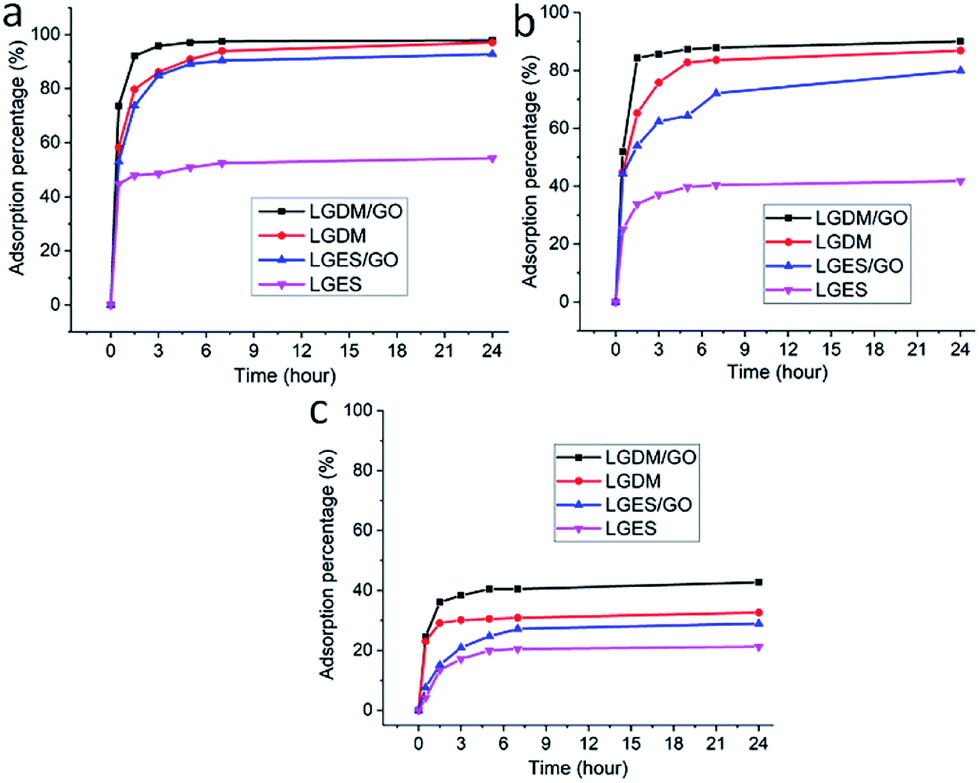 | ||
| Fig. 7 Adsorption of different initial concentrations of methylene blue (MB) with LGES (lemongrass extracted solution), LGDM (lemongrass dissolved mixture), LGES/GO (graphene oxide mixed with LGES (5/95 (w/w))) and LGDM/GO (graphene oxide mixed with LGDM (5/95 (w/w))) membranes, respectively, within 24 h. (a) 15 mg L−1 MB, (b) 100 mg L−1 MB, (c) 400 mg L−1 MB. | ||
| Absorbent membrane | Adsorption amount (mg g−1) of 15 mg L−1 MB | Adsorption amount (mg g−1) of 100 mg L−1 MB | Adsorption amount (mg g−1) of 400 mg L−1 MB |
|---|---|---|---|
| LGDM/GO | 5.9 | 36.0 | 68.4 |
| LGDM | 5.8 | 34.7 | 52.2 |
| LGES/GO | 5.6 | 31.9 | 46.3 |
| LGES | 3.3 | 16.7 | 33.9 |
While at higher concentration of MB (400 mg L−1) LGDM/GO showed higher adsorption compared to LGDM, the differences were around 10% and their initial adsorption was similar (25%). LGES membrane showed the lowest MB adsorption among all membrane and at all three MB concentrations. Although the pores on the surface of LGES membrane (Fig. 2a) can provide more sites for dye adsorption, its compacted structure significantly limited the adsorption capacity. These findings indicated that the presence of lemongrass particles in LGDM membrane plays a major role in the dye removal and its behaviour in dye adsorption is comparable with membrane fabricated from GO with its large surface area which affects the diffusion of dyes onto the membrane. This further is discussed in next section; dye adsorption kinetics.
Dye adsorption kinetics
The adsorption kinetics of methylene blue (15 mg L−1) on LGDM/GO, LGDM, LGES/GO and LGES membranes were investigated using pseudo-first order,33 pseudo-second order34 and intra-particle diffusion35 models and are plotted in Fig. 8.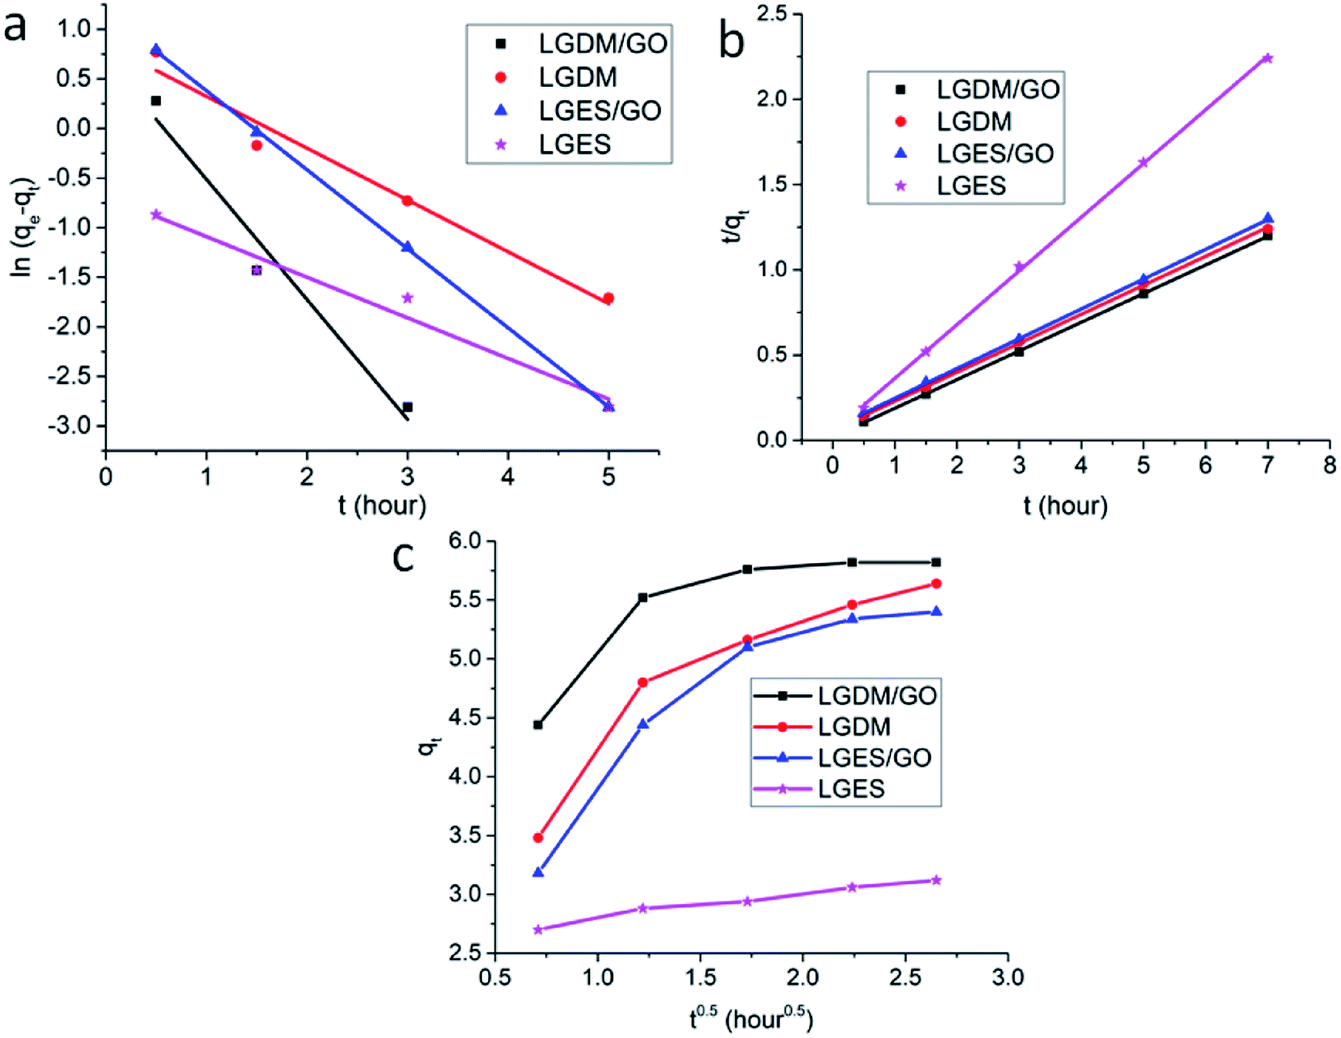 | ||
| Fig. 8 Adsorption kinetics of methylene blue on lemongrass membranes: (a) pseudo-first order, (b) pseudo-second order, (c) intra-particle diffusion plot. | ||
The Lagergren pseudo-first order kinetic model33 is expressed as the following equation:
| ln(qe − qt) = lnqe − k1t |
qe) of the linear plots (Fig. 8a) are listed in Table 3. Although all the membranes showed a high correlation coefficient, the experimental values of qe (qeexp in Table 3) were higher than the qecal. Therefore the pseudo-first order model did not comply with the kinetic data.
| Membrane | qeexp | Pseudo-first order | Pseudo-second order | Intra-particle diffusion | ||||||
|---|---|---|---|---|---|---|---|---|---|---|
| qecal | k1 | R2 | qecal | k2 | R2 | ki | C | R2 | ||
| LGDM/GO | 5.82 | 2.01 | 1.21 | 0.969 | 5.95 | 1.38 | 0.999 | 0.2 | 5.33 | 0.787 |
| LGDM | 5.64 | 2.33 | 0.52 | 0.972 | 5.88 | 0.48 | 0.999 | 0.59 | 4.11 | 0.991 |
| LGES/GO | 5.4 | 3.2 | 0.8 | 0.999 | 5.72 | 0.42 | 0.999 | 0.66 | 3.78 | 0.869 |
| LGES | 3.12 | 0.506 | 0.41 | 0.968 | 3.17 | 1.93 | 0.999 | 0.18 | 2.66 | 0.983 |
The pseudo-second order kinetic model34 is expressed as the following equation:
| t/qt = 1/k2q2e + t/qe |
Intra-particle diffusion35 model was also applied to investigate the role of diffusion in the membrane dye adsorption process, which is expressed as the following equation:
| qt = kit0.5 + C |
Antibacterial activity
Though the antibacterial activity of lemongrass essential (extracted) oil has been widely reported,36–38 there is no report on antibacterial property of membrane fabricated from lemongrass. Therefore, in this work, the antibacterial activity of lemongrass membranes was also evaluated to investigate if the fabrication process would retain the natural properties of lemongrass. The evaluation is shown by the inhibition zone (Fig. 9a and b, agar disc diffusion method), i.e., the clear zone surrounding the tested membrane where the growth of bacteria is inhibited due to the antibacterial property of membrane. Although there was no growth of bacteria on all the membranes, the inhibition zone was quite small which cannot clearly show the membrane antibacterial activity. To further investigate the antibacterial activity of prepared membranes during dye adsorption, the growth performance of bacteria in modified tryptone soya broth with and without a membrane (control) was monitored during 24 h (Fig. 9c). LGDM/GO membrane showed the lowest optical density than the other membranes at each time point within 24 h, which indicated its highest bacteria growth inhibition among the prepared membranes. This could be due to the full contact interactions between bacteria and membrane. The antibacterial property of GO and lemongrass works better in liquid phase using tryptone soya broth than on the solid agar plate. With the addition of GO, LGDM/GO and LGES/GO membrane had lower bacteria growth optical density than LGDM and LGES membrane, which means the incorporation of GO improves membrane antibacterial activity. Although the incorporation of GO can enhance antibacterial activity,39–41 the lemongrass membranes also showed antibacterial properties, and LGDM membrane demonstrated the comparable antibacterial activity with the LGDM/GO membrane within 7 h interaction. This further supports the hypothesis that the fabrication process would maintain the natural properties of lemongrass. Considering the low cost and abundance of lemongrass, the LGDM is more promising as dye adsorbent with antibacterial activity than the membrane with the addition of GO.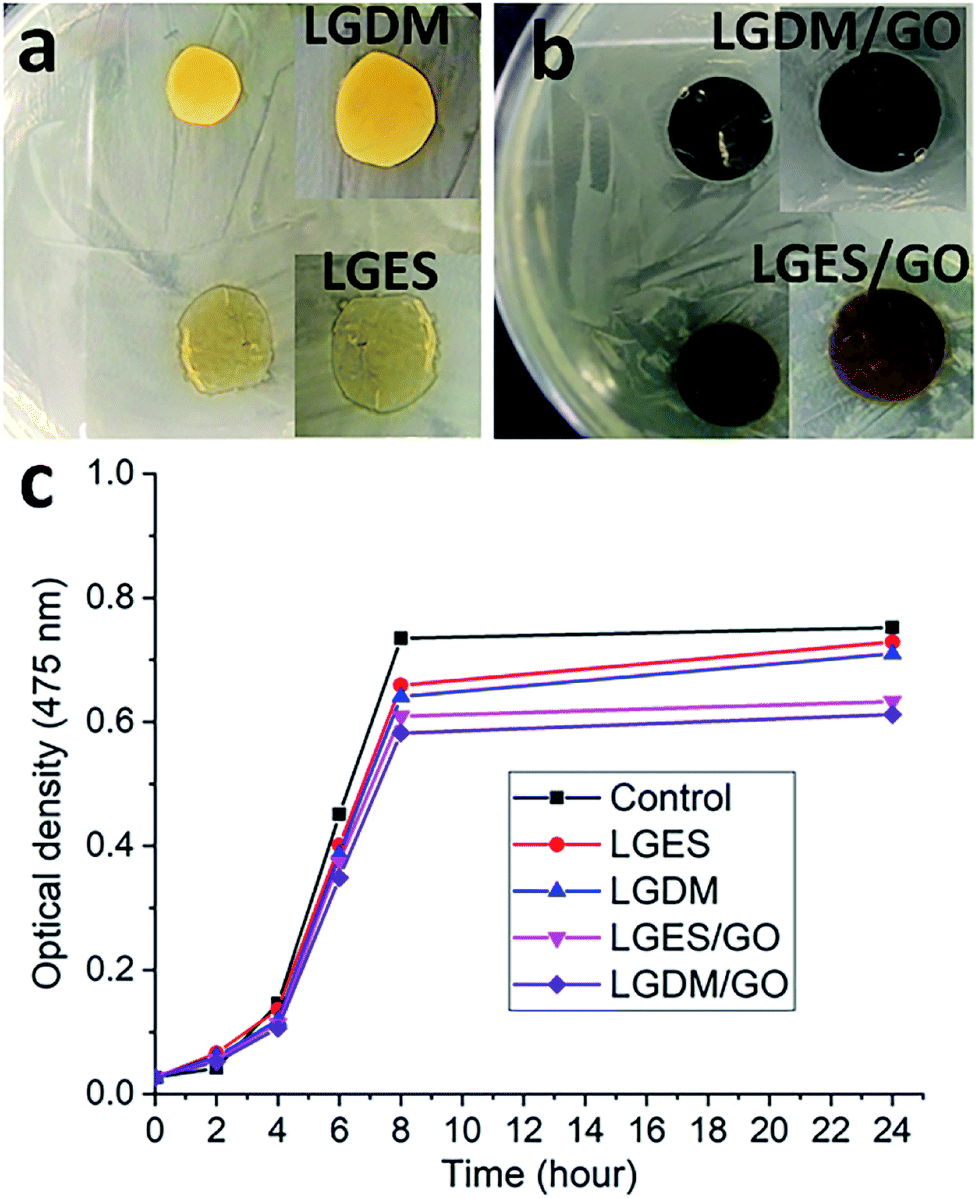 | ||
| Fig. 9 Bacterial inhibition zone (a and b) and bacterial growth performance (c) of LGES (lemongrass extracted solution), LGDM (lemongrass dissolved mixture), LGES/GO (graphene oxide mixed with LGES (5/95 (w/w))) and LGDM/GO (graphene oxide mixed with LGDM (5/95 (w/w))) membranes during 24 h of incubation against E. coli. | ||
Experimental
Materials
Lemongrass was purchased from the local supermarket. Sodium hydroxide (NaOH), urea and methylene blue (MB) were purchased from Sigma-Aldrich (Australia). Nylon membrane filters with pore size 0.45 μm were from ProSciTech Pty Ltd (Australia).Preparation of lemongrass powder
Lemongrass was rinsed with water and dried at 37 °C for 60 h. The dried lemongrass was first converted into snippets by the rotary cutter mill (Pulverisette 19, Fritsch GmbH, Germany). The lemongrass snippets (LGSNP) then were mixed with deionized (DI) water (0.1 g mL−1) and milled into lemongrass slurry using Attritor milling (2S, Union Process, USA). The lemongrass powder was obtained by drying the above slurry with a mini spray dryer (B-290, Buchi Labortechnik AG, Switzerland).Synthesis of graphene oxide
Graphene oxide (GO) dispersion was synthesized using the modified Hummers' method.42 First 1 g of expanded graphite was stirred in 200 mL sulfuric acid at 400 rpm for 24 h, and 10 g grounded KMnO4 powder was added into the mixture slowly and stirred for 24 h. The mixture was put in an ice bath to decrease the temperature to 5 °C. Then 200 mL DI water was injected into the mixture at different flow rates: the first 10 mL at 5 mL h−1, then 40 mL at 20–30 mL h−1 and the rest 150 mL at 50 mL h−1. 30% H2O2 solution (no more than 30 mL) was added into the mixture and stirred for another 30 min to consume the excessive KMnO4. Subsequently, 500 mL of HCl solution (water to HCl is 9:1 (v/v)) was stirred with the mixture for 30 min, followed by centrifuging at 6000 rpm for 20 min. The GO dispersion was repeatedly washed and centrifuged about 7 times until the pH reached 6.
Preparation of lemongrass membrane with and without graphene oxide
Four different membranes were fabricated in this work as follows. Lemongrass powder (1 g) was dissolved in 100 mL of an aqueous mixture of 7% NaOH and 12% urea at room temperature for 3 days. Then the mixture was dialyzed against DI water with a cellulose dialysis tube (molecular weight cut-off = 14000 kDa; Sigma Aldrich, Australia) at room temperature for 3 days. The dialysed solution containing lemongrass particles was used as the lemongrass-dissolved mixture (LGDM). Subsequently, the lemongrass-extracted solution (LGES) was obtained by centrifuging the LGDM, to remove undissolved lemongrass particles.
LGES solution was poured into a Petri dish and dried in a fume hood at room temperature to prepare LGES membrane. The membrane was dried further in the oven overnight at 60 °C. LGDM solution mixture was filtrated through nylon membrane (0.45 μm pore, 47 mm diameter) using a vacuum filtration assembly, and the prepared LGDM membrane dried for 24 h at room temperature. GO water solution was added into LGES solution and ultra-sonicated for 4 h, followed by vacuum filtration. After filtration, the LGES/GO (95 wt% LGES:5 wt% GO) membrane was peeled off from the nylon membrane and dried for further testing. LGDM/GO (95 wt% LGDM:5 wt%GO) membrane was prepared using the same methods as LGES/GO membrane. Fig. 10 illustrates the preparation of the lemongrass powder, lemongrass membrane as well as lemongrass/GO composite membranes.
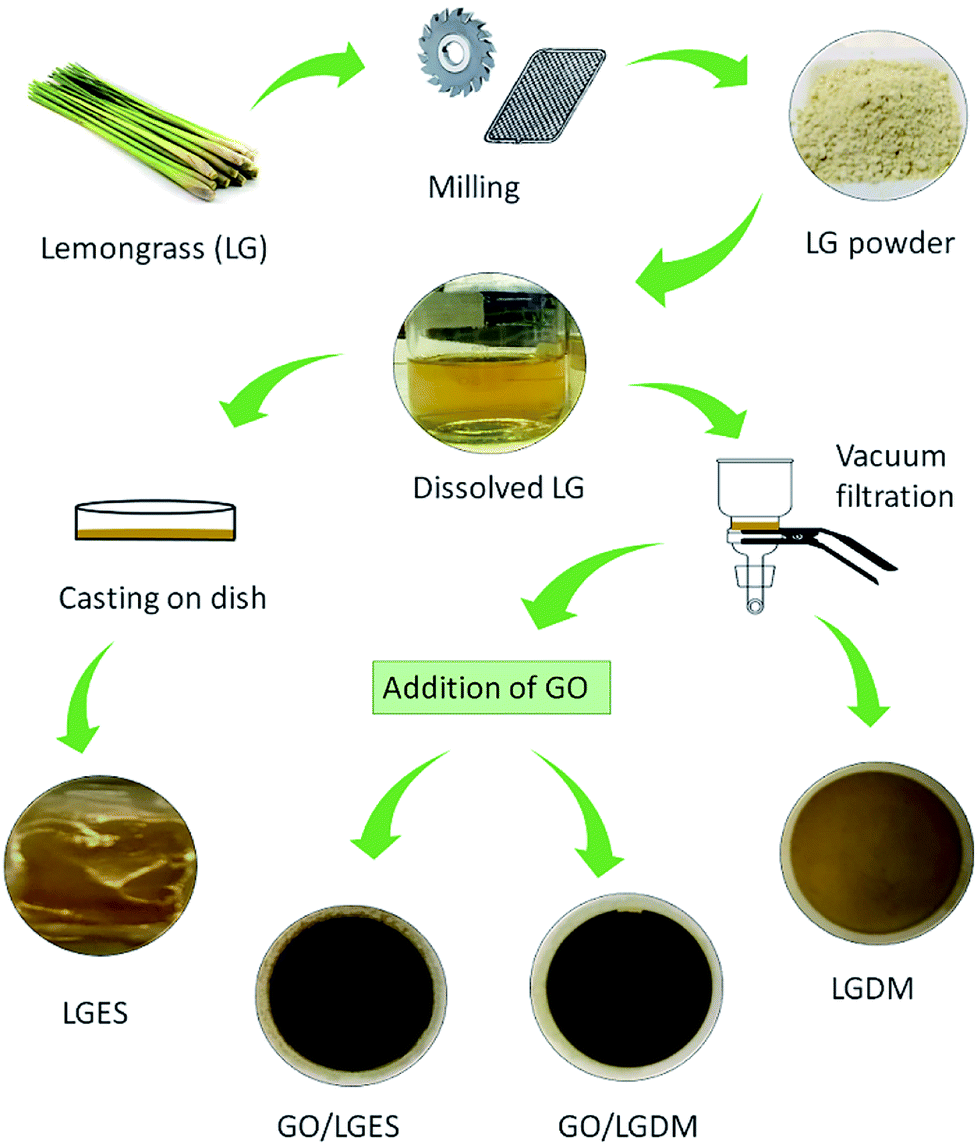 | ||
| Fig. 10 Schematic fabrication process from lemongrass (LG) plant to membranes. | ||
Characterization
The particle size of lemongrass snippets and spray dried powder was measured using the Malvern Mastersizer 2000 (USA). The volume-based particle size test method was used to analyse the particle size: the volume medium diameter d (0.5) represents that 50% particles are higher, and 50% particles are lower than the stated size. Additionally, d (0.1) and d (0.9) mean that 10% and 90% of the tested particles were smaller than the presented size.21 Error bars were neglected owing to the Mastersizer 2000 powder samples measurements having insignificant variation in d (0.5) measurements.The morphology of membranes was scanned using a scanning electron microscopy (SEM) (Zeiss Supra 55VP). Membranes were gold sputter-coated (Leica EM ACE600) and then imaged under the SEM with 5 kV accelerating voltage. To obtain the cross-sectional image, membranes were submerged in liquid nitrogen for 3 minutes and the membranes were manually cross-sectioned using a clean, sharp razor blade, and the cross-sections were gold sputter coated and imaged using SEM with 3 kV accelerating voltage.
The fine structure of the membranes was analysed using Fourier transform infrared spectroscopy (FTIR) and X-ray diffraction (XRD). The FTIR spectra of the membrane samples were obtained from Bruker Vertex 70 FTIR spectrometer with an ATR (attenuated total reflectance) mode, with a scan resolution of 4 cm−1 and 64 scans per sample in the range of 4000 cm−1–500 cm−1. The spectral data were analysed (baseline correction) with OPUS 5.5 software.
The X-ray diffractogram (XRD) of all the samples was acquired by PANalytical X'Pert Power X-ray Diffraction instrument at 40 kV and 30 mA. The experiments were performed in the diffraction range from 6° to 40° at a 0.013° step size with a speed of 150 seconds per step. The data then was extracted by Highscore Plus V4.6a software.
Thermal properties of LGSNP, LGES, LGDM, LGES/GO and LGDM/GO membranes were analysed using thermogravimetric analysis (TGA) which was conducted on TGA Q50 (USA). Samples (5–10 mg) were heated from room temperature to 800 °C at a heating rate of 10 °C min−1 under a nitrogen atmosphere. The gas was changed to oxygen from 800 °C and heated to 900 °C at 10 °C min−1.
Nano-indentation tests were conducted on all membrane samples with Hysitron “TI 950 Tribo-Indenter” to investigate hardness, reduced modulus and surface roughness. The equipment with a standard Berkovich probe was calibrated before each test.
The probe was forced onto the sample at 200 μN s−1 for 5 seconds and held at the peak load of 1000 μN (Pmax) for 2 seconds, then unloaded at 200 μN s−1. Hardness (H) was calculated based on the following formula:43

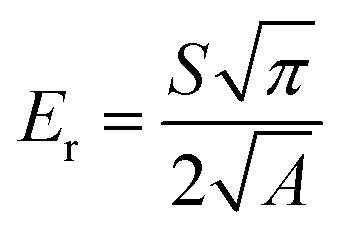
The membrane reduced modulus Er was calculated following Oliver–Pharr model.44
Surface roughness (Ra) was measured using scanning probe microscopy (SPM). Seven spots were randomly chosen on each sample. The projected area of 1600 μm2 was scanned at each spot with a probe speed of 16 μm s−1. Berkovich tip was used for SPM with an imaging load of 2 μN. Post scanning, ‘Tribo view’ software was used to remove sample tilt by ‘background subtraction’ routine and to calculate ‘Ra’.
Three different initial methylene blue (MB) concentrations of 15 mg L−1, 100 mg L−1 and 400 mg L−1 were prepared in DI water. For the dye adsorption test, 10 mg of membranes were put in 4 mL of dye solution and shaken at a rate of 100 rpm at ambient temperature. At time intervals of 0, 0.5, 1.5, 3, 5, 7 and 24 h, the dye solution was respectively measured using a UV-Vis spectrophotometer (Cary 300, Agilent Technologies). The percentage of dye adsorption at each time interval was calculated using the following equation and based on the maximum absorption peak for MB (at 664 nm):

The amount of dye adsorbed on membranes at equilibrium qe (mg g−1) was calculated using the following equation:31
| qe = (C0 – Ce)V/M |
The antibacterial property of membranes was tested using a disk diffusion method. Escherichia coli (E. coli; ATCC no. 11229) was used as test bacteria. E. coli strain was cultured in a sterilized glass bottle with modified tryptone soya broth (TSB) in a shaker incubator at 37 °C overnight. 100 μL of inoculum containing approximately 106 CFU mL−1 was spread throughout the surface of tryptic soy agar plates and then circular discs for each type of membranes were placed on it and incubated in the incubator at 37 °C for 24 h. Then the inhibition zones around the membranes were captured with a digital camera to illustrate the antibacterial property of membranes.
Bacteria growth performance in modified tryptone soya broth with and without membrane was monitored during 24 h to investigate the antibacterial activity of prepared membranes during dye adsorption. E. coli suspension (105 CFU mL−1) was inoculated in 35 mL modified TSB with 50 mg membrane. The control group was only E. coli suspension in 35 mL modified TSB. These bottles were then stored in a shaker incubator (at 110 rpm) at 37 °C for 24 h. E. coli growth performance was investigated by measuring the optical density at 475 nm at 0, 2, 4, 6, 8 and 24 h.
Conclusions
This paper demonstrates a facile technique to fabricate membranes from lemongrass with antibacterial property for dye removal. The lemongrass dissolved mixture membrane (LGDM), with the highest hardness and reduced modulus, demonstrated an excellent dye adsorption capacity which is comparable to its composite with graphene oxide (LGDM/GO). This was due to the rough structure of LGDM with the existence of partially dissolved lemongrass particles. With the addition of graphene oxide, composite membrane showed layered structure. This layered structure induced the decrease in hardness and reduced modulus of lemongrass dissolved mixture/graphene oxide (LGDM/GO) membrane compared with lemongrass dissolved mixture membrane (LGDM). The methylene blue adsorption on membranes fitted well with pseudo-second order and intra-particle diffusion models, where it showed that lemongrass dissolved mixture membrane (LGDM) followed both the surface adsorption and intra-particle diffusion mechanism. The antibacterial experiments also supported the hypothesis that the fabrication process would maintain the natural properties of lemongrass. In a combination with the facile fabrication technology, improved mechanical properties, good dye adsorption, antibacterial properties and easy adsorbent separation after dye adsorption, the lemongrass dissolved mixture membrane could be a promising candidate for water filtration.Conflicts of interest
There are no conflicts to declare.Acknowledgements
The current study was carried out with the support of the Deakin Advanced Characterization Facility.References
- C. J. Ogugbue and T. Sawidis, Biotechnol. Res. Int., 2011, 2011, 967925 CrossRef.
- H. B. Mansour, I. Houas, F. Montassar, K. Ghedira, D. Barillier and R. Mosrati, et al., Environ. Sci. Pollut. Res., 2012, 19(7), 2634–2643 CrossRef.
- R. O. A. de Lima, A. P. Bazo, D. M. F. Salvadori, C. M. Rech, D. de Palma Oliveira and G. de Aragão Umbuzeiro, Mutat. Res., Genet. Toxicol. Environ. Mutagen., 2007, 626(1–2), 53–60 CrossRef.
- B. Khemila, B. Merzouk, A. Chouder, R. Zidelkhir, J.-P. Leclerc and F. Lapicque, Sustainable Chem. Pharm., 2018, 7, 27–35 CrossRef.
- A. Ahmad, S. H. Mohd-Setapar, C. S. Chuong, A. Khatoon, W. A. Wani and R. Kumar, et al., RSC Adv., 2015, 5(39), 30801–30818 RSC.
- M. Visa and A.-M. Chelaru, Appl. Surf. Sci., 2014, 303, 14–22 CrossRef CAS.
- A. Salama, J. Colloid Interface Sci., 2017, 487, 348–353 CrossRef CAS PubMed.
- U. Habiba, T. A. Siddique, T. C. Joo, A. Salleh, B. C. Ang and A. M. Afifi, Carbohydr. Polym., 2017, 157, 1568–1576 CrossRef CAS.
- L. Melo, T. J. E. Bott and f science, Exp. Therm. Fluid Sci., 1997, 14(4), 375–381 CrossRef CAS.
- F. Liu, S. Chung, G. Oh and T. S. Seo, ACS Appl. Mater. Interfaces, 2012, 4(2), 922–927 CrossRef CAS PubMed.
- O. Akhavan and E. Ghaderi, ACS Nano, 2010, 4(10), 5731–5736 CrossRef CAS.
- J. A. González, M. E. Villanueva, L. L. Piehl and G. J. Copello, Chem. Eng. J., 2015, 280, 41–48 CrossRef.
- N. A. Travlou, G. Z. Kyzas, N. K. Lazaridis and E. A. Deliyanni, Chem. Eng. J., 2013, 217, 256–265 CrossRef CAS.
- L. Lee, X. Lee, P. Chia, K. Tan and S. Gan, J. Taiwan Inst. Chem. Eng., 2014, 45(4), 1764–1772 CrossRef CAS.
- G. Annadurai, R. S. Juang and D. J. Lee, J. Hazard. Mater., 2002, 92(3), 263–274 CrossRef CAS.
- R. Batmaz, N. Mohammed, M. Zaman, G. Minhas, R. M. Berry and K. C. Tam, Cellulose, 2014, 21(3), 1655–1665 CrossRef CAS.
- A. N. M. A. Haque, R. Remadevi and M. Naebe, Cellulose, 2018, 25(10), 1–23 CrossRef.
- C. E. Ekpenyong, E. Akpan and A. Nyoh, Chin. J. Nat. Med., 2015, 13(5), 321–337 CAS.
- K. Lal, R. Yadav, R. Kaur, D. Bundela, M. I. Khan and M. Chaudhary, et al., Ind. Crops Prod., 2013, 45, 270–278 CrossRef CAS.
- H. Singh and T. B. Dawa, Carbon Letters (Carbon Lett)., 2014, 15(2), 105–112 CrossRef.
- M. A. Al Faruque, R. Remadevi, X. Wang and M. Naebe, J. Powder Technol., 2019, 342, 848–855 CrossRef CAS.
- N. Sun, M. Rahman, Y. Qin, M. L. Maxim, H. Rodríguez and R. D. Rogers, Green Chem., 2009, 11(5), 646–655 RSC.
- N. D. Luong, N. Pahimanolis, U. Hippi, J. T. Korhonen, J. Ruokolainen and L.-S. Johansson, et al., J. Mater. Chem., 2011, 21(36), 13991–13998 RSC.
- C. Shao, Z. Zhu, C. Su, S. Yang and Q. Yuan, Materials, 2018, 11(9), 1727 CrossRef.
- X. Chen, S. Zhou, L. Zhang, T. You and F. J. M. Xu, Materials (Basel), 2016, 9(7), 582 CrossRef.
- Y. Hao, Y. Cui, J. Peng, N. Zhao, S. Li and M. Zhai, Carbohydr. Polym., 2019, 208, 269–275 CrossRef CAS.
- S. Y. Oh, D. I. Yoo, Y. Shin, H. C. Kim, H. Y. Kim and Y. S. Chung, et al., Carbohydr. Res., 2005, 340(15), 2376–2391 CrossRef CAS.
- D. Han, L. Yan, W. Chen, W. Li and P. Bangal, Carbohydr. Polym., 2011, 83(2), 966–972 CrossRef CAS.
- W. Ouyang, J. Sun, J. Memon, C. Wang, J. Geng and Y. Huang, Carbon, 2013, 62, 501–509 CrossRef CAS.
- Q. Wu, Y. Meng, K. Concha, S. Wang, Y. Li and L. Ma, et al., Ind. Crops Prod., 2013, 48, 28–35 CrossRef CAS.
- A. K. Kushwaha, N. Gupta and M. Chattopadhyaya, J. Saudi Chem. Soc., 2014, 18(3), 200–207 CrossRef CAS.
- F. A. Pavan, E. C. Lima, S. L. Dias and A. C. Mazzocato, J. Hazard. Mater., 2008, 150(3), 703–712 CrossRef CAS.
- S. Lagergren, Sven Vetenskapsakad Handingarl, 1898, 24, 1–39 Search PubMed.
- Y.-S. Ho and G. McKay, Process Biochem., 1999, 34(5), 451–465 CrossRef CAS.
- W. J. Weber and J. C. Morris, J. Sanit. Eng. Div., 1963, 89(2), 31–60 Search PubMed.
- M. Maizura, A. Fazilah, M. Norziah and A. Karim, J. Food Sci., 2007, 72(6), C324–C330 CrossRef CAS.
- G. O. Onawunmi, W.-A. Yisak and E. Ogunlana, J. Ethnopharmacol., 1984, 12(3), 279–286 CrossRef CAS.
- G. Shah, R. Shri, V. Panchal, N. Sharma, B. Singh and A. Mann, J. Adv. Pharm. Technol. Res., 2011, 2(1), 3 CrossRef CAS.
- N. Cai, H. Zeng, J. Fu, V. Chan, M. Chen and H. Li, et al., J. Appl. Polym. Sci., 2018, 135(19), 46238 CrossRef.
- O. Akhavan and E. Ghaderi, ACS Nano, 2010, 4(10), 5731–5736 CrossRef CAS.
- W. Hu, C. Peng, W. Luo, M. Lv, X. Li and D. Li, et al., ACS Nano, 2010, 4(7), 4317–4323 CrossRef CAS.
- D. C. Marcano, D. V. Kosynkin, J. M. Berlin, A. Sinitskii, Z. Sun and A. Slesarev, et al., ACS Nano, 2010, 4(8), 4806–4814 CrossRef CAS.
- W. C. Oliver and G. M. Pharr, J. Mater. Res., 2004, 19(1), 3–20 CrossRef CAS.
- W. C. Oliver and G. M. Pharr, J. Mater. Res., 1992, 7(6), 1564–1583 CrossRef CAS.
| This journal is © The Royal Society of Chemistry 2019 |