 Open Access Article
Luminescence and energy transfer of Tm3+ and Dy3+ co-doped Na3ScSi2O7 phosphors
Chao Weia,
Denghui Xu *a,
Zaifa Yang*b,
Yetong Jiaa,
Xiong Lia and
Jiayue Suna
aSchool of Science, Beijing Technology and Business University, Beijing 100048, PR China. E-mail: xudh@btbu.edu.cn
bCollege of Physics and Electronic Engineering, Qilu Normal University, Jinan 250200, PR China. E-mail: fazaiyang@163.com
First published on 4th September 2019
Abstract
A series of Tm3+ and Dy3+ ions single- or co-doped Na3ScSi2O7 (NSSO) phosphors were prepared by a conventional solid state reaction method. The X-ray diffraction (XRD) patterns, photoluminescence (PL) properties, fluorescence decay curve and energy transfer behavior of the samples were studied. The XRD patterns show that all the diffraction peaks of the samples are consistent with the JCPDS standard data. Under UV excitation, the singly doped NSSO phosphors with Tm3+ and Dy3+ ions show blue and yellow characteristic emission. The emission color of NSSO:Tm3+,Dy3+ can be adjusted by the corresponding Tm3+–Dy3+ energy transfer. In addition, the chromaticity coordinate of NSSO:0.04Tm3+,0.13Dy3+ is (0.3195, 0.3214), which is close to the ideal white light (0.333, 0.33). These results show that NSSO:Tm3+,Dy3+ has potential application value in white light emitting diodes (WLEDs).
1. Introduction
In recent years, white light emitting diodes (WLEDs) have aroused great interest because of their outstanding advantages, such as high luminous efficiency, energy saving ability, environmental friendliness, low manufacturing cost and so on.1–4 Thus, WLEDs have been widely used in displays, optical fibers, temperature sensors and other fields.5,6 The current WLED is formed by combining the InGaN-based blue LED chip with the yellow luminous YAG:Ce3+ phosphor.7,8 An alternative method is to use a NUV LED chip to stimulate RGB (red, blue, green) phosphors to obtain white light, which is the most popular type in the market. However, there are still some problems in the realization of white light through polyphase phosphors, such as proportion control, color absorption, color subtraction and so on.9–12 Therefore, it is very necessary to develop a new type of single-phase white light phosphor.In the trivalent rare earth ions, Dy3+ ions have blue emission (470–500 nm) and yellow emission (560–600 nm) in the visible range, which correspond to 4F9/2 → 6H15/2 and 4F9/2 → 6H13/2 transitions, respectively. The yellow emission is a sensitive transition emission, which is easily affected by the crystal field. When the Dy3+ ion is in the low symmetry position, the yellow emission will occupy the dominant position.13 However, Tm3+ ions can produce blue emission (1D2 → 3F4) and are not affected by the crystal field.14 Based on the principle of energy transfer (ET), Tm3+ and Dy3+ co-doped a single matrix can obtain a better white light. At present, a large number of Tm and Dy co-doped single-phase white light emitting phosphors have been reported. For example, YGa3(BO3)4:Tm3+,Dy3+,15 NaBi(WO4)2:Tm3+,Dy3+,16 Ba3La6(SiO4)6:Tm3+,Dy3+,17 Sr3Y(PO4)3:Tm3+,Dy3+,18 Na3Gd(PO4)2:Dy3+,Tm3+,19 NaGd(WO4)2:Tm3+,Dy3+,20 etc. In particular, silicates based luminous materials have been paid more attention because of their low synthesis temperature, stable chemical properties, simple preparation process and so on.
In this paper, Na3ScSi2O7 (NSSO) phosphors with single and co-doping of Tm3+ and Dy3+ were synthesized by traditional solid state reaction method. The crystal structure was characterized by X-ray diffraction (XRD). By adjusting the concentration ratio of Tm3+ and Dy3+, the obtained phosphor changes from blue to white under the excitation of near UV light, and then the color tunability will be achieved.
2. Experimental
2.1 Experimental procedure
A series of Na3ScSi2O7:xTm3+ (abbreviated as NSSO:xTm3+, x = 0.005–0.07), Na3ScSi2O7:yDy3+ (abbreviated as NSSO:yDy3+, y = 0.07–0.19), Na3ScSi2O7:0.04Tm3+,yDy3+ (abbreviated as NSSO:0.04Tm3+,yDy3+, y = 0.01–0.13) samples were prepared by high temperature solid state reaction. The raw materials Na2CO3 [analytical reagent (A.R.)], Sc2O3 (99.99%), SiO2 (99.99%), Dy2O3 (99.99%) and Tm2O3 (99.99%) were weighed according to the appropriate stoichiometric ratio and mixed into agate mortar. Then it was calcined at 1250 °C for 6 h in muffle furnace. Finally, the prepared samples were gradually cooled to room temperature and ground into powder for further measurement.The phase purity of NSSO:Re3+ was measured by the Bruker D2 X-ray diffractometer, using Cu-Kα radiation (λ = 0.1506 Å), and the working parameters were 30 kV, 10 mA. The surface morphology was measured by field emission scanning electron microscope (SEM, Hitachi, S-4800, Japan) with additional energy dispersive spectrum (EDS). The photoluminescence spectra were measured via Hitachi F7000 spectrophotometer with 150 W xenon lamp. Using 370 nm pulse laser radiation as the excitation light source, the fluorescence decay curves of the sample were measured by a spectrophotometer (HORIBA, JOBIN YVON FL 3-21).
3. Results and discussion
3.1 Crystal structure of samples
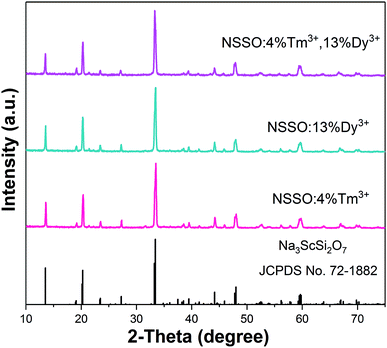
The phase purity of single doping and co-doping samples was analyzed by XRD diffraction. Because the XRD patterns of the obtained samples are similar, representative samples are selected to be displayed in the figure. Fig. 1 shows the XRD diagrams of NSSO:0.04Tm3+, NSSO:0.13Dy3+ and NSSO:0.04Tm3+,0.13Dy3+ samples. The results show that the XRD patterns of all samples are in good agreement with the standard PDF card (JCPDS no. 72-1882), indicating that the activated Tm3+ and Dy3+ ions have no significant effect on the crystal structure of NSSO.Fig. 2(a) and (b) represent SEM images of representative samples NSSO:0.04Tm3+,0.13Dy3+ phosphor. The obtained micrographs show that the particle size is mainly distributed in the range of 1–2 μm. The EDS spectrum and element mapping image of the typical sample are shown in Fig. 2(c–i). The EDS spectrum shows that sodium (Na), scandium (Sc), silicate (Si), oxygen (O), thorium (Tm) and erbium (Dy) are found in NSSO phosphors. The element mapping images show that all elements are evenly distributed in the NSSO host.
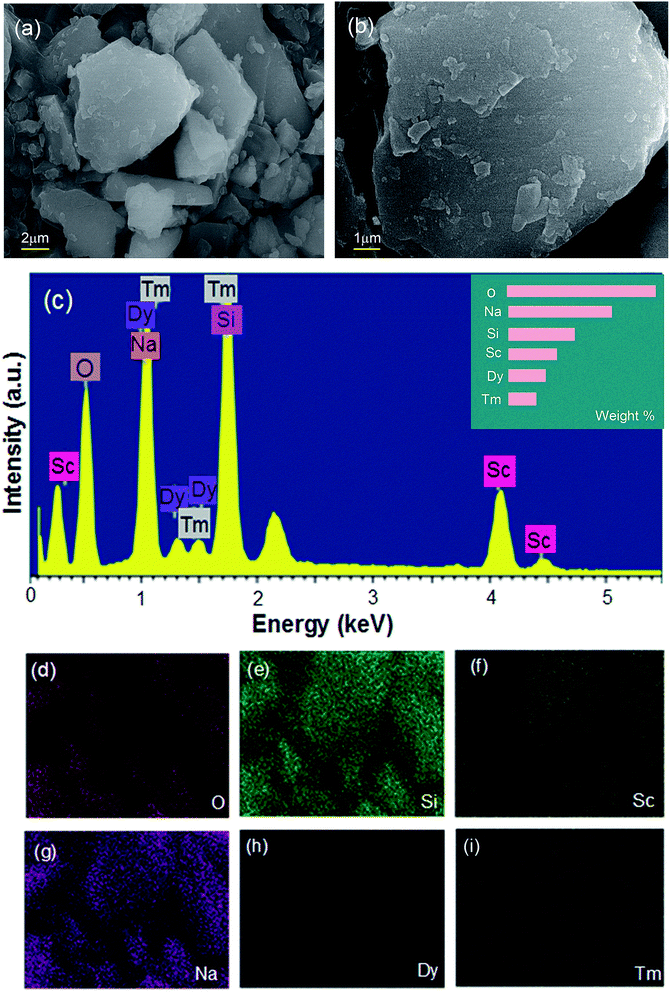 | ||
| Fig. 2 (a) and (b) present SEM images of a typical NSSO:0.04Tm3+,0.13Dy3+ phosphor, (c) EDS spectrum of the obtained sample, (d–i) elemental mapping images. | ||
3.2 PL properties of NSSO:xTm3+
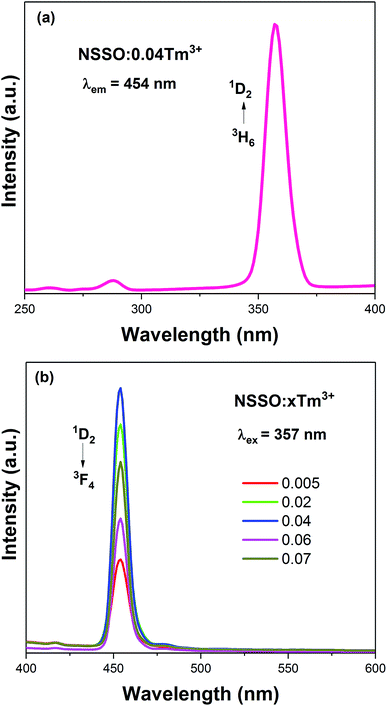
Fig. 3 shows the PL excitation (PLE) and PL spectra of NSSO:xTm3+ samples. Under the monitoring of 454 nm, the PLE spectrum of the sample has a strong excitation peak at 357 nm, which belongs to the 3H6 → 1D2 electron transition of Tm3+ [Fig. 3(a)]. When the excitation wavelength is 357 nm, the bright blue emission is observed at 454 nm, which is due to the 1D2 → 3F4 transition of Tm3+ ion.21,22 In addition, Fig. 3(b) shows the PL spectra of samples with different Tm3+ concentrations. It can be found that the spectral curve and position have no obvious change, only the PL intensity has changed. With the increase of Tm3+ ion content, the intensity of PL increases gradually. When x is 0.004, the intensity of PL reaches the maximum, and then the intensity of PL decreases gradually. Therefore, x = 0.04 is selected as the fixed doping amount of Tm3+ and Dy3+ ion co-doped phosphors.3.3 PL properties of NSSO:yDy3+
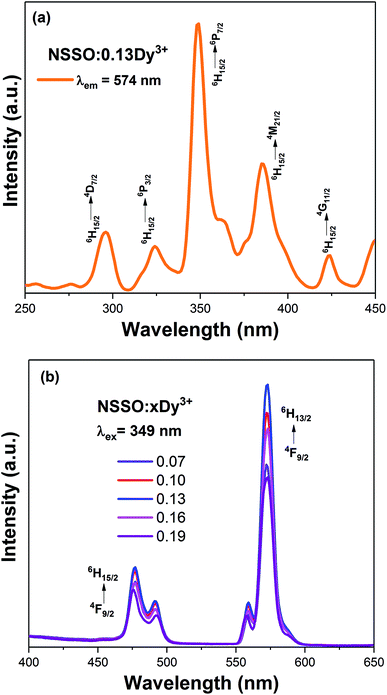
Fig. 4(a) shows the PL excitation spectra of NSSO:0.13Dy3+ phosphor monitored by 574 nm. The excitation spectra have a series of sharp absorption peaks at 296, 324, 349, 385 and 424 nm, which correspond to the f–f transitions of Dy3+ from the ground state 6H15/2 to the excited states 4D7/2, 6P3/2, 6P7/2, 4M21/2 and 4G11/2, respectively. From the excitation spectrum, the excitation band at 349 nm (6H15/2 → 6P7/2) has the strongest absorption, indicating that the phosphor prepared by us is in good agreement with the wavelength of commercial NUV-LED chip (300–410 nm).Fig. 4(b) depicts the PL spectra of single-doped NSSO with different Dy3+ ion concentrations excited at 349 nm. The PL spectra of the obtained phosphors have two obvious emission peaks at 477 nm (blue) and 574 nm (yellow), which are attributed to 4F9/2 → 6H15/2 and 4F9/2 → 6H13/2 transitions. The characteristic 4F9/2 → 6H15/2 transition originates from the magnetic dipole (MD) transition, while the other 4F9/2 → 6H13/2 transition originates from the electric dipole (ED) transition.23,24 The ED transition is allergic and strongly influenced by the surrounding environment, while the MD transition is not sensitive to the crystal field.25,26 In the NSSO host lattice, the yellow emission is much stronger than the blue emission, which indicates that the Dy3+ ion occupies a non-inversion symmetry site (low symmetry site). In addition, except for the intensity, the shape and characteristic peak position of the PL spectrum have not changed. With the increase of Dy3+ doping content, the luminous intensity increases at first. When the Dy3+ doping concentration exceeds 0.13, the luminous intensity decreases gradually due to the concentration quenching.
3.4 PL properties of NSSO:0.04Tm3+,yDy3+
Fig. 5(a) exhibits the excitation spectra of NSSO:0.13Dy3+ monitored by 574 nm and the emission spectra of NSSO:0.04Tm3+ excited by 357 nm. As shown in Fig. 5(a), there is an overlap between the excitation spectra of Dy3+ and the emission spectra of Tm3+ ions near the 454 nm, which proves that there is a possibility of energy transfer from Tm3+ to Dy3+ in the NSSO host.27 Fig. 5(b) shows the excitation spectra of NSSO:0.04Tm3+,0.13Dy3+ phosphor monitored by 574 nm (Dy3+) and 454 nm (Tm3+). From Fig. 5(b), it can be noticed that the excitation spectra are similar to the Tm3+ and Dy3+ ions single-doped NSSO phosphors. Under the monitoring of the characteristic emission wavelengths of 454 and 574 nm, the excitation spectra of NSSO:0.04Tm3+,0.13Dy3+ phosphor shows overlapping bands from 350 to 370 nm. This phenomenon indicates that the NSSO samples co-doped with Dy3+ and Tm3+ ions can be effectively excited by ultraviolet light. Therefore, the emission spectra of Dy3+ and Tm3+ co-doped NSSO phosphors were measured at 365 nm. The emission spectra of NSSO:0.04Tm3+,yDy3+ (y = 0.01, 0.03, 0.06, 0.09 and 0.13) excited by 365 nm are shown in Fig. 5(c). With the increase of Dy3+ concentration from 0.001 to 0.13, the blue light emission intensity of Tm3+ ion decreases monotonously around 454 nm, while the blue and yellow light emission intensity of Dy3+ ion increases gradually. The trend of emission intensity can be clearly seen in the inset of Fig. 5(c). This result confirms the existence of energy transfer from Tm3+ ion to Dy3+ ion.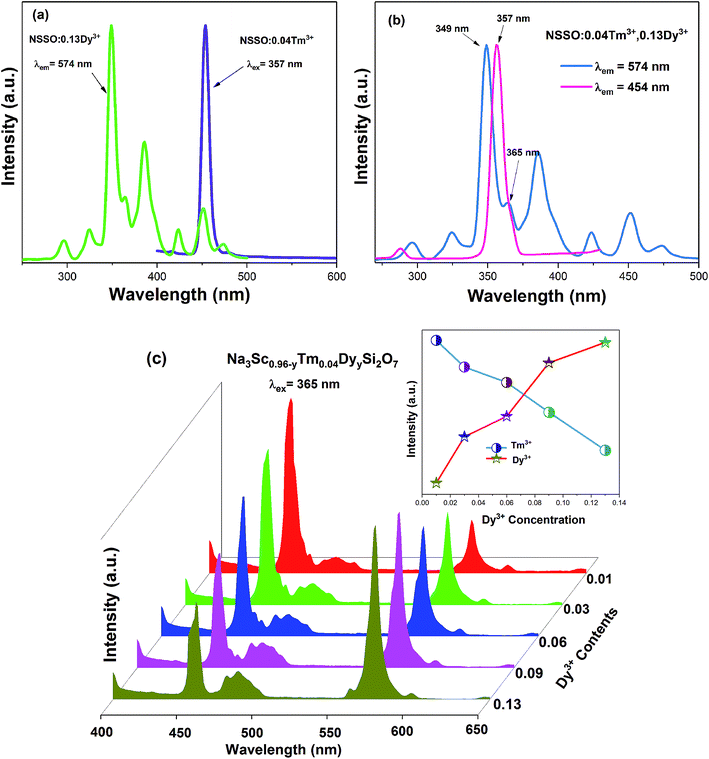 | ||
| Fig. 5 (a) Emission spectra of NSSO:xTm3+ and excitation spectra of NSSO:yDy3+, (b) excitation spectra of NSSO:0.04Tm3+,yDy3+, (c) emission spectrum of NSSO:0.04Tm3+,yDy3+. | ||
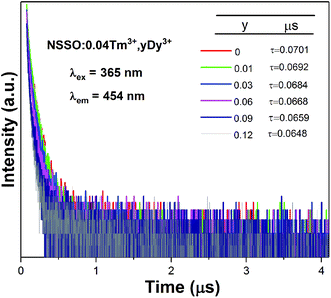
In order to further explain the energy transfer from Tm3+ ion to Dy3+ ion. Fig. 6 displays the PL decay curve of NSSO:0.04Tm3+,yDy3+ phosphors excited by 365 nm. The corresponding luminescence decay curves are recorded by a single exponential function of I(τ) = A![[thin space (1/6-em)]](https://www.rsc.org/images/entities/char_2009.gif) exp(−t/τ) + I0. Here, τ is the decay lifetime, and I0 and I(τ) represent the luminous intensity at 0 and t, respectively. Using the above equation, it is calculated that the lifetime values of NSSO:0.04Tm3+,yDy3+ (y = 0, 0.01, 0.03, 0.06, 0.09 and 0.13) phosphors are 0.0701, 0.0692, 0.0684, 0.0668, 0.0659 and 0.0648 μs, respectively. With the increase of Dy3+ ion concentration, the lifetime value of Tm3+ decreases gradually, which proves once again the energy transfer from Tm3+ to Dy3+.
exp(−t/τ) + I0. Here, τ is the decay lifetime, and I0 and I(τ) represent the luminous intensity at 0 and t, respectively. Using the above equation, it is calculated that the lifetime values of NSSO:0.04Tm3+,yDy3+ (y = 0, 0.01, 0.03, 0.06, 0.09 and 0.13) phosphors are 0.0701, 0.0692, 0.0684, 0.0668, 0.0659 and 0.0648 μs, respectively. With the increase of Dy3+ ion concentration, the lifetime value of Tm3+ decreases gradually, which proves once again the energy transfer from Tm3+ to Dy3+.
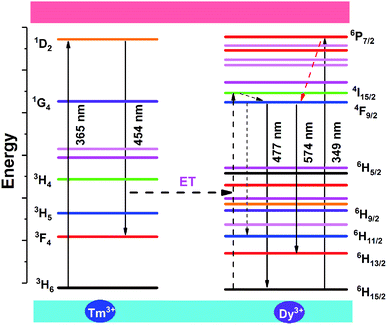
Fig. 7 shows the energy level diagram of the energy transfer process between Tm3+ and Dy3+ ions and the possible luminous paths in the NSSO host. At 365 nm excitation, the Tm3+ ion absorbs energy and excites the ground state electrons from the 3H6 state to the 1D2 state. Because the excitation spectra of Dy3+ overlap with the emission spectra of Tm3+ ions around 454 nm, the 1D2(Tm3+) + 6H15/2(Dy3+) → 3F4(Tm3+) + 4I15/2(Dy3+) may occur. Due to the non-radiative transition, the excited electrons relax to a lower energy level 4F9/2. Then, the characteristic emission at 477 nm and 574 nm corresponding to 4F9/2 → 6HJ (J = 15/2, 13/2) occurs through the radiative transition.
Fig. 8(a) shows the emission spectra of NSSO:0.04Tm3+,0.13Dy3+ phosphor in the temperature range of 298 K to 498 K. With the increase of temperature, the emission intensity of Tm3+ and Dy3+ ions decreases obviously. The relationship between the relative intensity of Tm3+ and Dy3+ and temperature is presented in Fig. 8(b). As shown in the figure, the intensity of Tm3+ and Dy3+ at 423 K is still 80% and 83% compared with the initial value. In this regard, the optimized NSSO:Tm3+,Dy3+ phosphors have better thermal stability than the previously reported Tm and Dy co-doped silicate material.17
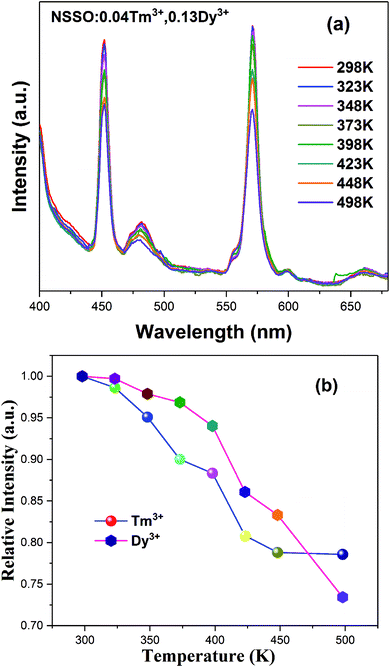 | ||
| Fig. 8 (a) PL spectra of NSSO:0.04Tm3+,0.13Dy3+ phosphor with different temperature from 298 K to 498 K, (b) the relative emission intensity with various temperature. | ||
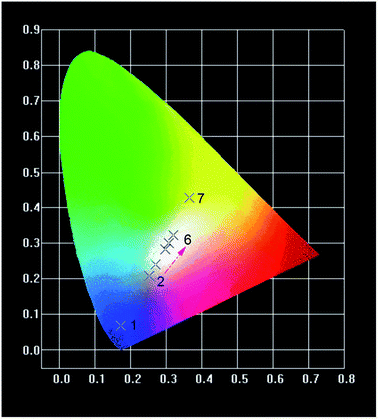
The chromaticity coordinates of CIE are calculated by CIE software. The CIE chromaticity diagram of NSSO:0.04Tm3+, NSSO:0.13Dy3+ and NSSO:0.04Tm3+,yDy3+ (y = 0, 0.01, 0.03, 0.06, 0.09 and 0.13) phosphors are presented in Fig. 9, and the results are shown in Table 1. The color coordinates of Tm3+ and Dy3+ single doping NSSO samples are (0.1733, 0.0628) and (0.3195, 0.3214), respectively, which are located in yellow-white (point 1) and purple-blue region (point 7). For Dy3+ and Tm3+ co-doped NSSO phosphors, the CIE coordinates almost linearly moved from point 2 (0.2531, 0.2073) to point 6 (0.3195, 0.3214). In the obtained CIE coordinates, (0.3195, 0.3214) is quite close to the standard white light (0.333, 0.33). In addition, the correlation temperature (CCT) of the samples is calculated according to the CIE coordinates. The CCT is calculated by using the following McCamy empirical formula:
| CCT = 449n3 + 3525n2 + 6823n + 5520.33 |
| No. | Samples | CIE x | CIE y |
|---|---|---|---|
| 1 | 0.04Tm3+ | 0.1733 | 0.0682 |
| 2 | 0.04Tm3+/0.01Dy3+ | 0.2531 | 0.2073 |
| 3 | 0.04Tm3+/0.03Dy3+ | 0.2712 | 0.2411 |
| 4 | 0.04Tm3+/0.06Dy3+ | 0.2964 | 0.2813 |
| 5 | 0.04Tm3+/0.09Dy3+ | 0.3069 | 0.2995 |
| 6 | 0.04Tm3+/0.13Dy3+ | 0.3195 | 0.3214 |
| 7 | 0.13Dy3+ | 0.3661 | 0.428 |
4. Conclusion
To sum up, Tm3+ and Dy3+ ions single-doping and co-doping NSSO phosphors have been successfully synthesized by the traditional solid-state method. The results of XRD pattern analysis show that the phases of the synthesized samples are pure phase, and the single doping and co-doping of Tm3+ and Dy3+ ions have little effect on the crystal structure of NSSO phosphors. The NSSO:xTm3+ phosphors showed an intense blue emission (1D2 → 3F4) under excitation at 357 nm. Upon the excitation at 349 nm, the NSSO:yDy3+ phosphors displayed yellowish white emission. The ideal white light can be produced by properly combining Tm3+ and Dy3+ ions. Indeed, NSSO:0.04Tm3+,yDy3+ phosphors change almost linearly from blue to white when excited by 365 nm. In addition, the CIE coordinate of NSSO:0.04Tm3+,0.13Dy3+ (0.3195, 0.3214) is quite close to the coordinate of ideal white light (0.333, 0.33). The preliminary study on the co-doping of NSSO with Tm3+ and Dy3+ ions shows that the synthesized single-phase white light phosphor has a potential application prospect in solid state lighting.Conflicts of interest
There are no conflicts to declare.Acknowledgements
This work is supported by National Natural Science Foundation of China (No. 21576002 and 61705003) and Beijing Technology and Business University Research Team Construction Project (No. 19005902016).References
- B. B. Su, H. D. Xie, Y. R. Tan, Y. J. Zhao, Q. C. Yang and S. J. Zhang, Luminescent properties, energy transfer, and thermal stability of double perovskites La2MgTiO6:Sm3+, Eu3+, J. Lumin., 2018, 204, 457–463 CrossRef CAS.
- K. Jha and M. Jayasimhadri, Effective sensitization of Eu3+ and energy transfer in Sm3+/Eu3+ co-doped ZPBT glasses for CuPc based solar cell and w-LED applications, J. Lumin., 2018, 194, 102–107 CrossRef CAS.
- Y. Gan, W. Liu, W. T. Zhang, W. J. Li, Y. Huang and K. H. Qiu, Effects of Gd3+ codoping on the enhancement of the luminescent properties of a NaBi(MoO4)2:Eu3+ red-emitting phosphors, J. Alloys Compd., 2019, 784, 1003–1010 CrossRef CAS.
- Z. W. Gao, P. F. Sun, Y. F. Zhong, R. J. Yu and B. Deng, Eu3+-doped highly thermal-stable barium yttrium aluminate as a red emitting phosphor for UV based white LED, Opt. Laser Technol., 2019, 111, 163–168 CrossRef CAS.
- R. P. Cao, T. Chen, Y. C. Ren, C. X. Liao, Z. Y. Luo, Y. X. Ye and Y. M. Guo, Tunable emission of LiCa3MgV3O12:Bi3+ via energy transfer and changing excitation wavelength, Mater. Res. Bull., 2019, 111, 87–92 CrossRef CAS.
- F. W. Mo, Z. Z. Lu and L. Y. Zhou, Synthesis and luminescence properties of Mn4+-activated Ba2LaSbO6 deep-red phosphor, J. Lumin., 2019, 205, 393–399 CrossRef CAS.
- X. Y. Fu, S. H. Zheng, Y. N. Liu and H. W. Zhang, Yellow phosphors Ba2Mg(PO4)2:Eu2+ fit for white light-emitting diodes prepared with sol-gel precursor route, J. Lumin., 2019, 206, 120–124 CrossRef CAS.
- F. B. Xiong, S. X. Liu, H. F. Lin, X. G. Meng, S. Y. Lian and W. Z. Zhu, A novel white-light-emission phosphor Dy3+-doped CaLaB7O13 under UV excitation, Opt. Laser Technol., 2018, 106, 29–33 CrossRef CAS.
- D. Yang, L. B. Liao, Q. F. Guo, L. J. Wang, L. F. Mei, H. K. Liu and T. S. Zhou, A novel phosphor of Eu3+-activated Na3GaF6: synthesis, structure, and luminescence properties, J. Lumin., 2018, 203, 391–395 CrossRef CAS.
- Y. T. Li and X. H. Liu, Energy transfer and luminescence properties of Ba2CaMoO6:Eu3+ phosphors prepared by sol–gel method, Opt. Mater., 2015, 42, 303–308 CrossRef CAS.
- Y. T. Li and X. H. Liu, Structure and luminescence properties of Ba3WO6:Eu3+ nanowire phosphors obtained by conventional solid-state reaction method, Opt. Mater., 2014, 38, 211–216 CrossRef CAS.
- R. P. Cao, X. Liu, K. L. Bai, T. Chen, S. L. Guo, Z. F. Hu, F. Xiao and Z. Y. Luo, Photoluminescence properties of red-emitting Li2ZnSn2O6:Mn4+ phosphor for solid-state lighting, J. Lumin., 2018, 197, 169–174 CrossRef CAS.
- J. Gou, J. Y. Fan, M. Luo, S. N. Zuo, B. X. Yu, S. Z. F. Liu and H. Y. Jiao, Investigation of the mechanism responsible for the photoluminescence enhancement with Li+ co-doping in highly thermally stable white emitting Sr8ZnSc(PO4)7:Dy3+ phosphor, J. Lumin., 2017, 187, 160–168 CrossRef CAS.
- X. L. Wu, W. N. Bai, O. Hai, Q. Ren, J. L. Zheng and Y. H. Ren, Tunable color of Tb3+/Eu3+/Tm3+-coactivated K3La(PO4)2 via energy transfer: a single-phase white-emitting phosphor, Opt. Laser Technol., 2019, 115, 176–185 CrossRef CAS.
- C. Yin, R. Wang, P. F. Jiang, R. H. Cong and T. Yang, Dy3+ and Tm3+ doped YGa3(BO3)4 for near ultraviolet excited white phosphors, J. Solid State Chem., 2019, 269, 30–35 CrossRef CAS.
- J. H. Huang, W. X. You, G. L. Gong, G. J. Liu, P. F. Liu and B. Wang, Electronic structure and photoluminescence of Dy3+ single-doped and Dy3+/Tm3+ co-doped NaBi(WO4)2 phosphors, Opt. Mater., 2019, 88, 534–539 CrossRef CAS.
- H. Patnam, Sk. Khaja Hussain, L. Krishna Bharat and J. S. Yu, Near-ultraviolet excited Tm3+ and Dy3+ ions co-doped barium lanthanum silica oxide phosphors for white-light applications, J. Alloys Compd., 2019, 780, 846–855 CrossRef CAS.
- J. Y. Wang, J. B. Wang and P. Duan, Luminescence and energy transfer of Tm3+ or/and Dy3+ co-doped in Sr3Y(PO4)3 phosphors with UV excitation for WLEDs, J. Lumin., 2014, 145, 1–5 CrossRef CAS.
- B. C. Jamalaiah, M. Jo, J. Z. Han, J. J. Shim, S. Kim, W. Y. Chung and H. J. Seo, Luminescence, energy transfer and color perception studies of Na3Gd(PO4)2:Dy3+:Tm3+ phosphors, Opt. Mater., 2014, 36, 1688–1693 CrossRef CAS.
- A. Durairajan, D. Balaji, K. K. Rasu, S. M. Babu, Y. Hayakawa and M. A. Valente, Sol–gel synthesis and photoluminescence studies on colour tuneable Dy3+/Tm3+ co-doped NaGd(WO4)2 phosphor for white light emission, J. Lumin., 2015, 157, 357–364 CrossRef CAS.
- C. Jin and J. Zhang, Upconversion luminescence of Ca2Gd8(SiO4)6O2:Yb3+-Tm3+-Tb3+/Eu3+ phosphors for optical temperature sensing, Opt. Laser Technol., 2019, 115, 487–492 CrossRef CAS.
- B. Fan, J. Liu, W. Y. Zhao and S. M. Qi, Luminescence and energy transfer of a single-phased phosphor Y2GeO5:Bi3+, Tm3+, Tb3+, Eu3+ for white UV LEDs, Opt. Mater., 2019, 90, 33–39 CrossRef CAS.
- J. Y. Wang, Y. Feng, R. D. Li and H. M. Liu, Luminescence and energy transfer properties of single-component Mg0.5Ti2(PO4)3:Dy3+, Eu3+ for warm white UV LEDs, J. Alloys Compd., 2017, 702, 120–125 CrossRef CAS.
- H. X. Liu and Z. Y. Guo, Ce3+ and Dy3+ doped Sr3B2O6: solid state synthesis and tunable luminescence, J. Lumin., 2017, 187, 181–185 CrossRef CAS.
- M. Liao, Z. F. Mu, S. A. Zhang, F. G. Wu, Z. G. Nie, Z. Q. Zheng, X. Feng, Q. T. Zhang, J. Q. Feng and D. Y. Zhu, A red phosphor Mg3Y2Ge3O12:Bi3+, Eu3+ with high brightness and excellent thermal stability of luminescence for white light-emitting diodes, J. Lumin., 2019, 210, 202–209 CrossRef CAS.
- Y. H. Jiao, X. L. Wu, Q. Ren, O. Hai, F. Lin and W. N. Bai, Photoluminescence and energy transfer of a color tunable phosphors: Sr3La(BO3)3:Ln3+ (Ln = Dy, Eu, Tb) for warm white light UV-excited WLEDs, Opt. Laser Technol., 2019, 109, 470–479 CrossRef CAS.
- G. M. Cai, N. Yang, H. X. Liu, J. Y. Si and Y. Q. Zhang, Single-phased and color tunable LiSrBO3:Dy3+, Tm3+, Eu3+ phosphors for white-light-emitting application, J. Lumin., 2017, 187, 211–220 CrossRef CAS.
| This journal is © The Royal Society of Chemistry 2019 |

