
 Open Access Article
 This Open Access Article is licensed under a Creative Commons Attribution-Non Commercial 3.0 Unported Licence
A novel forced separation method for the preparation of paraffin with excellent phase changes
Gang
Bai
a,
Qinzhen
Fan
*b,
Jianfeng
Sun
c,
Lihua
Cheng
b and
Xi-Ming
Song
 *a
*a
aLiaoning Key Laboratory for Green Synthesis and Preparative Chemistry of Advanced Materials, College of Chemistry, Liaoning University, Shenyang, 110036, China. E-mail: songlab@lnu.edu.cn; Fax: +86-24-62202378; Tel: +86-24-62202380
bCollege of Chemical Engineering, Guangdong University of Petrochemical Technology, Maoming 525000, P. R. China. E-mail: fanqinzhen@163.com; Fax: +86-0668-2873904; Tel: +86-13790909217
cFushun Research Institute of Petroleum and Petrochemical, Fushun 113001, P. R. China
First published on 25th September 2019
Abstract
A novel forced separation method based on driving force vacuum sweating was used to prepare high melting point paraffin with high phase-change enthalpies. The effects of the vacuum pressure and final separation temperature on the forced separation of the paraffin components were investigated. The research results showed that the optimal vacuum pressure for forced separation was 80.0 kPa. The performance of forced separation was improved with the increase in the final temperature. Increasing the final temperature increased the driving force of the separation of solid-state components and liquid components during sweating, which improved the product yield, shortened the production cycle, and reduced the oil content. The phase changes exhibited by the separation products were tested at 70 °C under optimal conditions. The raw materials and forced separation products were analyzed through Fourier transform infrared spectroscopy analysis (FT-IR), gas chromatography analysis (GC), differential scanning calorimetry analysis (DSC), and X-ray diffraction analysis (XRD). The results of these analyses showed that as the forced separation temperature was increased, the carbon atom number distribution range of the products narrowed, and the content of n-paraffin was drastically improved. The content of n-paraffin in the final fraction obtained through the forced separation of paraffin was 89.8% with a phase-transition temperature of 69.74 °C and a phase-transition enthalpy of 214.71 J g−1. A significant solid–solid phase transition peak was observed in the final fraction obtained through the forced separation of paraffin, which verified that paraffin was an excellent phase-change material for energy storage.
1. Introduction
The utilization of thermal energy by phase-change materials (PCMs) has been of great convenience the daily lives of humans by charging and discharging their great latent heat during the process of phase transition. Paraffin, which mainly consists of various hydrocarbon substances, typically has a linear structure with the universal formula CnH2n+2, with melting points ranging from approximately −125 °C to 100 °C depending on the chain lengths. Paraffin wax is one of most widely used phase-change materials (PCMs) with the advantages of stable chemical properties, consistent properties, nontoxicity, corrosion resistance, high heat of fusion, negligible super cooling, self-nucleation, absence of phase segregation, and a tunable phase change temperature.1,2 Therefore, it is widely used in solar thermal utilization, industrial waste heating, clothing, and construction.3–9 Seitz et al.,10 for example, recently reported a novel PCM with the use of PAA and PAH as electrostatically interacting shell materials for energy storage applications, which could be expanded for use with various paraffin-type PCMs.However, there were many problems with the reported paraffin products, including a wide carbon atom distribution and low n-paraffin composition. Therefore, paraffin had difficulty in satisfying the demands of phase-change materials due to its high enthalpy during the solid–liquid phase transition, which limited its applications in thermal energy storage and industry applications.
The main methods used for paraffin production include molecular sieve dewaxing,11 urea dewaxing,12 molecular distillation,13 the solvent method,14 and sweating.15,16 Molecular sieve dewaxing and urea dewaxing are unsuitable for the production of PCMs with high melting points. Distillation, which involves separating different hydrocarbon substances in accordance with their different boiling points, requires a high number of tower plates for precise separation with increased pressure drops. Distillation is unsuitable for the production of paraffin due to the hydrocarbons forming solid paraffins and an oily fraction with higher average molecular weight petroleum distillates.
The solvent method, which separates normal paraffin and other hydrocarbon substances on the basis of their different solubilities in certain solvents, is unsuitable for the production of paraffin with high enthalpy performance because it has a negligible effect on narrowing the range of the carbon atom number distribution. The sweating method, which separates and purifies the various components in the raw materials on the basis of their different melting points, is a technically simple and environmentally friendly process that can be conducted without the addition of a solvent. It is significantly affected by the molecular weights and structures at the melting points of paraffin, which increase with the molecular weight. However, for the same molecular weight, the melting point of n-paraffin is higher than that of the branched paraffin associated with low melting points. Therefore, the sweating method could simultaneously enrich the n-paraffin content and narrow the range of the carbon atom number distribution, which makes it suitable for the production of PCMs. However, due to the higher content of branched alkanes in the waxes with high melting points and higher viscosity, a microcrystalline crystallization behavior is exhibited in the sweating method, which hampers the separation of the oil from the solid.
This study aimed to resolve the difficulties encountered in the complete separation of n-paraffin with high melting points from liquid oil with low melting points in conventional sweating. In this paper, a novel method of forced separation was studied to overcome the disadvantages of the low product yield and long operation period in the process of conventional sweating for the preparation of excellent phase-change paraffin. In this new method, the driving force of separation was increased by the formation of negative pressure, which improved the separation rate, enhanced the separation efficiency, and shortened the production cycle. The research results could provide both a practical foundation and theoretical support for the production of phase-change paraffin with high melting points, which could also be applied in related fields.
2. Experimental section
2.1 Materials and instruments
| IBP | 10% | 30% | 50% | 70% | 90% | 95% |
|---|---|---|---|---|---|---|
| 246 °C | 394 °C | 407 °C | 416 °C | 422 °C | 434 °C | 451 °C |
| Paraffin wax | Value |
|---|---|
| Melting point (°C) | 64.3 |
| Oil content (%) | 0.21 |
| Saybolt color (Grade) | +30 |
| Light stability (Grade) | 4 |
| Needle penetration (1/10 mm at 25 °C) | 15 |
| Kinematic viscosity (mm2 s−1 at 100 °C) | 5.421 |
| Order (Grade) | 1 |
2.2 Instruments and equipment
The paraffin decompression and sweating forced separation device is illustrated in Fig. 1.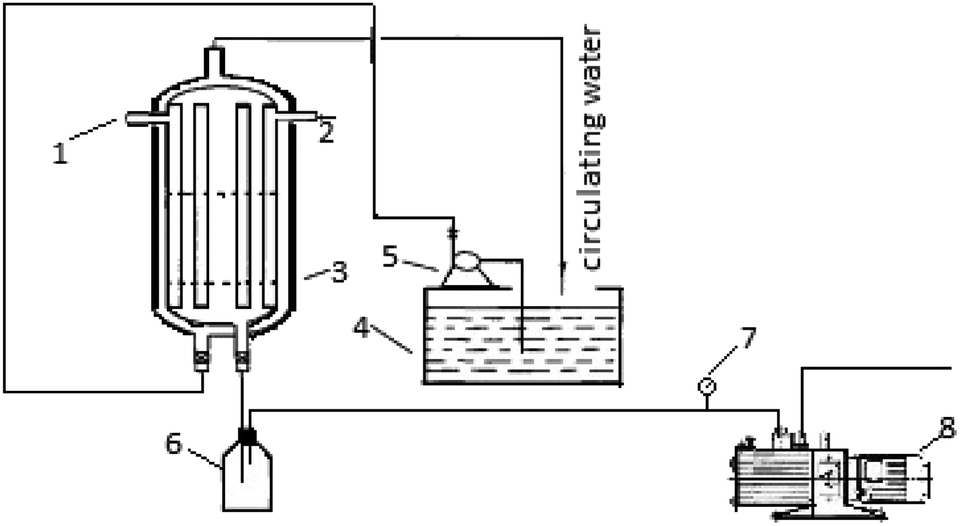 | ||
| Fig. 1 Schematic of forced separation through the vacuum sweating method. 1 – Blow vent, 2 – feed inlet, 3 – sweating tank, 4 – constant temperature water bath, 5 – pump, 6 – glass jar for product, 7 – vacuum pressure gauge, 8 – aspirator vacuum pump. | ||
2.3 Basic theory of the sweating process
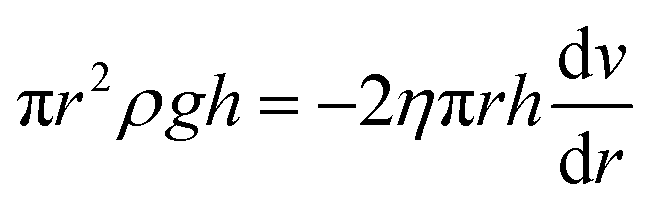
Sweating is the separation of hydrocarbon substances with different melting points. It mainly involves two steps: cold oil processing and sweating. The molten raw material is cooled slowly during cold oil processing. Various components undergo successive crystallization on the basis of their melting points, from high to low, and form a fibrous structure with numerous voids that are filled with liquid components. During sweating, the liquid components gradually leach out of the paraffin crystal voids as the temperature is increased, and a PCM with a high melting point is obtained in the form of a wax layer residue as the final product.In this work, gravity was ignored, and the liquid was set to flow in a vertical tube with a tube radius of R and height of h during sweating. The upper pressure was P1, the lower pressure was P2, and P1 > P2, as shown in Fig. 2.
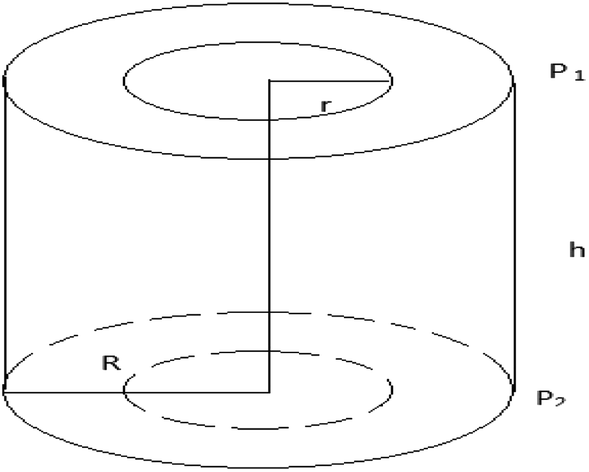 | ||
| Fig. 2 Schematic of the vacuumed sweating model. | ||
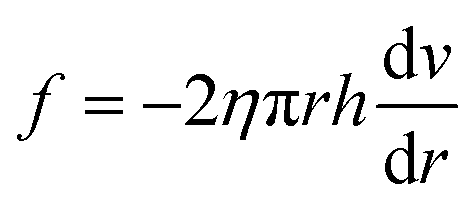
A cylindrical fluid with a tube coaxial radius of R was taken to calculate the pressure difference (ΔF) and the friction (f) from the following equations:
| ΔF = (P1 − P2)πr2 | (1) |
 | (2) |
As the two forces were equal in a stable fluid, the following equation is obtained:
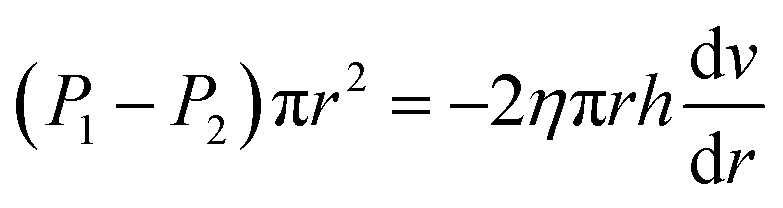 | (3) |
 | (4) |
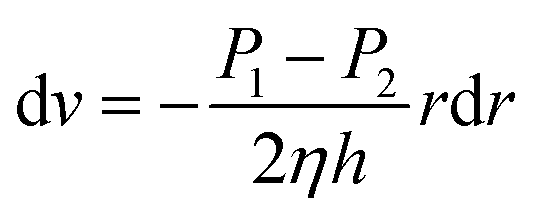
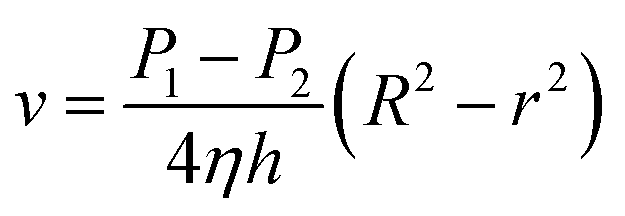
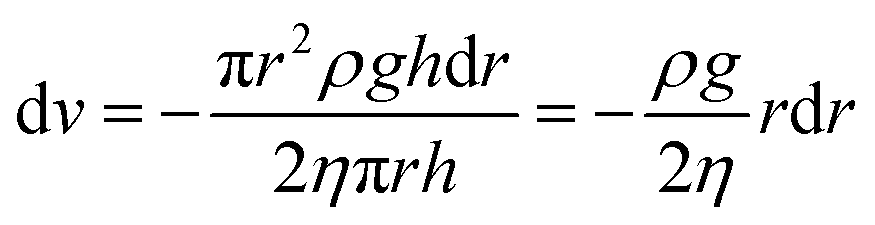
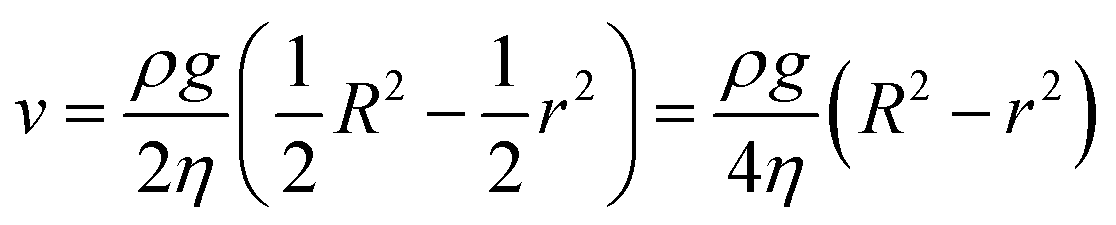
Given that r = R, v = 0, the flow rate was v when the radius was r, and we can get the following equation through the integration of both sides:
 | (5) |
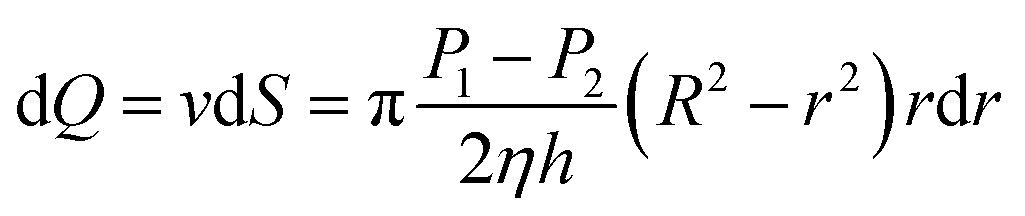
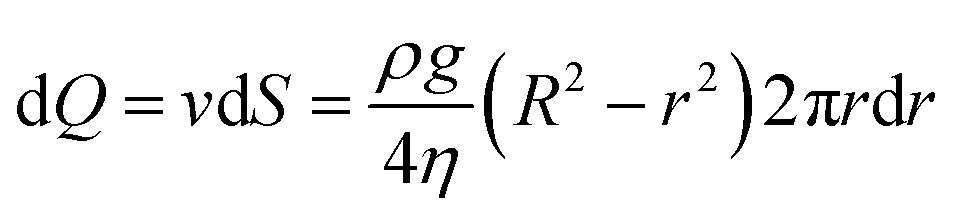
A tubular flow layer with a radius of r and a thickness of dr was taken for analysis, and the cross-sectional area of the flow layer was dS = 2πrdr, therefore we could get the following equation:
 | (6) |
The general flow eqn (6) can be expressed as:
 | (7) |
Only considering the effect of gravity, the equation of the pressure difference could be rewritten as:
| ΔF = mg = πr2ρgh | (8) |
As ΔF = f, the following equation is obtained:
 | (9) |
 | (10) |
Through integration, eqn (10) can be rewritten as:
 | (11) |
| dS = 2πrdr | (12) |
 | (13) |
The performance of the volume of paraffin is calculated by the following equation:
 | (14) |
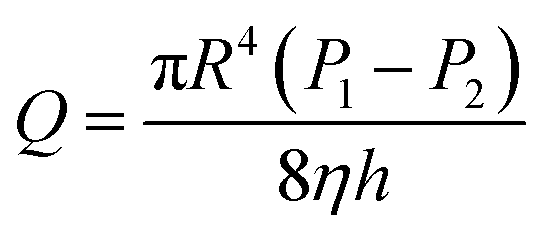
The equation for the volume of paraffin that flows out per unit time during the vacuum sweating is obtained by simultaneously integrating eqn (7) and (14)
 | (15) |
 can be considered as a fixed value.
The separating efficiency (SE) is defined as the following:
 | (16) |
Eqn (15) shows that ΔP can be easily adjusted during vacuum sweating, and large ΔP values reflect that high volumes of liquid flow out per unit time. In conventional sweating, P1 = P2, that is, ΔP = 0. The formation of negative pressure in the lower part of the paraffin layer during sweating can increase ΔP, that is, increasing the driving force of the flow out of the liquid component during vacuum sweating improves the efficiency and the effect of the sweating (Fig. 3).
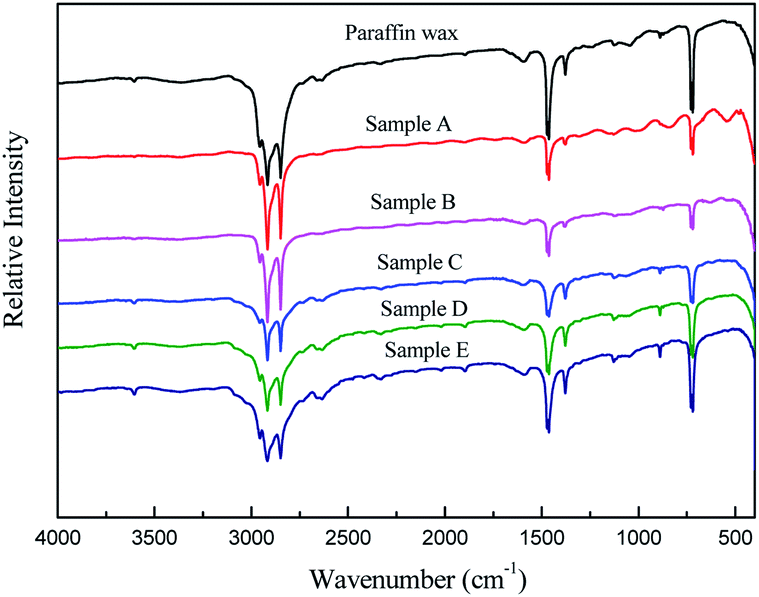 | ||
| Fig. 3 Infrared spectra of the fractions obtained through the forced separation of paraffin. | ||
2.4 Experimental process
The conventional sweating process mainly consists of the following steps:(1) The lower space of the dish plate of sweat device is filled with water. (2) Liquid raw material is then loaded into the sweating device after being heated to the melting point. (3) The raw material is cooled to a pre-set temperature at a rate of 4.0 ± 0.5 °C h−1. (4) The insulating water is released. The raw material is heated to the pre-set sweating final temperature at a warming rate of 1.0 ± 0.5 °C h−1. (5) The product is collected by continuously increasing the temperature to melt and remove the wax product. The vacuum system is activated during sweating, and the vacuum pressure is maintained in the buffer bottle to form a pressure difference up and down the paraffin layer during the forced separation sweating process.
2.5 Sample preparation
The raw materials or the forced separation products were mixed with copper powder (800 mesh) at a mass ratio of 1![[thin space (1/6-em)]](https://www.rsc.org/images/entities/char_2009.gif) :3 and evenly loaded into the stroke test apparatus. The stroke test apparatus was first put into the constant temperature water bath with the temperature 10 ± 0.1 °C lower than the melting point of the sample to be measured, which was marked as 0% after the distance of stroke L1 was stable. Second, the constant temperature water bath was increased to a temperature 10 °C higher than the melting point of the sample to be measured at a heating rate of 1.0 ± 0.1 °C min−1, and then testing was stopped, and recorded as 100% for the distance of stroke L2. The length of the stroke L, which corresponded to each test temperature point, was converted into the relative stroke (L%), and the difference in the relative stroke between Li% of a certain temperature and Li−1% of the previous temperature was recorded as the relative travel difference ΔL%.
:3 and evenly loaded into the stroke test apparatus. The stroke test apparatus was first put into the constant temperature water bath with the temperature 10 ± 0.1 °C lower than the melting point of the sample to be measured, which was marked as 0% after the distance of stroke L1 was stable. Second, the constant temperature water bath was increased to a temperature 10 °C higher than the melting point of the sample to be measured at a heating rate of 1.0 ± 0.1 °C min−1, and then testing was stopped, and recorded as 100% for the distance of stroke L2. The length of the stroke L, which corresponded to each test temperature point, was converted into the relative stroke (L%), and the difference in the relative stroke between Li% of a certain temperature and Li−1% of the previous temperature was recorded as the relative travel difference ΔL%.
2.6 Sample characterization
Structural analysis of the composites materials was carried out on a Nicolet 6700 FT-IR spectrometer. The phase-change temperature and latent heat of the composite materials were obtained using a differential scanning calorimeter (DSC-60, Shimadzu). The DSC test temperature ranged from 20 °C to 100 °C and the rate of heating was 10 °C min−1. The X-ray diffraction (XRD) pattern was recorded on a PANalytical X'Pert PRO with a step of 0.02° using Cu Kα radiation (λ = 1.5418 Å). The paraffin composition was determined through gas chromatography (GC) using an Agilent 6890 PLUS gas chromatograph and iso-octane as a solvent at the initial column temperature of 120 °C, heating rate of 3 °C min−1, and vaporization temperature of 375 °C. C14–C40 normal paraffin was used as the standard sample. The paraffin melting point was determined on the basis of ASTM D87-09 (2018). The paraffin oil content was determined in accordance with ASTM D721-2017.3. Results and discussion
3.1 Experimental
3.1.1.1 Effect of vacuum pressure. The comparative analysis of the performances of conventional sweating and vacuum sweating under different vacuum pressures was carried out from the starting temperature of 40 °C to a final temperature of 46 °C with a heating rate of 1 °C h−1. The results are shown in Table 3.
As shown in Table 3, the vacuum pressure had little influence on the melting point of wax, but it could significantly reduce the oil content, which decreased with the increase in the vacuum degree. The maximum yield was obtained under a vacuum pressure of 80.0 kPa, but the yield decreased as the vacuum pressure further increased; this phenomenon could be explained by the fact that cracks were produced on the uneven wax layer by the excessive vacuum, which led to a lower product yield and higher melting point in the product due to the excessive local gas flow rate. Therefore, the vacuum pressure of 80.0 kPa was considered optimal in this experiment.
3.1.1.2 Effect of final temperature on forced separation. The performances of conventional sweating and forced separation sweating were compared under the vacuum pressure of 80.0 kPa with an initial sweating temperature of 40 °C at a heating rate of 1 °C h−1. The results are shown in Table 4.
| Item | I | V | VII | VIII | IX | X | XI | XII |
|---|---|---|---|---|---|---|---|---|
| a T -start and T-end are the start and end of the sweating temperatures, respectively. b Conventional sweating. | ||||||||
| T -start/°C | 40 | 40 | 40 | 40 | 40 | 40 | 40 | 40 |
| T -end/°C | 46 | 46 | 48 | 48 | 50 | 50 | 52 | 52 |
| Vacuum degree/kPa | 0b | 80.0 | 0b | 80.0 | 0b | 80.0 | 0b | 80.0 |
| Yield/% | 48.9 | 52.6 | 45.3 | 48.3 | 42.8 | 46.0 | 39.9 | 42.4 |
| Oil content/% | 6.5 | 2.75 | 4.05 | 1.49 | 3.90 | 0.95 | 2.75 | 0.53 |
| Melting point/°C | 53.8 | 53.9 | 54.6 | 54.5 | 54.6 | 54.8 | 55.2 | 55.2 |
As shown in Table 4, the oil content and the yield of the separated fractions decreased with the finial sweating temperatures for both conventional sweating and forced separation sweating, whereas the melting point increased with the temperature. Of particular concern was the wax oil content observed in experiment X for vacuum sweating, which decreased to less than 1%, whereas that observed in experiment XII significantly decreased to 0.53%. However, the wax oil content observed in experiment XI for conventional sweating remained high at 2.75% at the same final sweating temperature as experiment XII. Therefore, it was beneficial to increase the final sweating temperature for the separation of the paraffin fractions.
The comparative analysis of conventional sweating and forced separation sweating under different vacuum pressures and at different final sweating temperatures revealed that the vacuum sweating improved the yield, shortened the production cycle, and reduced the oil content, which could give a beneficial improvement for ordinary sweating. Compared with the conventional sweating, the driving force of the separation of solid-state components from liquid components could be increased by more than 30 times during the early stage of the vacuum sweating, and even by hundreds of times in the final stages with the vacuum pressure of 80.0 kPa and wax layer height of 30 cm. The forced separation method, through the improvement of conventional sweating, could discharge a large amount of oil as soon as possible in the early stage of sweating, which greatly reduced the amount of wax components dissolved in the oil, leading to the yield of vacuum sweating being higher than in conventional sweating. As shown in Table 4, compared with the conventional sweating method, the yield of the product through vacuum sweating at 80 kPa increased by 12.7% from 39.9% to 52.6% at the same production specification of 2.75% oil content for the slack wax from Daqing crude oil; whereas the final temperature of the reaction was reduced by 6 °C, and the reaction time was reduced by 50%. In the later period of sweating, it was difficult for the conventional sweating to discharge the small amount of oil adsorbed on the wax crystallization surface only through the action of gravity. However, vacuum sweating could improve the separation by forcing air through the wax layer to entrap the residual oil, thus effectively improving the separation effect.
| Initial temperature | Sample A | Sample B | Sample C | Sample D | Sample E | |
|---|---|---|---|---|---|---|
| Temperature/°C | 58.0 | <62.0 | 62.0–64.9 | 64.9–68.1 | 68.1–69.5 | >69.5 |
Based on the previous experiments, the optimal conditions were as follows: vacuum pressure of 80.0 kPa, sweating starting temperature of 60.0 °C, and heating rate of 1 °C h−1. Tests on forced sweating separation were performed under the conditions shown in Table 5. The results are shown in Table 6.
| Paraffin | Sample A | Sample B | Sample C | Sample D | Sample E | |
|---|---|---|---|---|---|---|
| Yield/% | 98.4 | 36.5 | 24.3 | 10.7 | 10.8 | 16.1 |
| Melting point/°C | 64.3 | 60.0 | 64.0 | 66.4 | 67.6 | 69.3 |
| Oil content/% | 0.46 | 0.55 | 0.24 | 0.17 | 0.11 | 0.07 |
As was known, the paraffin waxes of petroleum were crystalline below their melting point, with the size of the crystals decreasing with the increasing boiling point, which led to more oil being retained in the paraffin wax with high melting point. As is shown in Table 6, the melting point of the forced separation fraction increased significantly from 64.3 °C to 69.3 °C with the increase in the final separation temperature, while the oil content dramatically decreased from 0.46% to 0.07% with the separation efficiency improving to 84.78%. However, this was unsuitable for the production of wax products with melting points of approximately 70 °C through the conventional sweating method, which could separate the soap wax and paraffin with low melting points of 40 °C to 60 °C. The solid components (wax with a high melting point) and liquid components (wax with oil and low melting points) were difficult to completely separate through the conventional sweating process despite them being in different phases. It could be inferred from this that the range of carbon atom distribution and the content of normal paraffin in the final wax component during the late stage of conventional sweating were independent of the yield of wax products with melting points of approximately 70 °C.
3.1.3.1 Infrared spectral analysis of the products. The absence of absorption peaks above 3000 cm−1 and within the range of 1500–2800 cm−1 in the infrared spectra of the raw materials (2) and forced separation fractions indicated that they were hydrocarbon substances without unsaturated bonds and carbon heterocyclic bonds, which also proved that there were no chemical reactions occurring during the forced separation process. The absorption peaks at 2916 cm−1 and 2848 cm−1 were ascribed to the alkyl stretching vibrations of –CH2 and –CH3, respectively. The absorption peaks at 1466 cm−1 and 1378 cm−1 were due to the deformation vibration of –CH2 and –CH3, respectively. There was a good linear relationship for the methylene/methyl of paraffin with the ratio of S1460 (peak area)/A1378 (absorbance). The reduction in the methylene/methyl ratio showed that the isomerization degree of paraffin products decreased as the final temperature of forced separation increased.17–20 The absorption peak at 722 cm−1 was attributed to the in-plane oscillation of long-chain methylene. The intensity of the peak, which increased with the final temperature of the forced separation, was proportional to the length of the paraffin–(CH2)n– chain and was a quantitative index of the long-chain paraffin content.
3.1.3.2 Analysis of the carbon atom distribution. The carbon atom distribution of normal paraffin determined the quality of PCMs.21,22 As shown in Fig. 4, there was no significant change in the carbon atom distribution, most of which was concentrated between C32 and C33 in raw paraffin and the fractions from the forced separation of the paraffin products. However, compared with the raw paraffin wax, there was a significant change in the final fraction of sample E, with the total content of the C32 and C33 components increasing by 6% from 23.19% to 29.32%, which indicated that the carbon atom number distribution was drastically narrowed. Moreover, the content of n-paraffin increased by 22.06% from 67.75% in raw paraffin to 89.81% in the final fraction of sample E. Therefore, increasing the forced separation final temperature narrowed the range of carbon atom number distribution, increased the content of n-paraffin, and reduced the content of iso-paraffin, which indicated that forced sweating separation was an effective method for the preparation of paraffin with a melting point of 70 °C.
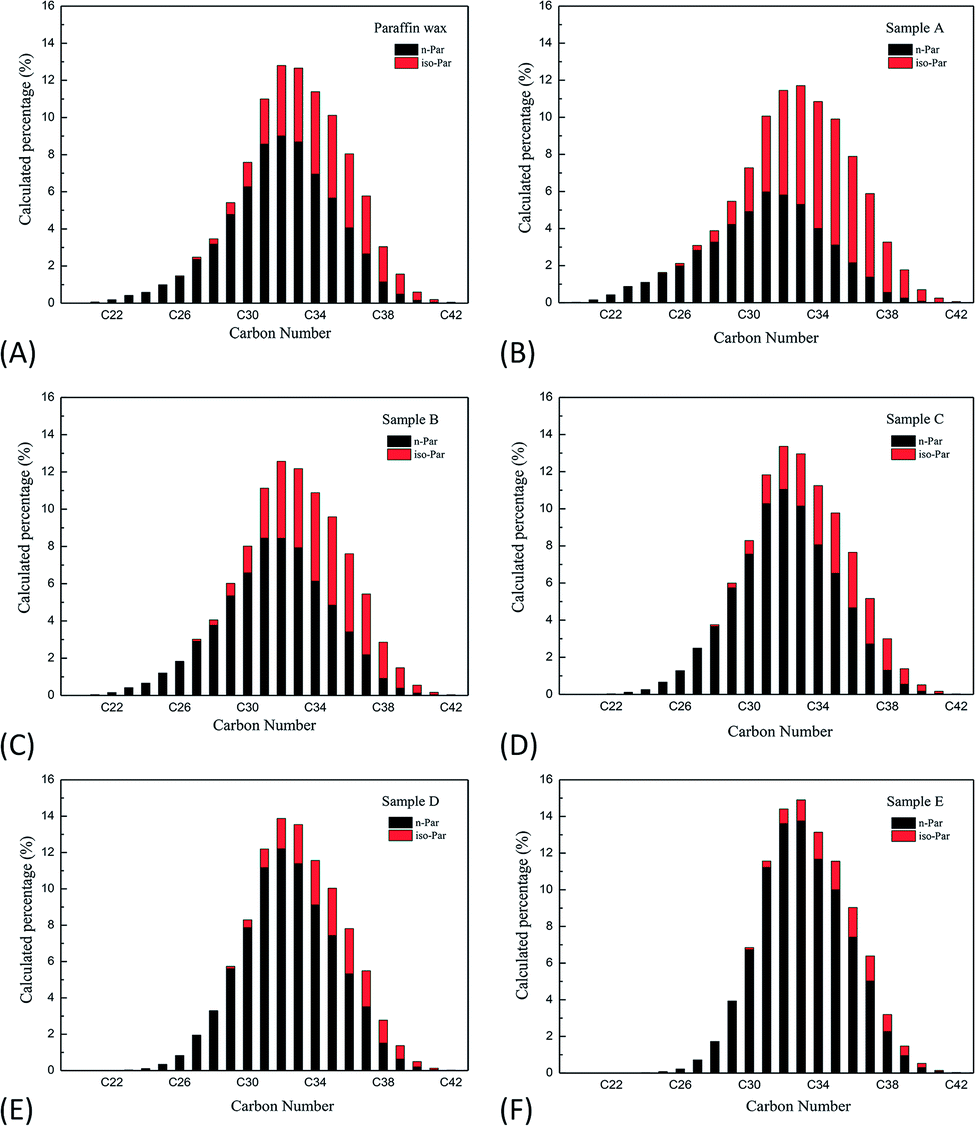 | ||
| Fig. 4 Carbon atom distribution of the components through the forced separation. | ||
3.1.3.3 DSC analysis of the products. As shown in Fig. 5, there are two peaks in the DSC data, the first one is for the solid–solid transition peak, and the second one is for the solid–liquid transition peak. The peak of the solid–solid transition peak, which is closely related to the composition of paraffin wax, became stronger gradually with the increase in n-paraffin content in paraffin wax and the narrowing of the carbon distribution.23
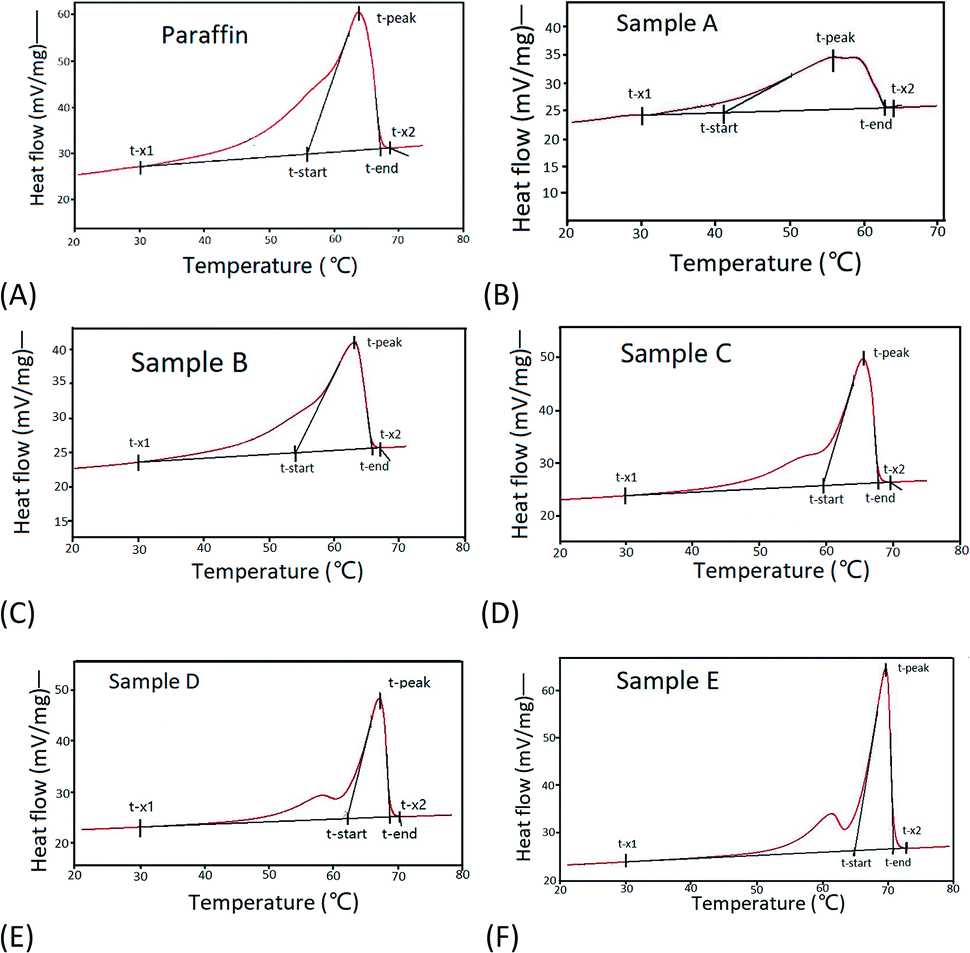 | ||
| Fig. 5 DSC thermograms of the fractions obtained through the forced separation. | ||
Table 7 shows that the peak temperature of each fraction obtained through the forced separation of paraffin increased from 60.0 °C to 69.3 °C, consequently, the latent heat increased from 155.44 J g−1 to 214.71 J g−1 compared with 186.05 J g−1 for the raw paraffin, whereas the temperature difference T-width decreased dramatically from 21.84 °C to 5.88 °C compared with 11.38 °C of the raw paraffin. This indicated that high enthalpy paraffin with a melting point of 70 °C could be obtained through forced sweating separation. The final fraction obtained through the forced separation of paraffin exhibited better performance as a PCM than the raw paraffin, with a peak temperature of 69.74 °C, latent heat of 214.71 J g−1, and T-width of 5.88 °C, which was improved by 5.88 °C of the peak temperature, increased by 15.4% of the latent heat, and narrowed by 5.3 °C of the T-width. As the n-paraffin content increased, a significant peak as a well-defined transition point for the solid–solid phase transition was displayed at a temperature of 57.6 °C in the fraction obtained through the forced separation.
| Paraffin | Sample A | Sample B | Sample C | Sample D | Sample E | |
|---|---|---|---|---|---|---|
| a T -start, T-peak, and T-end are the start, peak, and end of the solid–liquid transition temperatures, respectively. T-width is the difference between T-start and T-end; ΔH is the energy of solid–liquid transition. | ||||||
| Yield, % | 98.4 | 36.5 | 24.3 | 10.7 | 10.8 | 16.1 |
| Melting point, °C | 64.30 | 60.0 | 64.0 | 66.4 | 67.6 | 69.3 |
| T -start, °C | 55.88 | 41.06 | 54.47 | 59.58 | 62.19 | 65.01 |
| T -peak, °C | 63.86 | 55.95 | 63.15 | 65.60 | 67.17 | 69.74 |
| T -end, °C | 67.26 | 62.90 | 65.73 | 67.86 | 68.77 | 70.89 |
| T -width, °C | 11.38 | 21.84 | 11.26 | 8.28 | 6.58 | 5.88 |
| ΔH, J g−1 | 186.05 | 155.44 | 181.26 | 197.17 | 209.28 | 214.71 |
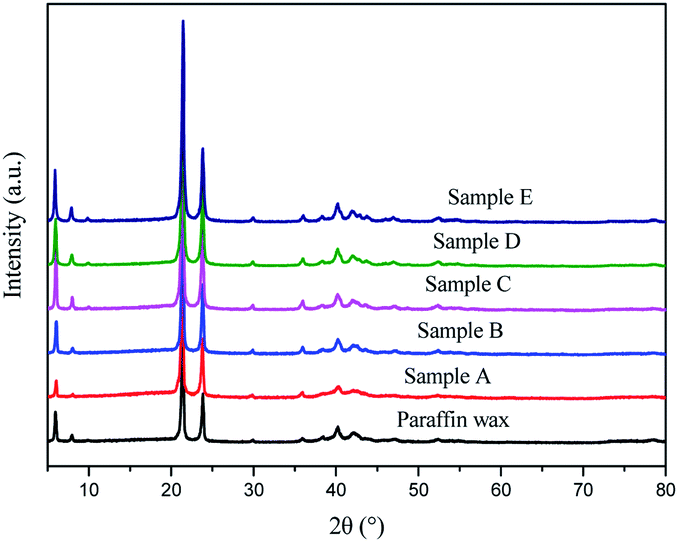
3.1.3.4 XRD analysis of the products. It could be seen in Fig. 6 that there was no significant difference in the crystals structure for commercial paraffin wax and their narrow fractions obtained by vacuum sweating. Strong diffraction peaks near 21° and 23° in the XRD spectra indicated that the crystallization of paraffin wax followed an orthogonal structure,24–26 which was attributed to the XRD pattern of the (110 + 111) and (020) crystal faces, respectively.27 The presence of peaks for the commercial paraffin wax and the narrow fractions obtained by vacuum sweating at 21.4° and 23.8° coincided with the general characteristics of orthogonal crystals, which implied that the crystallization of paraffin and its separation fractions followed an orthogonal orientation.
 | ||
| Fig. 6 XRD curve of the components obtained through the forced separation of paraffin. | ||
 | ||
| Fig. 7 Comparisons of the stroke and relative stroke with temperature increasing between paraffin and its final fraction obtained through forced separation for use as a thermostat. | ||
As shown in Fig. 7A, the transport paths of the final fraction sample E was 8.75 mm in the temperature range 70 °C to 80 °C; meanwhile the stroke was only 0.84 mm at 72 °C, which thus could be used for paraffin actuation. However, the transport path of the commercial paraffin (melting point of 64 °C), manufactured by PetroChina Fushun Petrochemical Company, was less than 8 mm even in the temperature range from 54 °C to 74 °C, which would not satisfy the engineering specification for an auto engine wax thermostat. This could be explained by the fact that commercial paraffin contains a small amount of oil, iso-paraffin, and small molecule n-alkanes, which easily result in shorter transport paths and a wider temperature range. As shown in Fig. 7B, the maximum relative stroke (max ΔL%) of the final fraction sample E was 26.5% (at 78 °C), compared with 9.6% (at 68 °C) for commercial paraffin. The temperature difference between the temperate of the maximum relative stroke and the temperature of the melting point was significantly increased to 8.7 °C, compared with the 4.1 °C of commercial paraffin wax. Therefore, forced separation based on vacuum sweating could narrow the carbon atom distribution, improve the driving force, and increase the separation effect.
4. Conclusions
(1) An improvement in conventional sweating was systematically studied to overcome the difficulty encountered in completely separating the solid components and liquid components in paraffin with a high melting point. Vacuum operation was performed to increase the driving force of the separation, to improve mass transfer of the sweating process, to increase product yield, and to shorten the production cycle.(2) Compared with the conventional sweating method, the yield of the product through vacuum sweating at 80 KP increased by 12.7% from 39.9% to 52.6% at the same production specification of 2.75% oil content for the slack wax from Daqing crude oil.
(3) The separation efficiency for the final fraction of forced separation products was improved by 84.78% with an oil content of 0.07% through the vacuum sweating method without any chemical reaction, which could produce phase-change paraffin with a melting point of 70 °C.
(4) Forced separation through sweating drastically increased the content of normal paraffin and narrowed the distribution range of the carbon atom number distribution. The latent heat of the phase changes was considerably improved, and the temperature difference between the start and end of the phase changes was reduced in the final fraction obtained through the forced separation of paraffin, which showed better performance than commercial paraffin when used as a PCM.
Conflicts of interest
There are no conflicts to declare.Acknowledgements
The authors also acknowledge the financial supports from the PetroChina Fushun Petrochemical Company.Notes and references
- B. Zalba, J. M. Marın, L. F. Cabeza and H. Mehling, Appl. Therm. Eng., 2003, 23, 251–283 CrossRef CAS.
- N. Yuksel, B. Arabacıgıl and A. Avcı, J. Renewable Sustainable Energy, 2012, 4, 063126 CrossRef.
- A. Reyes, L. Henríquez-Vargas, R. Aravena and F. Sepúlveda, Energy Convers. Manage., 2015, 105, 189–196 CrossRef CAS.
- X. Qiu, L. Lu, P. Han, G. Tang and G. Song, J. Therm. Anal. Calorim., 2016, 124, 1291–1299 CrossRef CAS.
- P. Principi and R. Fioretti, Energy Build., 2012, 51, 131–142 CrossRef.
- S. Wu, D. Huang, F.-B. Lin, H. Zhao and P. Wang, J. Therm. Anal. Calorim., 2011, 105, 171–186 CrossRef CAS.
- Y. Hu, X. Song, Q. Zheng, J. Wang and J. Pei, RSC Adv., 2019, 9, 9962–9967 RSC.
- S. Seitz, M. Akashi and H. Ajiro, Colloid Polym. Sci., 2017, 295, 1541–1548 CrossRef CAS.
- X. Kong, X. Chong, K. Squire and A. X. Wang, Sens. Actuators, B, 2018, 259, 587–595 CrossRef CAS.
- S. Seitz and H. Ajiro, Sol. Energy Mater. Sol. Cells, 2019, 190, 57–64 CrossRef CAS.
- S. Miller, Microporous Mater., 1994, 2, 439–449 CrossRef CAS.
- I. Kalambet and V. Dorodnova, Chem. Technol. Fuels Oils, 1982, 18, 331–333 CrossRef.
- D. Bethge, Vac. Technol. Chem. Ind., 2014, 281–294 Search PubMed.
- F. Yan and Y. Cai, Pet. Sci. Technol., 2009, 27, 882–894 CrossRef CAS.
- J. R. Bowman and H. S. Burk, Ind. Eng. Chem., 1949, 41, 2008–2012 CrossRef CAS.
- R. Edwards, Ind. Eng. Chem., 1957, 49, 750–757 CrossRef CAS.
- S. Kumar, S. Nautiyal, H. Khan, K. Agrawal and J. Dimri, Pet. Sci. Technol., 2005, 23, 939–951 CrossRef CAS.
- a. R. M. Roehner and F. V. Hanson, Energy Fuels, 2001, 15, 756–763 CrossRef.
- Q. Fan, G. Bai, S. Wu, W. Yuan and X.-M. Song, Pet. Sci. Technol., 2017, 35, 1495–1501 CrossRef CAS.
- Q. Fan, G. Bai, Q. Liu, Y. Sun, W. Yuan, S. Wu, X.-M. Song and D.-Z. Zhao, Ultrason. Sonochem., 2019, 50, 354–362 CrossRef CAS.
- C. Bai and J. Zhang, Ind. Eng. Chem. Res., 2013, 52, 2732–2739 CrossRef CAS.
- C. Nie, X. Tong, S. Wu, S. Gong and D. Peng, RSC Adv., 2015, 5, 92812–92817 RSC.
- S. Srivastava, R. Tandon, D. Pandey, D. Madhwal and S. Goyal, Fuel, 1993, 72, 1345–1349 CrossRef.
- S. Nautiyal, S. Kumar and S. Srivastava, Pet. Sci. Technol., 2008, 26, 1339–1346 CrossRef CAS.
- S. Pechook and B. Pokroy, Adv. Funct. Mater., 2012, 22, 745–750 CrossRef CAS.
- Q. Tang, J. Sun, S. Yu and G. Wang, RSC Adv., 2014, 4, 36584–36590 RSC.
- C. Vélez, J. M. O. de Zárate and M. Khayet, Int. J. Therm. Sci., 2015, 94, 139–146 CrossRef.
| This journal is © The Royal Society of Chemistry 2019 |