
 Open Access Article
 This Open Access Article is licensed under a Creative Commons Attribution-Non Commercial 3.0 Unported Licence
Photochemistry and desorption induced by X-rays in water rich astrophysical ice analogs: implications for the moon Enceladus and other frozen space environments
S. Pilling *ab,
W. R. M. Rochac,
F. M. Freitasa and
P. A. da Silvaad
*ab,
W. R. M. Rochac,
F. M. Freitasa and
P. A. da Silvaad
aLaboratório de Astroquímica e Astrobiologia (LASA), Universidade do Vale do Paraíba (UNIVAP), Av. Shishima Hifumi, 2911, São José dos Campos, SP, Brazil. E-mail: sergiopilling@pq.cnpq.br
bDepartamento de Física, Instituto Tecnólogico de Aeronáutica, ITA – DCTA, Vila das Acácias, São José dos Campos, 12228-900 SP, Brazil
cNiels Bohr Institute Centre for Star and Planet Formation, University of Copenhagen, Øster Voldgade 5-7, DK-1350 Copenhagen K., Denmark
dEscola de Engenharia de Lorena da Univ. de São Paulo EEL, Estrada Municipal do Campinho, s/n - Pte. Nova, Lorena, SP 12602-810, Brazil
First published on 13th September 2019
Abstract
Soft X-rays are an important agent for chemical processing in the Solar System and in the interstellar medium. The photolysis and photodesorption processes of H2O-rich ices triggered by soft X-rays was, experimentally, addressed in this paper. The experiments were performed at the Brazilian synchrotron facility LNLS/CNPEN employing broadband radiation (from 6 to 2000 eV; mainly soft X-rays and a small fraction of VUV) in solid samples at temperatures of 20 and 80 K. The icy samples were monitored by infrared spectroscopy. We determined the effective destruction cross section (in the order 10−18 cm2) as well as the formation cross section for the new species produced after the irradiation. Among them, we list OCN−, CO, CO3, CH3OH, H2O2, HCOO−, NH4+, HCONH2 and CH3HCO, mostly formed in the experiment at 80 K. The chemical equilibrium stage was characterized and molecular abundances were quantified. In addition, we discuss a methodology to estimate the amount of unknown species in the ice produced by photolysis. The samples reach chemical equilibrium at fluences around 2–3 × 1018 cm−2. Timescales for reaching chemical equilibrium in space environments illuminated by X-rays were given, as well as the desorption yields induced by X-rays. The astrophysical implication on the surface chemistry and desorption processes at the moon Enceladus are provided.
1. Introduction
Frozen surfaces in space environments are highly exposed to ionizing agents such as UV and X-rays, cosmic rays and energetic electrons. The ionizing radiation produced by stars induces chemical changes in the surrounding matter (circumstellar and interstellar gas, solid-phase molecules (icy grains), planets, and other orbiting bodies), enhancing the chemical complexity of these environments.1–9 As pointed out by Pilling and Bergantini10 following the discussion of Imanishi et al.11 and Siebenmorgen and Krügel,12 in the case of newborn stars, also called young stellar objects (YSOs), the material falling toward the stars makes the emission of X-rays even more intense than in stars in the main sequence. Such X-ray photons are capable of traversing large column densities of gas before being absorbed.13–15Pilling and Bergantini10 have pointed out that in space environments the photochemical complexity increases as the energy of the incoming photons increases, which leads neutral molecules to excited states, radicals, and ions at higher energies. In addition, in the case of X-rays, the produced high-energy (∼keV) photoelectrons and low-energy (∼eV) induced secondary electrons also represent an extra source of molecular processing. The domain of each set of reactions depends on the absorption cross section of each molecule involved. For example, as discussed by Pilling and coworkers,16 the photochemical regime below 9 eV is governed by neutral–neutral or exited–neutral processes; for energies between approximately 10 and 14 eV, the chemical pathway involves neutral–radical as well as radical–radical; and for photon energies higher than ∼15 eV, the reaction involving ionic species dominates the photochemistry, which also increases the reaction rates due to the decrease of the activation barrier of the reaction routes.
In this paper, experimental data from the photolysis induced by broadband soft X-rays up to 2 keV in the ice mixtures containing H2O (major)![[thin space (1/6-em)]](https://www.rsc.org/images/entities/char_2009.gif) :CO2:CH4:NH3 at two different temperatures (20 and 80 K) is presented. The experiments are an attempt to simulate the photochemical and photodesorption processes induced by energetic photons in water rich ices at different temperatures largely illuminated by soft X-rays such as the one founds at the Enceladus moon and ices in interstellar medium. This research also tries to points out the effects of temperatures in the chemical equilibrium scheme and desorption induced by soft X-rays in such astrophysical ice analogs.
:CO2:CH4:NH3 at two different temperatures (20 and 80 K) is presented. The experiments are an attempt to simulate the photochemical and photodesorption processes induced by energetic photons in water rich ices at different temperatures largely illuminated by soft X-rays such as the one founds at the Enceladus moon and ices in interstellar medium. This research also tries to points out the effects of temperatures in the chemical equilibrium scheme and desorption induced by soft X-rays in such astrophysical ice analogs.
The Saturn's moon, Enceladus, was investigating extensively during the flybys of the Cassini spacecraft by a variety of instruments onboard it which reveals its surface composition with details. The cold surface of Enceladus is mainly composed by water ice with lower quantities of other volatile species, as CO2, NH3 and other organics (in minor quantities).17,18 The surface temperature of this moon was also mapped by Cassini, revealing a temperature gradient varying from ∼35 K at the north pole, reaching 72 K at the equator and the south pole, and up to temperatures as higher as 160 K close to the tiger stripes.19 The surface of Enceladus is recovered by material from the plumes, which is spelled from it, then fissures and falls off onto the surface.20 This icy material is constantly bombarded with ions and electrons from the magnetosphere of Saturn as well as X-rays and incoming UV photons from the Sun.
Previous experiments also employing X-rays on analogous astrophysical ices have also shown the importance of such ionizing agent in the physicochemical processing of the frozen sample.10,21–26
Section 2 describes the experimental setup and sample properties. The results and the analysis of the infrared spectra of both samples are given the Section 3. In this section, we also present the methodology to determine some physicochemical quantities such as the effective destruction and formation cross section, the compaction cross section, the sputtering yield and others. An extensive subsection describing the chemical equilibrium was also provided (with the methodology to estimate de mass of unknown species in the ices). Section 4 presents the astrophysical implication focus on the timescale to reach chemical equilibrium and desorption yield in induced by X-rays in Enceladus, as well as, other astrophysical environments such the vicinity of young stellar objects (YSOs). Conclusion and final remarks are given in Section 5.
2. Experimental setup
To simulate the photochemical processes triggered mainly by soft X-rays on water-rich ices analogous the ones present in astrophysical environments, we used the facility of the Brazilian Synchrotron Light Laboratory (LNLS/CNPEN) located in Campinas, Brazil. The experiments were performed using a high-vacuum portable chamber from the Laboratório de Astroquímica e Astrobiologia of UNIVAP university (LASA/UNIVAP) coupled to the spherical grating monochromator (SGM) beamline. The beamline was configured to operates in the off-focus and white beam mode, producing a wide spectral range of ionizing photons (from 6 eV up to 2000 eV, mainly soft X-rays with small fraction of vacuum ultra violet VUV). The beamline details can be found elsewhere.27,28 The employed photon flux was roughly 1 × 10¹⁴ photons per cm2 per s, with an average energy flux of 6 × 10⁴ erg cm−2 s−1 = 3.7 × 10¹⁶ eV cm−2 s−1. Additional details about the employed instrumentation and photon flux characterization can be obtained at Pilling and Bergantini.10 Fig. 1 presents a diagram of experimental chamber employed, together with two photographs of the experimental setup (the experimental hall and a close up of vacuum chamber).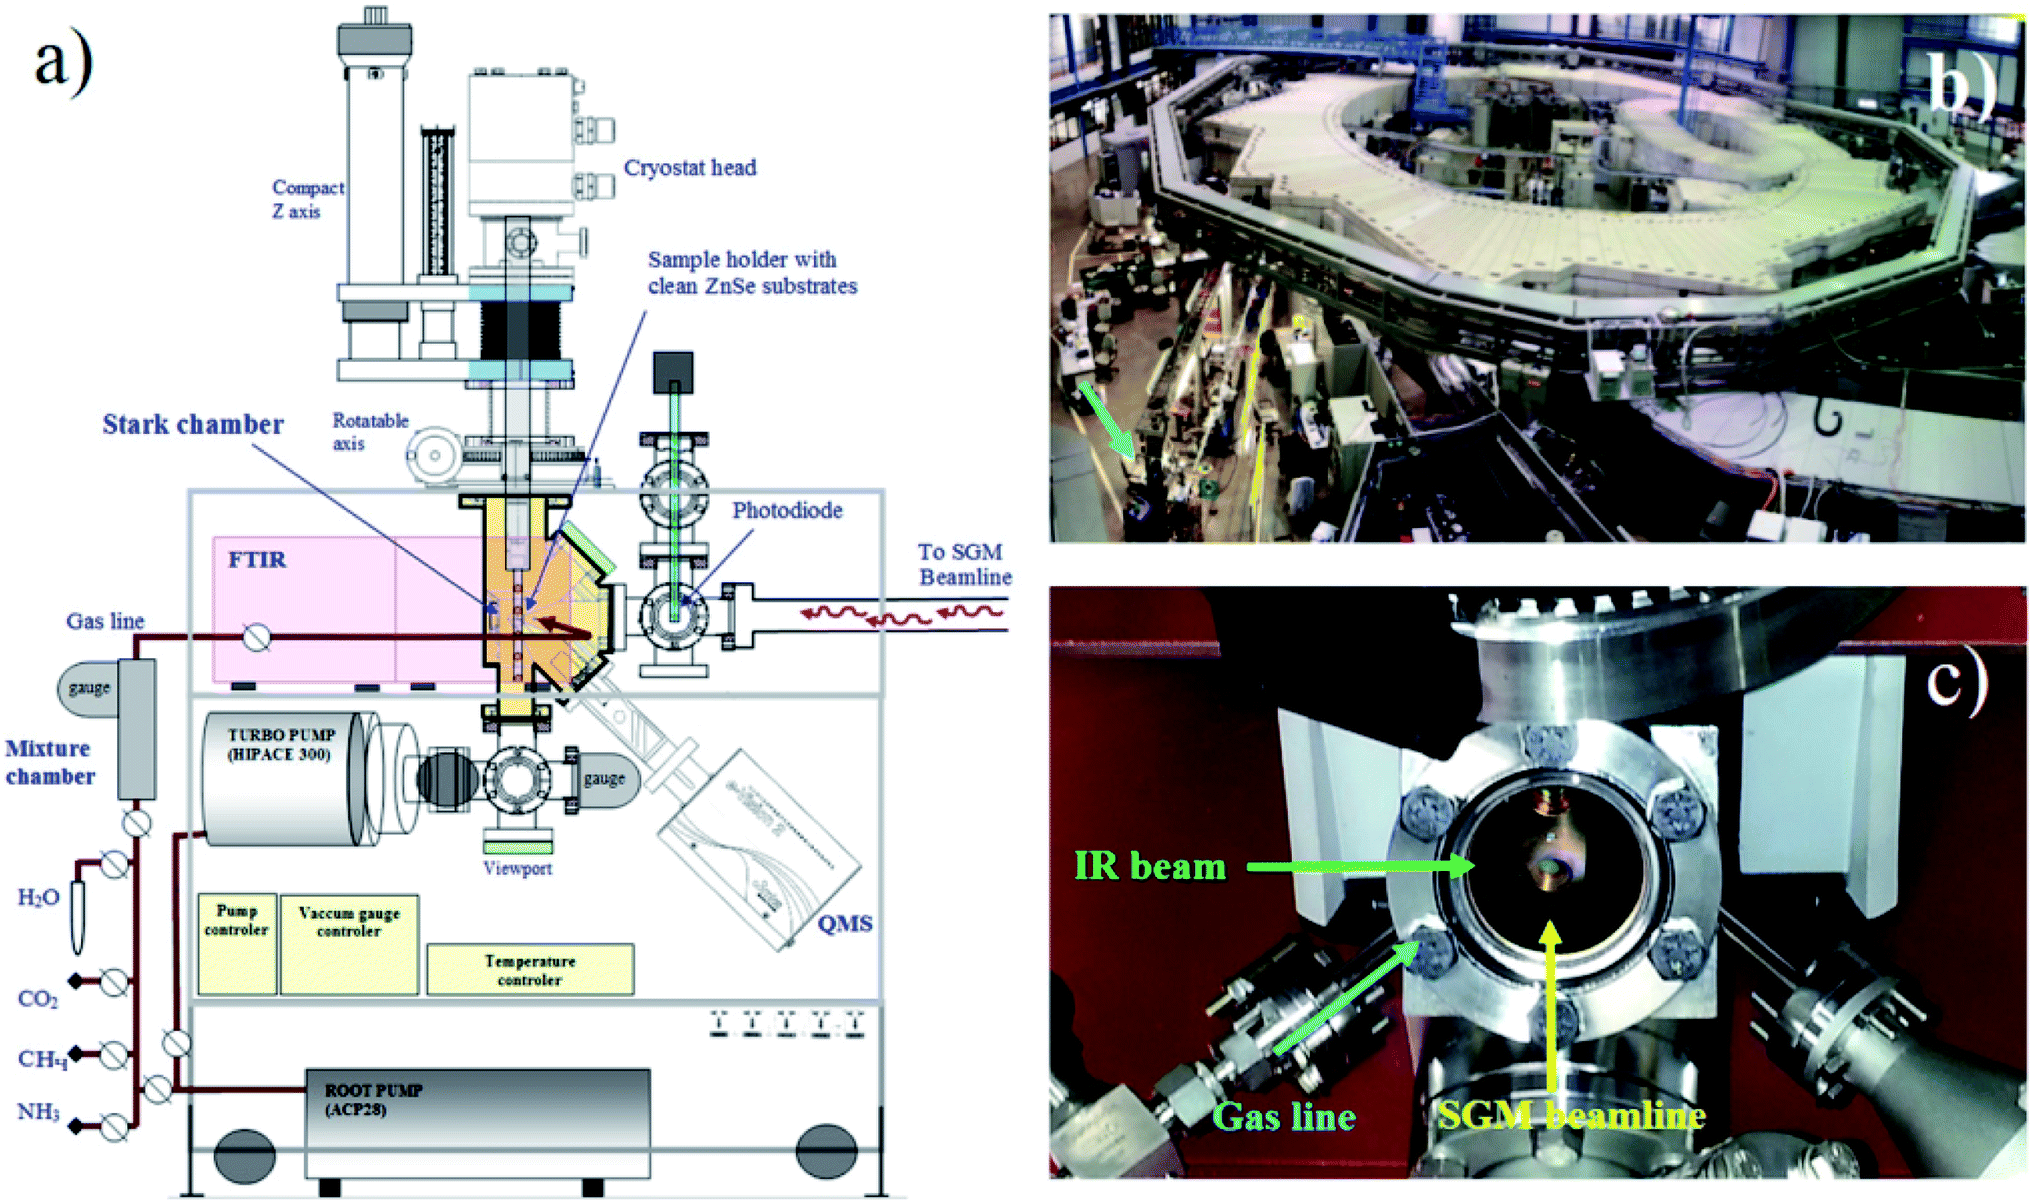 | ||
| Fig. 1 (a) Diagram of the experimental setup (Stark chamber). (b) Photograph of the experimental hall of the Brazilian synchrotron source (LNLS) with the experimental chamber coupled at the SGM beamline (arrow). (c) Photograph showing the frozen sample inside the chamber at the moment of irradiation with synchrotron light (adapted from Pilling and Bergantini)10. | ||
Briefly, a gas mixture containing H2O (major), CO2, CH4 and NH3, was produced in a mixture chamber coupled to the experimental chamber. The mixture (roughly 10 mbar) was slowly deposited though a capillary stainless tube into a polished ZnSe substrate, previously cooled to 12 K by a helium closed cycle cryostat (ARS Inc., model CS204AB-450) inside a portable and high-vacuum chamber (Stark chamber). The deposition time was around 20 minutes at a background pressure in the main chamber of 2 × 10⁻⁷ mbar. In this manuscript two different experiments were described, one in which the irradiation phase occur at temperature at 20 K and other at 80 K. The temperature was measured by thermocouple coupled to cryostat head. After deposition, the sample holder was slowly heated at a 2 K min−1 ramp up to the irradiation temperatures. The cryostat power is high enough to keep temperature nearly constant during irradiation (variation in the order of ∼0.2 K). Here, we try to produce two identical samples containing the mix of H2O:CO2:CH4:NH3 with abundance ratio of 10:1:1:1 but it was difficult to get this exact ratio during sample preparation with the current instrumentation (mainly due to the different sticking coefficient and diffusion of gases along the gas line and the heating processes of ice samples that induce some molecular desorption). The investigated samples were the ones with this closest mixture ratio. Details of the samples investigated in this work are shown in Table 1. The initial sample thicknesses were 2 and 1.5 μm, for the ice at 20 K and 80 K, respectively. These values were estimated adopting a sample density of 1.0 g cm−3 with the methodology described elsewhere.29
| Label | Samplea (H2O:CO2:CH4:NH3) |
Temp.b (K) | Initial thicknessc [μm] | Photon fluxd [photons per cm2 per s] | Final fluence [1018 photons per cm2] (total irradiation time) |
|---|---|---|---|---|---|
| a At the beginning of irradiation.b The temperature during deposition phase was 12 K.c Calculated considering density of 1 g cm−3 and methodology described at Pilling et al.29,30d Broadband photon beam with energies from 6 to 2000 eV (mainly soft X-rays with small fraction of VUV photons). See discussion at Pilling and Bergantini.10 | |||||
| E20K | 10:1.4:1.0:0.9 |
20 | ∼2.0 | ∼1 × 10⁻¹⁴ | 2.58 ± 0.25 (430 min) |
| E80K | 10:2.9:0.3:3.2 |
80 | ∼1.5 | ∼1 × 10⁻¹⁴ | 3.01 ± 0.30 (501 min) |
In situ chemical analyses of the samples were performed by a portable Fourier transform infrared (FTIR) spectrometer (Agilent Inc., model Cary 630) coupled to the experimental chamber. The spectra were taken from 4000 to 600 cm−1 with resolution of 2 cm−1 and at different fluences of radiation. The infrared transmission spectra were obtained by rotating the substrate/sample by 90° after each radiation dose and at selected temperatures during the heating stages. Infrared spectra of non-irradiated (pristine) samples taken at the beginning and at the end of the experiments were also compared. The maximum fluence employed was applied the experiment at 80 K and was around 3 × 10¹⁸ photons per cm2 (which corresponds to 501 minutes or 8.3 h of continuous irradiation).
To determine the physicochemical parameters (e.g. cross sections, desorption rate and molecular abundaces in the equilibrium chemistry stage) of samples during ice processing we monitor the evolution of selected band area in the IR spectra as a function of fluence. The area determination was performed by employing the OMNNIC program (sum of the band signal followed by a subtraction of the linear background below the band region). The best linear background was chosen to guarantee that measured band doesn't has influence of other bands. Interference pattern in the IR spectrum doesn't affect significantly peak area since fluctuations are below and above the baseline threshold.
The initial column density were determined by employing the methodology described in Pilling et al.29–32 The molecular assignments of infrared bands as well as band strengths (A-values) of the parent species were taken from Gibb et al.33 d'Hendecourt and Allamandola34 and Kerkhof et al.35 For the new produced species due to photolysis, the molecular assign bands and the employed bang strengths were taken from Moore et al.,36 van Broekhuizen et al.,37 d'Hendecourt and Allamandola,34 Bennett et al.,38 Loeffler et al.,39 Berckmanns et al.,40 Schutte et al.41 and, Grim et al.42 Table 2 list the location of bands in the infrared spectrum that were analyzed, quantified and attributed to molecular species (see also Table 2).
| Parent species | Band peak [cm−1] | σd (E20K) [10−18 cm2] | σd (E80K) [10−18 cm2] | Notes and references |
|---|---|---|---|---|
| H2O | 805 | 3,2 | 5.2 | Very broad. Band peak at ∼780 cm−1 (libration mode) with area measured considering the left half area of this band and multiplying by 2; A = 2.8 × 10⁻¹⁷ cm per molecule (Gibb et al.33) |
| CO2 | 2243 | 8,5 | 2.1 | Sharp. Band peak at 2340 cm−1 (–C–O stretch) with A = 7.3 × 10⁻¹⁷ cm per molecule (d'Hendecourt and Allamandola34) |
| CH4 | 1302 | 3,7 | ∼0.2 | Sharp. Band peak at 1304 cm−1 (CH4 deformation) with A = 6.1 × 10⁻¹⁸ cm per molecule (d'Hendecourt and Allamandola34) |
| NH3 | 1120 | 1,9 | 4.7 | Broad. Band peak at 1110 cm−1 (umbrella mode) with A = 1.2 × 10⁻¹⁷ cm per molecule (Kerkhof et al.35) |
| Daughter species | Band center [cm−1] | σf (E20K) [10−18 cm2] | σf (E80K) [10−18 cm2] | Notes and references |
|---|---|---|---|---|
| OCN− | 2167 | ∼0.9 | 1.2 | Weak and broad. Band peak at 2169 cm−1 with A = 1.3 × 10⁻¹⁶ cm per molecule (Moore et al.,36 van Broekhuizen et al.37) |
| CO | 2140 | ∼1 | 2.1 | Strong and sharp. Band peak at 2138 cm−1 with A = 1.1 × 10⁻¹⁷ cm per molecule (d'Hendecourt and Allamandola34) |
| CO3 | 2045 | — | 2.1 | Small. Band peak at 2045 cm−1 with A = 8.9 × 10⁻¹⁸ cm per molecule (Bennett et al.38) |
| CH3OH | 1017 | 1.2 | ∼0.7 | Sharp. Band peak at 1018 cm−1 (–C–O– stretch) with A = 1.0 × 10⁻¹⁷ cm per molecule (d'Hendecourt and Allamandola34) |
| H2O2 | 2850 | — | 5.0 | Weak and broad. Band peak at ∼2858 cm−1 with A = 5.7 × 10⁻¹⁷ cm per molecule at 80 K (Loeffler et al.39) |
| HCOO− | 1580 | — | 3.4 | Band peak at 1018 cm−1 (–C–O– stretch) with A = 1 × 10⁻¹⁶ cm per molecule (Berckmanns et al.;40 Schutte et al.41) |
| NH4+ | 1490 | — | 9.2 | Ammonium. Broad. Band peak at 1485 cm−1 with A = 2 × 10⁻¹⁶ cm per molecule (Grim et al.42) |
| HCONH2 | 1390 | — | 8.0 | Formamide. Band peak at 385 cm−1 (CH deformation) with A = 3.2 × 10⁻¹⁸ cm per molecule (Schutte et al.41) |
| CH3HCO | 1350 | — | 8.5 | Acetaldehyde. Band peak at 1350 cm−1 (CH deformation) with A = 1.5 × 10⁻¹⁸ cm per molecule (Schutte et al.41) |
| Unknown | — | ∼5.8 | ∼9 | Determined employing a modified version of eqn (1) taking into account the subtracted column mass (M − Mo) of unknown species (discussed in Section 3.3). The best fit are presented by the solid green line in Fig. 5a and b |
The energetic processing by X-rays induces a core ionization of the atoms in the ice, which leads to the ejection of primary electrons. The filling of the inner-shell vacancy, however, might lead to the emission of another electron, called Auger electron. Such released electrons, will interact with ice itself, leading to a cascade of secondary electrons, and further energetic processing in the ice. Considering that the penetration depth of X-rays is usually higher than the values for the electrons with same energy, we can say that the chemistry triggered by X-ray photolysis is indeed the chemistry triggered by the myriad of energetic electrons (produced from X-ray interaction with matter) inside ice bulk.
3. Results
From the analysis of bands in the infrared spectra of the studied samples we determined several physicochemical parameters as well as the molecular composition. In this section we will describe the physicochemical quantities we measured in this work (such as the effective production and destruction cross section, compaction, sputtering yield) and others that we estimated employing current data (e.g. column mass of unknown species, chemical equilibrium abundances, and desorption yield). The chemical equilibrium reached by the samples at large fluences was characterized with details and, an extended discussion of such phenomenon was given.3.1 Chemical changes induced by X-rays in the frozen samples
Fig. 2 shows the changes in the infrared spectra during the photolysis induced by X-rays described in this manuscript. Panel (a) presents the four selected infrared spectra to illustrate the chemical changes. The two topmost spectra are from the experiment at 20 K and the two bottommost spectra are from the experiment at 80 K. In each set, the bottom spectrum represent the non-irradiated ice. Labels indicates the molecular assignments for selected infrared bands (labels in italic represents the new produced species after photolysis and labels in blue color represents the bands of parent species). Inset figure is a zoom in from the region between 2200 to 1000 cm−1. The selected spectrum to illustrate the effect of photolysis in both experiments was taken after 420 min of continuously irradiation with X-rays (at the fluence of ∼2.5 × 10¹⁸ photon per cm2) for the experiment E20K and after 501 min of irradiation (at the fluence of ∼3 × 10¹⁸ photon per cm2) for the experiment E80K.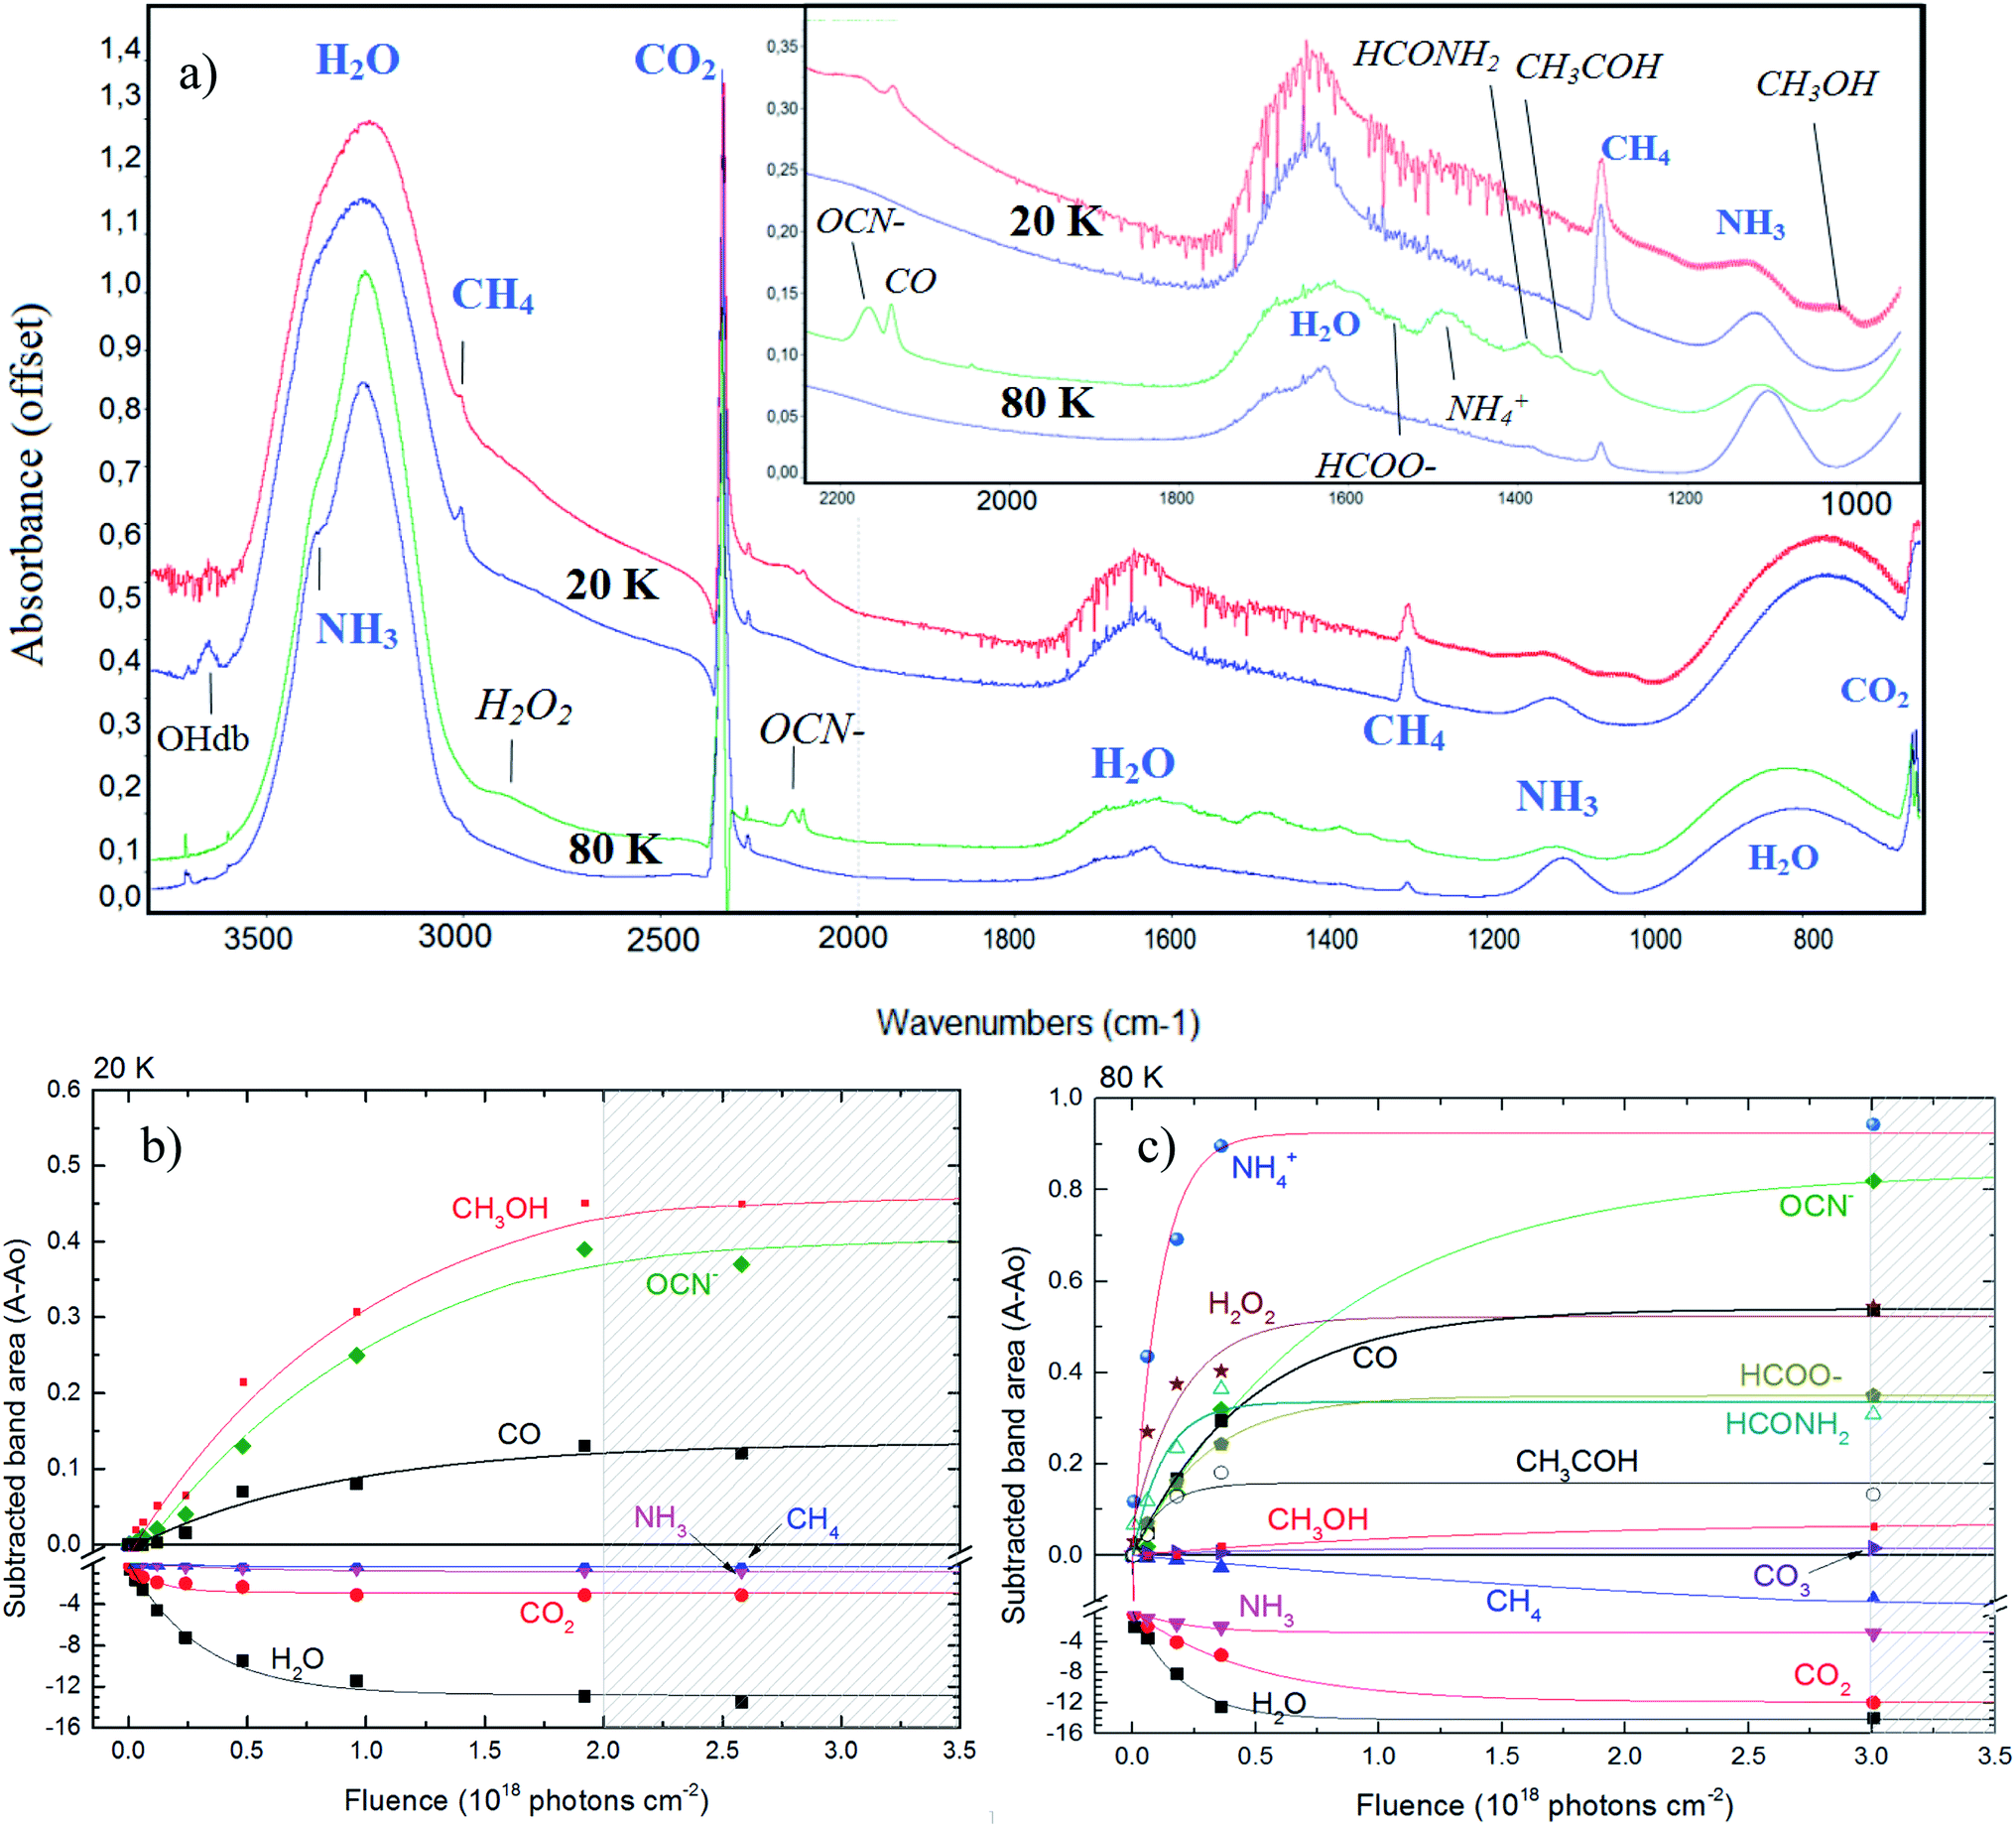 | ||
| Fig. 2 Changes in the infrared spectra during photolysis. (a) Selected infrared spectrum of the studied ices at 20 K (top two spectra) and 80 K (bottom two spectra). In each set, the bottommost spectrum represent the non-irradiated ice. Labels indicates the molecular assignments for selected infrared bands (labels in italic represents the new produced species after photolysis). Inset figure is a zoom in form 2200 to 1000 cm−1. Panels (b) and (c) shows the subtracted band area of selected bands as a function of fluence in experiments E20K and E80K, respectively. The errors bars were around 20%. Lines are the best fit obtained with eqn (1). Hatched region indicates the chemical equilibrium region in both experiments. See details in the text. | ||
The photolysis of the frozen sample produced a lot of new species, including OCN−, CO, CO3, CH3OH, H2O2, HCOO−, ammonium (NH4+), formamide (HCONH2) and acetaldehyde (CH3HCO), although mostly of them were only possible to be detected in the ice with temperature at 80 K. This corroborates other previous experiments suggesting that warm ices during radiation processing have a richer chemistry.
The panels (b) and (c) in Fig. 2 show the subtracted band area for some selected bands as a function of fluence in experiments E20K and E80K, respectively. The new produced species are in the positive part of y-axis whereas the parents species are located in the negative region of y-axis (destruction). Lines are the best fit obtained with eqn (1) (described in Section 3.2). Hatched region indicates the chemical equilibrium region in both experiments that we will discuss in the Section 3.3. From both panels we observe that experiment at 80 K presents a richer chemistry with the presence of some species that were not observed in the experiment at 20 K (e.g. H2O2, NH4+ and others). The production of OCN− is very enhanced at 80 K. Pilling and Bergantini10 also reported this dependence of the OCN− production with temperature in another experiments also employing soft X-rays in astrophysical related ices.
Bergantini et al.43 have presented several sets of electron-induced chemistry of similar ices containing initially H2O, CO2, NH3 and CH4. The reaction routes are able to describe the formation of daughter species such as OCN−, NH, CH3OH, HCONH2, and others. Abdulgalil et al.,44 on the other hand describes that a low-energy (240–400 eV) processing of CH3CN by electrons, does not enrich the chemistry, once no daughter species were detected by the infrared spectroscopy. In order to increase the accuracy of the detection of new species after the electron processing, Henderson and Gudipati45 used the two-step laser ablation and ionization mass spectrometry technique. They report the formation HCO, HCN, CH3CO, HCONH2, acetamide (CH3CONH2) and methyl formate (HCOOCH3). The study employing electrons helps to understand the reaction routes induced by soft X-rays since most of chemical pathways within the irradiated ice is triggered by ejected electrons (primary, secondary…).
Recently, another experimental study employing X-ray photolysis of NH3-rich ices have also observed the formation of OCN−, NH4+, HCONH2, and other species including some IR features compatible with glycine or its isomers.26 Employing photons between 250 to 1250 eV (with maximum at 700 eV) and combined infrared measurements with mass spectroscopy technique the authors26 were able to detect, after irradiation of H2O:CO:NH3 (1:0.9:0.7) ice at 13 K, complex organic species such as HCOOCH3, CH3NCO and NH2COCONH2. The infrared analysis of organic residue at room temperature indicates the presence of even more complex species, including HMT (hexamethylenetetramine), carboxylic salts and amides. The presence of HMT, amides and related species in irradiated NH3-rich ices by strong ionizing field was also observed by Pilling et al.,16 employing cosmic ray analogs with energies in the range of MeV.
3.2 Formation and destruction cross section
The numerical evolution of the abundance of a given molecular species in the ice during the irradiation (parent or daughter) can be quantified in terms of molecular band area by the equation| A − Ao = A∞ × (1 − e(−σd,f × F)) [cm−1] | (1) |
The effective formation and destruction cross section have only importance while the system does not reach chemical equilibrium. As we will discuss further, since the system tends to reach equilibrium at large fluences the formation and destruction rates of each species reach similar values resulting a value equal to zero for the effective destruction and formation cross section (after chemical equilibrium is reached). In a general way, the instantaneous effective destruction and formation cross section (defined by considering short fluence data sets the of entire data) changes continually as function of fluence since the chemistry in the ice changes with the fluence. Additionally, it continuously decreases as the fluence increase, reaching zero at the chemical equilibrium region. We will focus on this issue in a future work.
Table 2 presents the effective destruction and formation cross section, for parent and daughter species, during ice irradiation by photons from 6 to 2000 eV (mostly soft X-rays) obtained by employing eqn (1) at the experimental dataset. References for molecular attribution and band strength employed (in calculation of column densities was well as mass column) are also given. The determined effective destruction cross section of the parent species were between 0.2–8.5 × 10⁻¹⁸ cm2. The major differences in the effective destruction cross section were seen for CO2 (4.2 times higher for experiment at 20 K) and CH4 (16 times higher for experiment at 20 K). For H2O and NH3, the destruction cross section obtained at 80 K were slightly higher than the obtained value at 20 K. The effective formation cross section were also determined and were in the range between 0.7–9 × 10⁻¹⁸ cm2. A methodology to estimate the amount of unknown species as well as its desorption rate and effective formation cross section was provided. Comparing both experiments we observe that cross sections are slightly higher for the experiments performed at 80 K.
Previous experiments employing the same instrumentation and similar incoming broadband X-ray field have obtained the effective destruction cross section (σd) in the same order of magnitude. For example, the determined values for σd during the irradiation of pure SO2 ice at 12 K (Bonfim et al.46), pure HCOOCH3 ice at 12 K (Rachid et al.21), a binary ice mixture N2:CH4 (19:1) at 12 K (Vasconcelos et al.22) and a quaternary ice mixture H2O:CO2:NH3:SO2 (10:1:1:1) at two different temperatures (50 and 90 K) (Pilling and Bergantini10) were 2.1 × 10⁻¹⁸ cm2, 4.2 × 10⁻¹⁸ cm2, 3.8 × 10⁻¹⁹ cm2 and 2–7 × 10⁻¹⁸ cm2, respectively.
3.3 Chemical equilibrium after large fluences
From the analysis of the subtracted band-area (or its related quantities such as column densities as well as column mass or molecular abundances) at large fluences we notice that both parents and daughters species reach virtually an horizontal plateau indicating a chemical equilibrium in the ice (also called equilibrium branching ratio – EBR%). In other words, the chemical equilibrium occurs when the variation of summed chemical abundances is negligible (here we considered that chemical equilibrium is reached when the changes in the abundances (summed) is less then ∼1% of the total abundance). In this regime, the processing by incoming radiation induce equal reaction rates for the destruction and production of a give species which keeps molecular abundances nearly constant even during continuously and extended further irradiation.21,22,46–49 However, due to continuous desorption induced processes by soft X-rays the amount of molecules in the ice decreases slowly even after chemical equilibrium be reached. The concept of chemical equilibrium can be also employed to estimate the type and amount of desorbed species to gas-phase as we will discuss later.To calculate the percentage of molecules in the ice (or even the mass percentage) it is necessary also to estimate the mass of unknown species. We call unknown species the molecules in the following situation that might be present in the ice: (i) with vibration modes related with a vanishing dynamic dipole moment or homo-nuclear diatomic molecules (no permanent dipole), (ii) with abundances bellow the spectrometer detection limit, (iii) with IR bands overlapped with other bands or (iv) with IR bands mixed with noise in the spectra and therefore being difficult to be measured/quantified. To estimate the amount of unknown species in the sample and also of those (known and unknown) desorbed from the sample surface, it is necessary to analyze evolution of the masses of different species in the sample as a function of fluence. As discussed by Vasconcelos et al.,22 the column mass of a given species i, in units of Da cm−2, as a function of fluence can be determined by:
 | (2) |
 is the molecular mass of given species i, in units of Da per molecule. Therefore, the estimated column mass of the desorbed species (all species together including parent, daughter and unknown) from the sample during ion bombarded as a function of fluence, MDES (F), is given by:
 | (3) |
 is the average molecular mass of the parent species initially in the sample (20.5 and 22.4 for the experiment at 20 K and 80 K, respectively), in Da per molecule. Moreover, in this equation, the Y is the sputtering rate, in molecules per photon and F is the fluence, in photons per cm2.
Since the sum of column mass of the molecules remaining on the solid phase and the column mass of the molecules leaving the sample by sputtering is constant, the column mass of the unknown species (MUN) is given by:
 | (4) |
 is the sum of the column masses of the parent species in the non-irradiated sample (i.e. the initial mass of the ice), ∑Mj(F) is the sum of the column masses of the parent species at a given fluence F and MDES(F) is the column mass of desorbed species at a fluence F, calculated using the eqn (3). By estimating the column mass of the non-observed species, MUN, and adopting an average molar mass for these species, which we assumed as an approximation to be equal to the molar mass of the parent species
  , we can calculate the estimated column density of the unknown species (present in the ice but not identified or quantified) as a function of fluence (NUN):
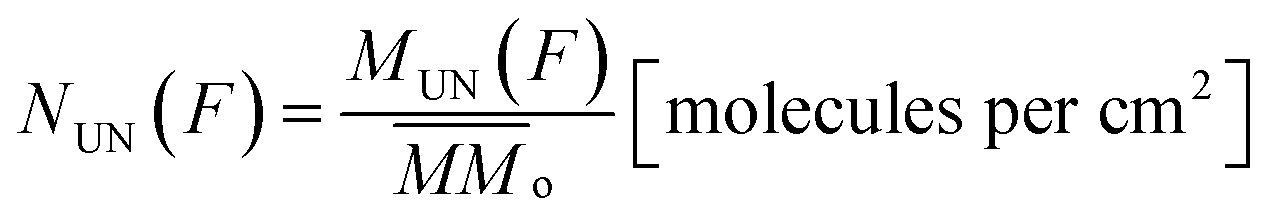 | (5) |
Fig. 3 shows the evolution of calculated column mass (eqn (2)) as a function of fluence. The data presented are the column mass of the observed (and quantified) species (Mobserved), of the unknown species (MUN) and of the desorbed species (MDES). The values for the sputtering yield Y was initially considered 0.25 molecules by each incoming soft X-ray photon (Bonfim et al.46), and then “fine-tuned” by considering that the slope in the curve MUN of must be similar to the slope of the Mobserved curve. Indeed, after chemical equilibrium is reached, both curves must exhibit a linear decrease with a weak slope (see dashed lines in Fig. 3). With this methodology the estimated values for sputtering yields Y in our experiments by soft X-rays are roughly 0.13 and 0.29 molecules per photon, for experiment at 20 K and at 80 K, respectively.
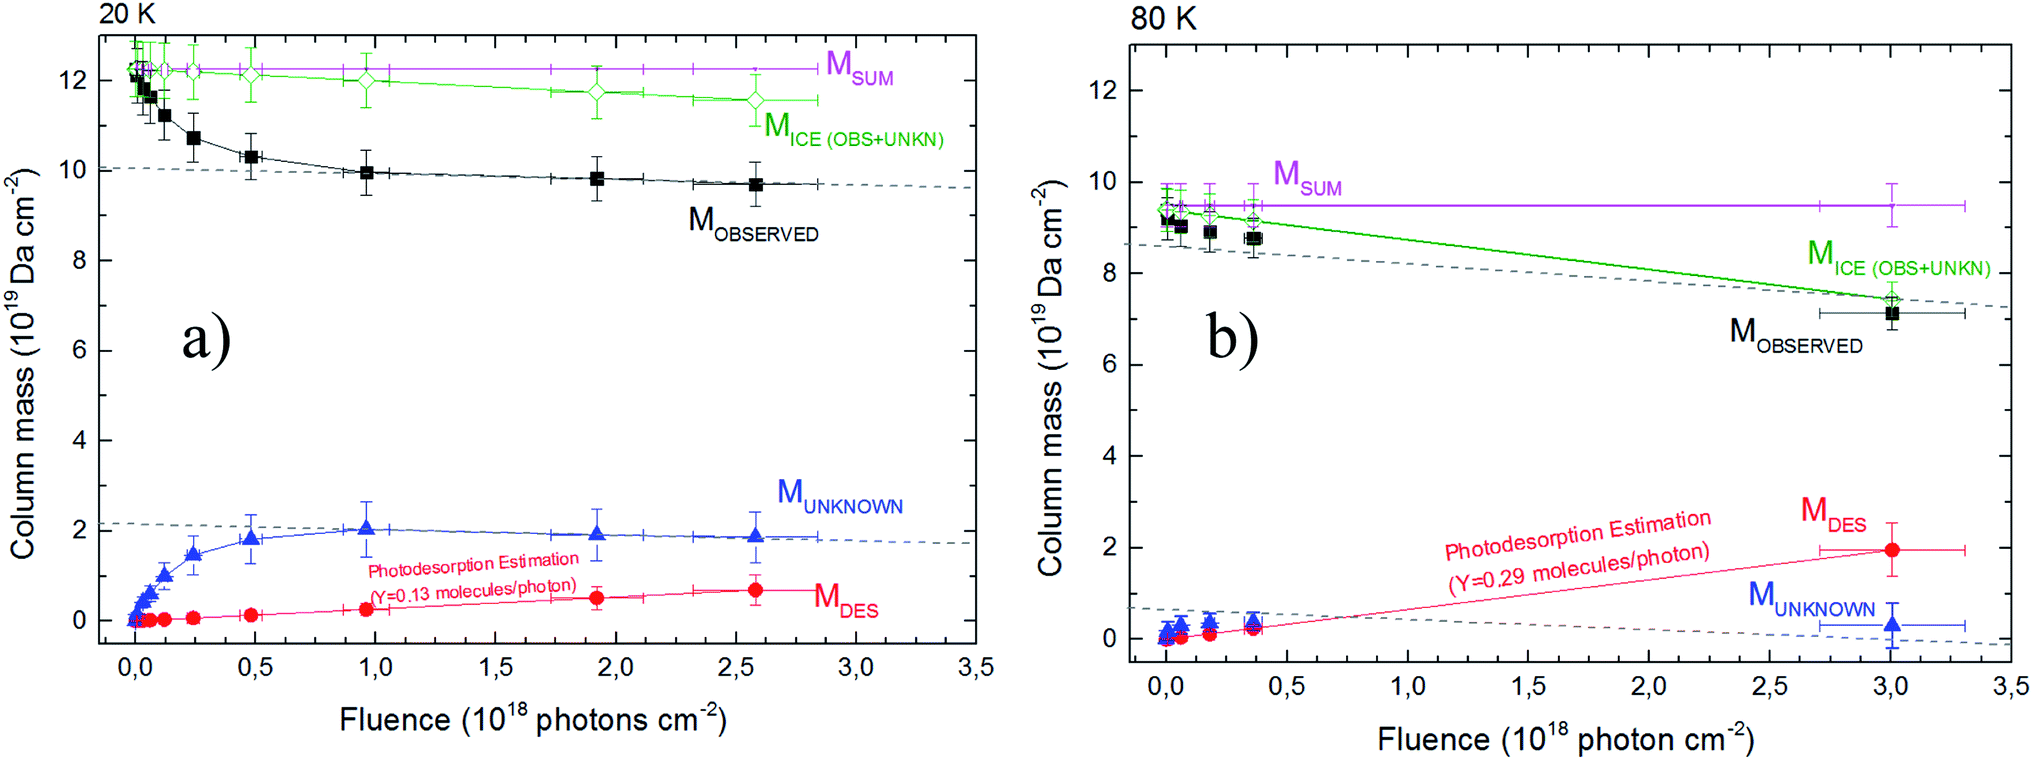 | ||
| Fig. 3 The calculated column mass of molecular species in the ices using infrared spectroscopy as a function of fluence. Panel (a) and (b) show the data from the experiment at 20 K and 80 K, respectively. The chemical equilibrium is reached when Mobserved and Munknown reach linear decrease (dashed lines) at large fluences (chemical equilibrium region). The total column mass (Msum) is given in pink color (representing a constant value). The column mass of desorption species is a linear function with the fluence as indicated by eqn (6). The sputtering yield modeled in both experiment are also indicated. Dashed lines (with equal slope in each figure) were employed to guide eyes. See details in the text. | ||
Ciaravella et al.,26 have determined the photodesorption yield for some new produced species, during X-ray photolysis of NH3-rich ices at 12 K, by employing a combination of mass spectrometry and infrared techniques. The authors, employing a broadband X-rays beam in the range between 250 and 1250 eV (with maximum at 700 eV) have obtained the following values, for some selected produced species (they detected more than 40 species), 1.94 × 10⁻⁵ and 3.17 × 10⁻⁵ for CH3NH2 and HNCO, respectively. Unfortunately, the authors did no quantified the total desorption induced by X-rays but, considering an average number of 40 produced species and an average number of ∼3 × 10⁻⁵ photodesorption yield (of an individual minor species) we can roughly estimate (as a lower limit) a total desorption yield for their experiment. The estimated value was around of 0.001 molecules per photon. This value was around 3 orders of magnitude lower than the estimated value obtained in the current work. Future experiments, focused on photo-desorption induced by X-rays in astrophysical ice analogs, considering also temperature of ices and energy of incoming photon, will help to clarify this issue. The photo-desorption of organics and inorganic species in astrophysical ices is relevant for the detection of such species in the gas-phase of cold environments, where organic synthesis in ice mantles should dominate.
The estimated the column density of desorbed species as a function of ion fluence can be obtained from the following equation:
 | (6) |
Fig. 4 presents the molecular abundance in percentage as a function of fluence for the studied sample. Panel (a) and (b) presents the calculated quantities for the experiment at 20 K and 80 K, respectively. The hatched region indicates the region in which chemical equilibrium happens. The fluence in which chemical equilibrium is reached (called equilibrium fluence, FE) is also indicated by the arrow near x-axis ion both panels. The values determined in this work were FE ∼2 × 10¹⁸ photons per cm2 and 3 × 10¹⁸ photons per cm2, for the experiment at 20 K and 80 K, respectively. A comparison between the current experiments indicates that warm/hot ices take slightly more time to reach chemical equilibrium during soft X-ray photolysis than very cold ices, which might be attributed to a processes such the opening of new reaction routes as function of temperature and/or the increasing of molecular diffusion inside the ices. However, since initial composition of ices is not exact the same, this small change in the FE may also be related with the initial molecular of the ice and should be investigated better in future works.
 | ||
| Fig. 4 Molecular abundance in percentage as a function of fluence for the studied sample. Panel (a) and (b) present the calculated quantities for the experiment at 20 K and at 80 K, respectively. The estimated value for unknown species are also displayed. Hatched region indicates chemical equilibrium region. Solid green line is the best fit employing an adapted version of eqn (1) considering the molecular abundance. Other lines are employed here only to guide the eyes. | ||
Additionally, in spite of the current datasets be representative and are in good agreement with previous experiments on irradiating of astrophysical ice analogs by strong ionizing radiation,10,16,23–25,29–32,46,49,50 additional experiments increasing the dataset at larger fluences help to decrease uncertainties in the determination of FE. Future experiment may also investigate different temperatures and radiation flux to extend the current work and better clarify the chemical equilibrium scenario, an important stage for ices irradiated at astrophysical environments.
The Equilibrium Branching Ratio (EBR) is defined as a relative abundance of a given species after the system reaches chemical equilibrium according to the expression:
 | (7) |
| Molecular species | EBR% (20 K) | EBR% (80 K) |
|---|---|---|
| a Father species. The values between brackets are the percentage abundances of parent species in the beginning of the experiments (non-irradiated ices).b It were not possible to be measured due to noise in the IR spectra and were considered equal to zero. This fact enhance the percentage of unknown species.c The procedure to calculate the percentage of unknown species takes in to account mass conservation, average mass of parent species in the beginning of experiment and mass induced desorption. See details in the text.d If we add here the percentages of NH4+, HCONH2 and CH3HCO, to make it comparable with the data obtained at 20 K, the EBR of unknown species at 80 K would be ∼20.4 (∼30% higher than the unknown species at 20 K). | ||
| H2Oa | 61.9 [74.6] | 49.6 [ 60.8] |
| CO2a | 9.6 [10.5] | 13.3 [17.9] |
| CH4a | 6.2 [7.8] | 1.1 [1.7] |
| NH3a | 4.8 [7.1] | 9.4 [19.6] |
| OCN− | 0.14 | 0.5 |
| CO | 1.7 | 4.0 |
| CO3 | 0 | 0.14 |
| CH3OH | 0.54 | 0.51 |
| H2O2 | 0 | 0.78 |
| HCOO− | 0 | 0.29 |
| NH4+ | 0 ?b | 0.39 |
| HCONH2 | 0 ?b | 8.0 |
| CH3HCO | 0 ?b | 7.3 |
| Unknownc | 15.1 | 4.7d |
The procedure to calculate the percentage of unknown species takes in to account mass conservation, average mass of parent species in the beginning of experiment and mass induced desorption as discussed previously. Since we could quantify more species in experiment at 80 K than at experiment at 20 K (due to better signal to noise ration in the spectra) the percentage of unknown species were lower than in the case of experiment at 20 K. However, in attempt to make data set of the experimental at 80 K comparable to the 20 K experiment, we can add the percentages of NH4+, HCONH2 and CH3HCO to the percentage of unknown species. This procedure will produce and extended unknown percentage of ∼20.4 for the data obtained at 80 K (∼30% higher than the unknown species percentage at 20 K).
Fig. 5 presents the EBR% values in a bar diagram to allow an easily comparisons between both experiments. The arrows with number on top are a representation of the molecular abundances decreasing during ice processing, the number themselves indicate the initial molecular abundances of parent species in the ices (before irradiation). The consumption of NH3 and CO2 was higher for the ice at 80 K suggesting an broad set of reacting routes involving such species at this temperatures than at 20 K. Moreover, we also observe that independent of the initial abundances and ice temperature, the abundance of methanol in the equilibrium is virtually the same, roughly 0.5. Additionally, we also noted that the abundance of CO seems to be correlated with the abundances of the initial CO2, as well as, the abundance of OCN− with the its parent species NH3. The amount of detected new species in the experiments at 80 K was higher than at 20 K also suggesting a richer chemistry in the bulk of the triggered by X-ray photolysis (as well as its primary and secondary induced electrons) at higher ice temperature. Curiously, the consumption of CH4 seems to be higher in the photolysis of ice at 20 K and the consumption of NH3 and CO2 higher in the ice at 80 K.
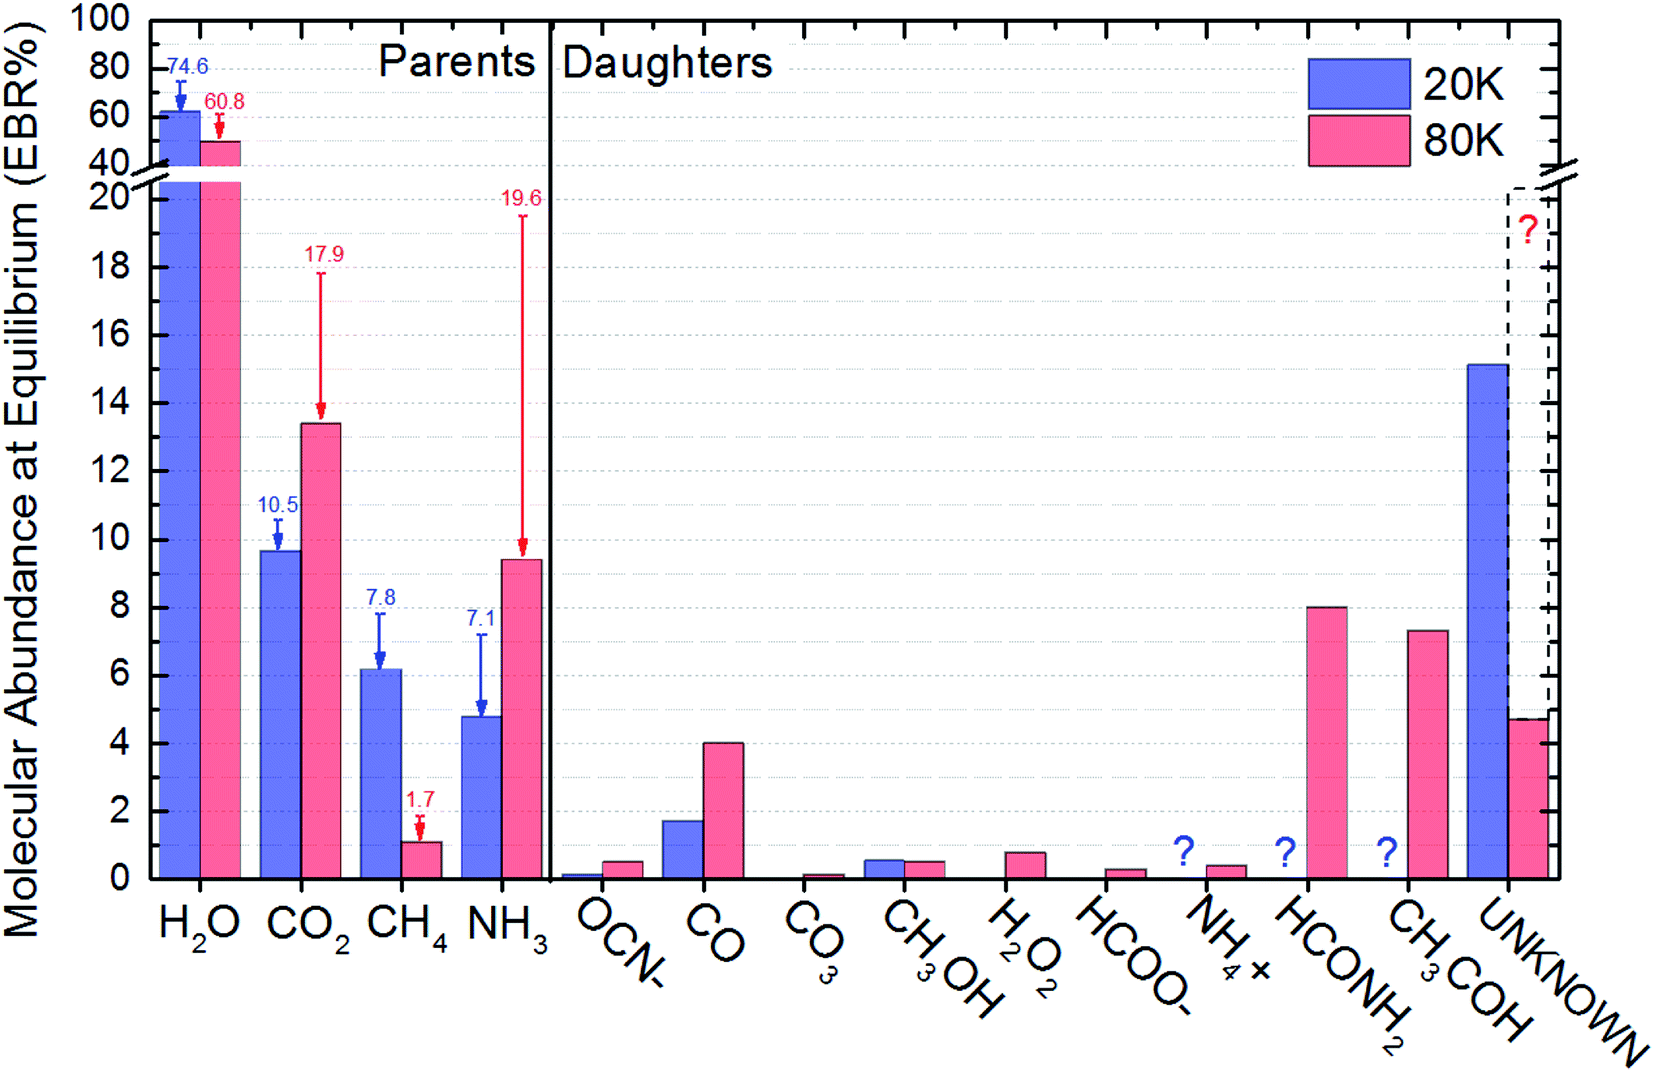 | ||
| Fig. 5 Comparison between the molecular abundance at chemical equilibrium in the two experiments (mixed ice containing H2O:CO2:CH4:NH3 at 20 K and 80 K irradiated by soft X-rays photons). Arrows and numbers in the left indicates the abundances at the beginning of the experiments. All daughters species have zero abundance in the beginning of the experiments. See other details in the text. | ||
The abundance of CH3OH in the equilibrium chemistry was virtually the same for both experiments indicating that the differences in initial abundances and ice temperatures does not play an important rule in the reaction pathways involving this daughter species. Future investigation may focus on this issue.
Some species are not able to be quantified in the experiment at 20 K due to low signal to noise and were indicated as a question mark in this Fig. 6 (and also at Table 3). The dashed box in right part this figure above the estimated abundances of the unknown species at 80 was produced by considering the percentages of NH4+, HCONH2 and CH3HCO into this category of unknown species. This procedure allows the comparison of the production of unknown species between the to experiments investigated.
 | ||
| Fig. 6 Changes in OHdb profile (∼3650 cm−1) in the experiments. (a) Compaction effect due to X-rays: evolution of OHdb feature of sample at 20 K (experiment E20K) as a function of photon fluence; (b) pore collapse during ice heating: evolution of OHdb feature of un-irradiated sample as a function of temperature during heating phase from 12 K (sample deposition) to 80 K (experiment E80K). For comparison purpose, blue dot indicates the value for the irradiated sample (at the final fluence of 3.1 × 10¹⁸ photons per cm2). Both inset panels illustrate the part of IR spectra showing the evolution of OHdb feature. See details in the text. | ||
Finally, is important to note that the chemical equilibrium is a function of the initial chemistry, the incoming radiation (type and fluence), the pressure, as well as, the ice temperature. Since in the current work we employ for both ices the same radiation field and pressure, the main differences observed in cross sections, desorption and chemical equilibrium scheme (abundances and equilibrium fluence) are due to some combination of temperature and initial composition of the samples. Further study will determine which, if either, is dominant.
3.4 The evolution of OHdb featuring
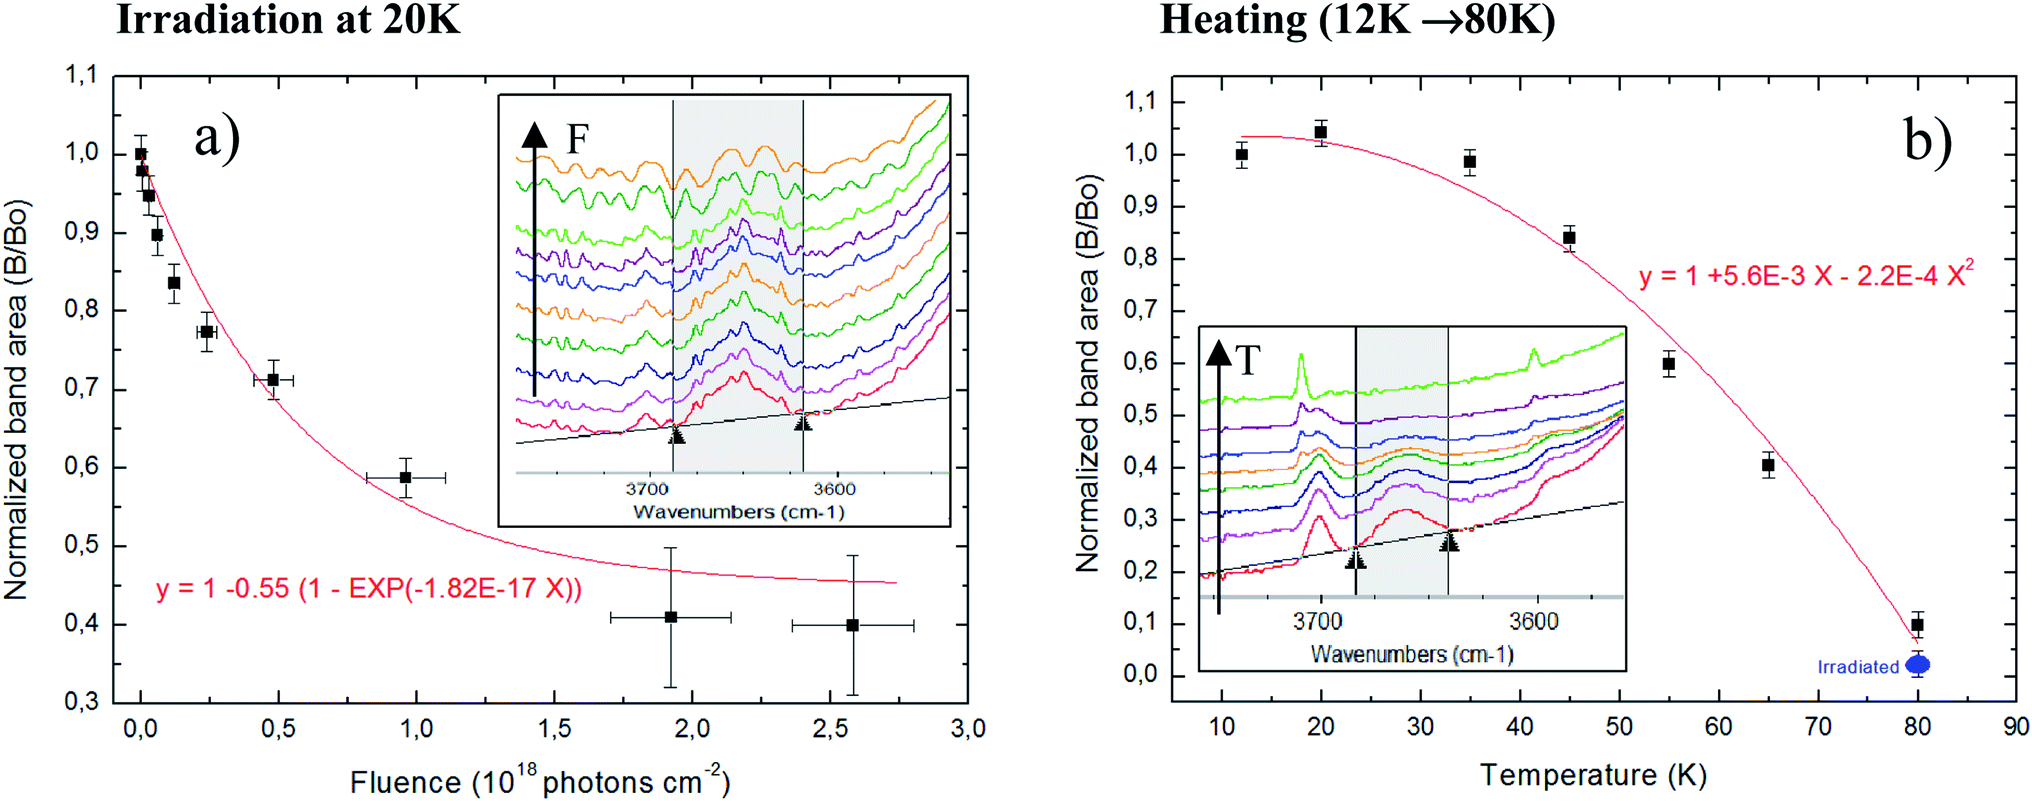
The evolution of OHdb (O–H dangling band in the cavities of water-rich ices) as a function of ice processing by radiation have been studied extensively in the literature.31,51–55 This band, centered around 3650 cm−1, is very sensitive to the density of ices (porous contents) since is attributed to water molecules partially bounded inside cavities or pores in the ices.55Pilling et al.,31 evaluating the decreasing of OHdb feature as a function of fluence, have determined the compaction cross section in a similar ice (H2O:CO:NH3) mixture at low temperature during bombardment with swift ions (46 MeV Ni+13). The authors have found a compaction cross section of 1 × 10⁻¹¹ cm−2 which could be assumed as typical compaction cross section for cosmic ray bombardment of interstellar ices. Here, following similar procedure using OHdb feature, we determined the effective compaction cross-section due to typical X-rays in astrophysical ices. The obtained value in the current work is 1.8 × 10⁻¹⁷ cm−2, roughly 6 order of magnitude lower than impinged by MeV ions.
Fig. 6 present the changes in the OHdb profile (∼3650 cm−1) in the studied ices. Panel (a) shows the evolution of OHdb feature of sample at 20 K (experiment E20K) as a function of photon fluence and the employed fit function that best fit the experimental data. Inset figure shows the OHdb feature decreasing in the infrared spectra at different fluences. The function that best fit the experimental data was the following associative exponential function to the experimental data to quantify the evolution of OHdb feature with the fluence
| B/B0 = 1 − 0.55(1 − e−1.8×10⁻¹⁷F) | (8) |
Additionally to the compaction effect produced by sample processing due to radiation, we also observe, that during the initial heating of phase of experiment E80K (from 12 to 80 K), a decreasing in the OHdb feature in the IR spectra which indicates pore collapse now related with molecular diffusion enhancement. Fig. 6b shows the pore collapse during ice heating (induced by morphological changes and molecular diffusion mainly by small and high volatile species such as CH4 and CO2): evolution of OHdb feature of un-irradiated sample as a function of temperature during heating phase from 12 K (sample deposition) to 80 K (experiment E80K). Inset figure shows the OHdb feature decreasing in the infrared spectra in spectra taken at different temperature during heating. A review about the collapse of ice pores due to heating or radiation processing is given elsewhere.55–58
The equation that best describe the band area decreasing as function of temperature was the following parabolic function
| B/B0 = 1 + 5.6 × 10⁻³ T − 2.2 × 10⁻⁴ T2 | (9) |
The OHdb in an important band in the spectrum of astrophysical ices because it might reveal the degree of compaction of such ices that might be linked with processing by radiation (momentum transfer) or by thermal annealing (energy transfer).51,55–58
4. Astrophysical implication
The current icy data containing initially the species H2O (majority), CO2, CH4 and NH3 can be employed to simulate, in the laboratory, some space environments, such as, the surface of Enceladus moon, comets, surfaces of outer solar system bodies, ices in the vicinity of young stellar objects (YSOs) and ices inside dense molecular clouds. All these environments are also exposed to ionizing photon field that breaks chemical bonds, produce radicals and induce molecular formation and trigger desorption processes.4.1 Timescale to reach chemical equilibrium
With the knowledge of the fluence to reach chemical equilibrium taken from the experiments, we can calculate the timescale to reach chemical equilibrium (TSE) in the lab and also at different space environments by employing the equation
 | (10) |
Following the methodology described at Pilling and Bergantini10 and references therein, we estimated photon fluxes in selected regions in space, inside solar system and around some young stellar objects (YSOs) to apply current experimental data. Table 4 list the estimated photon flux (from 6 to 2000 eV) for some selected space environments and the timescale to reach chemical equilibrium for ices at 20 K and 80 K calculated employing eqn (10).
| Space environment | Estimated photon fluxa (cm−2 s−1) | TSE (20 K) (year) | TSE (80 K) (year) | Reference and comments |
|---|---|---|---|---|
| a VUV and soft X-rays (from 6 eV to 2000 eV). | ||||
| KBOs typical orbit (∼40 AU) | 5 × 10³ | 1.2 × 10⁷ | 1.9 × 10⁷ | Adapted from Pilling and Bergantini10 and Gueymard59 and considering r−2 law |
| Triton orbit (∼30 AU) | 9 × 10⁶ | 7.0 × 10³ | 1.1 × 10⁴ | Adapted from Pilling and Bergantini10 and Gueymard59 and considering r−2 law |
| YSO model 1 (flux at 30 AU) | 1 × 10⁶ | 5.7 × 10⁴ | 9.5 × 10⁴ | Adapted from Walsh et al.60 considering a distance of 30 AU |
| Saturn orbit (∼9.5 AU) | 8 × 10⁹ | 7.4 | 12 | Adapted from Pilling and Bergantini10 and Gueymard59 and considering r−2 law |
| YSO model 2 (e.g. for TW Hydra at 40 AU) | 9 × 10¹¹ | 6.5 × 10⁻² | 1.1 × 10⁻¹ | Adapted from Fantuzzi et al.61 at 1 AU. Considering r−2 law and non-attenuated flux |
| Earth orbit (Sun typical flux at 1AU) | 3 × 10¹³ | 1.9 × 10⁻³ | 3.2 × 10⁻³ | Gueymard59 |
| Lab | 1 × 10¹⁴ | 5.8 × 10⁻⁴ | 9.3 × 10⁻⁴ | SGM beam line in off-focus and white beam mode at the LNLS/CNPEN synchrotron light source at São Paulo/Brazil10 |
| YSO model 3 (typical flux at 1 AU) | 6 × 10¹⁵ | 9.6 × 10⁻⁶ | 1.5 × 10⁻⁵ | Adapted from Siebenmorgen & Krügel.12 Considering non-attenuated flux |
Specifically in the YSO's scenario, Walsh et al.60 estimated the X-ray flux at a distance between 10–50 AU in the order of 105–107 photons per cm2 per s. The radiative transfer simulation shoed that the dust temperature in the disk at 50 AU above the midplane was around 30 K. Taking into account the equilibrium fluence obtained in this paper for the experiments at 20 K, the timescale to reach the chemical equilibrium in such YSOs varies between 6 × 10³–6 × 10⁵ years. Nevertheless, radiative transfer models by Kamp et al.,62 suggests that the H2O ice layer is formed for heights lower than 30 AU. This would indicated the ices inside protoplanetary disks are not processed directly by X-rays itself, which increases the TSE to timescales larger than the disk dissipation, that could reach 107 year, according to new submillimeter observations.63
An comprehensive plot to easily identify the timescale to reach chemical equilibrium (TSE) as a function of photon flux (mainly soft X-rays) impinging in water-rich ices (containing initially H2O (mainly), CO2, CH4 and NH3) are shown in Fig. 7. Vertical lines show the flux of selected space environments illuminated by in VUV and soft X-rays, as well as, the laboratory photon flux employing in this work, for comparison purpose. In the case of Enceladus moon, we observe that considering only the incoming solar VUV and soft X-rays, the estimated timescale to reach chemical equilibrium is around 7–12 years (low value for low temperature ices). This might suggest that places with lower temperatures in frozen space bodies may have reach chemical equilibrium first than hot surfaces.
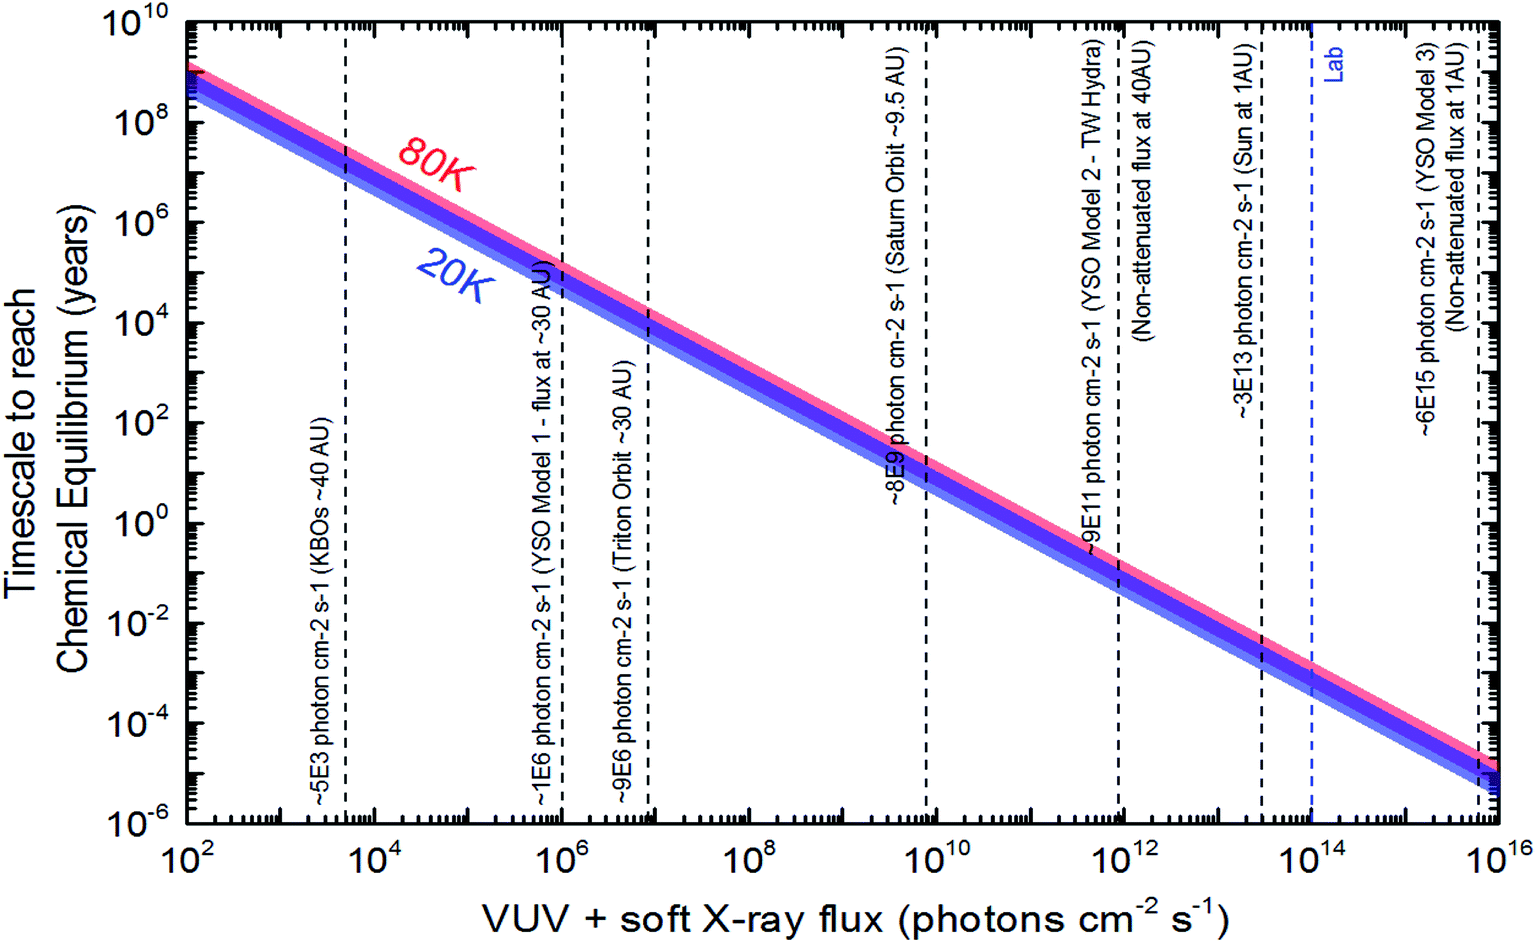 | ||
| Fig. 7 Timescale to reach chemical equilibrium (TSE) as a function of photon flux for the studied samples (ice mix containing initially H2O, CO2, CH4 and NH3). Vertical lines show the flux of selected space environments rich in VUV and soft X-rays. Red and blue profiles refer to experiments at 20 K and 80 K, respectively. | ||
Bergantini et al.,43 also employing infrared spectroscopy have studied similar ice mixture at 20 K, in the presence of ionizing 1 keV electron beam. From their data (Fig. 4), we estimated that fluence to reach chemical equilibrium in case of electron bombardment of roughly 2 × 10¹⁸ electrons per cm2. Considering the 1 keV electron flux in Enceladus surface of ∼2 × 10⁵ electrons per cm2 per s (adapted from Paranicas et al.64) and employing eqn (10) we calculate a timescale to reach chemical equilibrium due to electrons of roughly 3 × 10⁵ years. This value is much larger than the timescale determined in the current manuscript employing broad band ionizing photons and might suggest that photo-chemistry may have a stronger rule than chemistry triggered by electron bombardment at Enceladus surfaces. However, such comparison should be done with caution because here we only considered the effects of 1 keV and not the chemical changes induced by a broadband energies of electrons that should impinge the surface of Enceladus in the real situation. Another complication is that 1 keV electrons only penetrate up to 60 nm in the ice while other ionizing agents, such as X-rays and, especially, cosmic rays, may penetrate several times deeper than this, resulting in even more complex physicochemical effects.
A comparison between the results of radiochemistry (ion and electron bombardment) and X-ray induced photochemistry (X-ray irradiation) of astrophysical ice analogs presents lots of similarities indicating that both penetrating and ionizing agents can change considerably the chemistry of frozen species in space.22,31,43,50
4.2 X-ray induced desorption in space environments
The quantification of molecular desorption induced by X-rays for the studied samples after reach chemical equilibrium and its implication in selected space environments is seen in Fig. 8. Left panels presents data from experiment at 20 K and right panels for experiment at 80 K. Panels (a1) and (a2) presents the molecular desorption flux (individual and total) as a function of ionizing photon flux (vertical lines indicates flux at selected space environments, including some regions inside solar system and around young stellar objects at different distances). For example, at Saturn orbit the total desorption flux for ices at 20 K (panel (a1)) due to incoming X-rays is around 109 molecules per cm2 per s and the desorption of the individual species OCN− is 106 molecules per cm2 per s. For ices at 80 K (panel (a2)) the desorption flux is higher at higher temperatures and the individual desorption of OCN− is around 107 molecules per cm2 per s. Panels (b1) and (b2) presents total desorption flux as a function of time in space environments. In these panels each sloped line represents a specific region in space (with the X-ray flux indicated). For example, the total desorption at Saturn orbit during a timescale of 103 years is ∼3 × 10¹⁹ molecules per cm2 and ∼1020 molecules per cm2, for ices at 20 K and 80 K, respectively.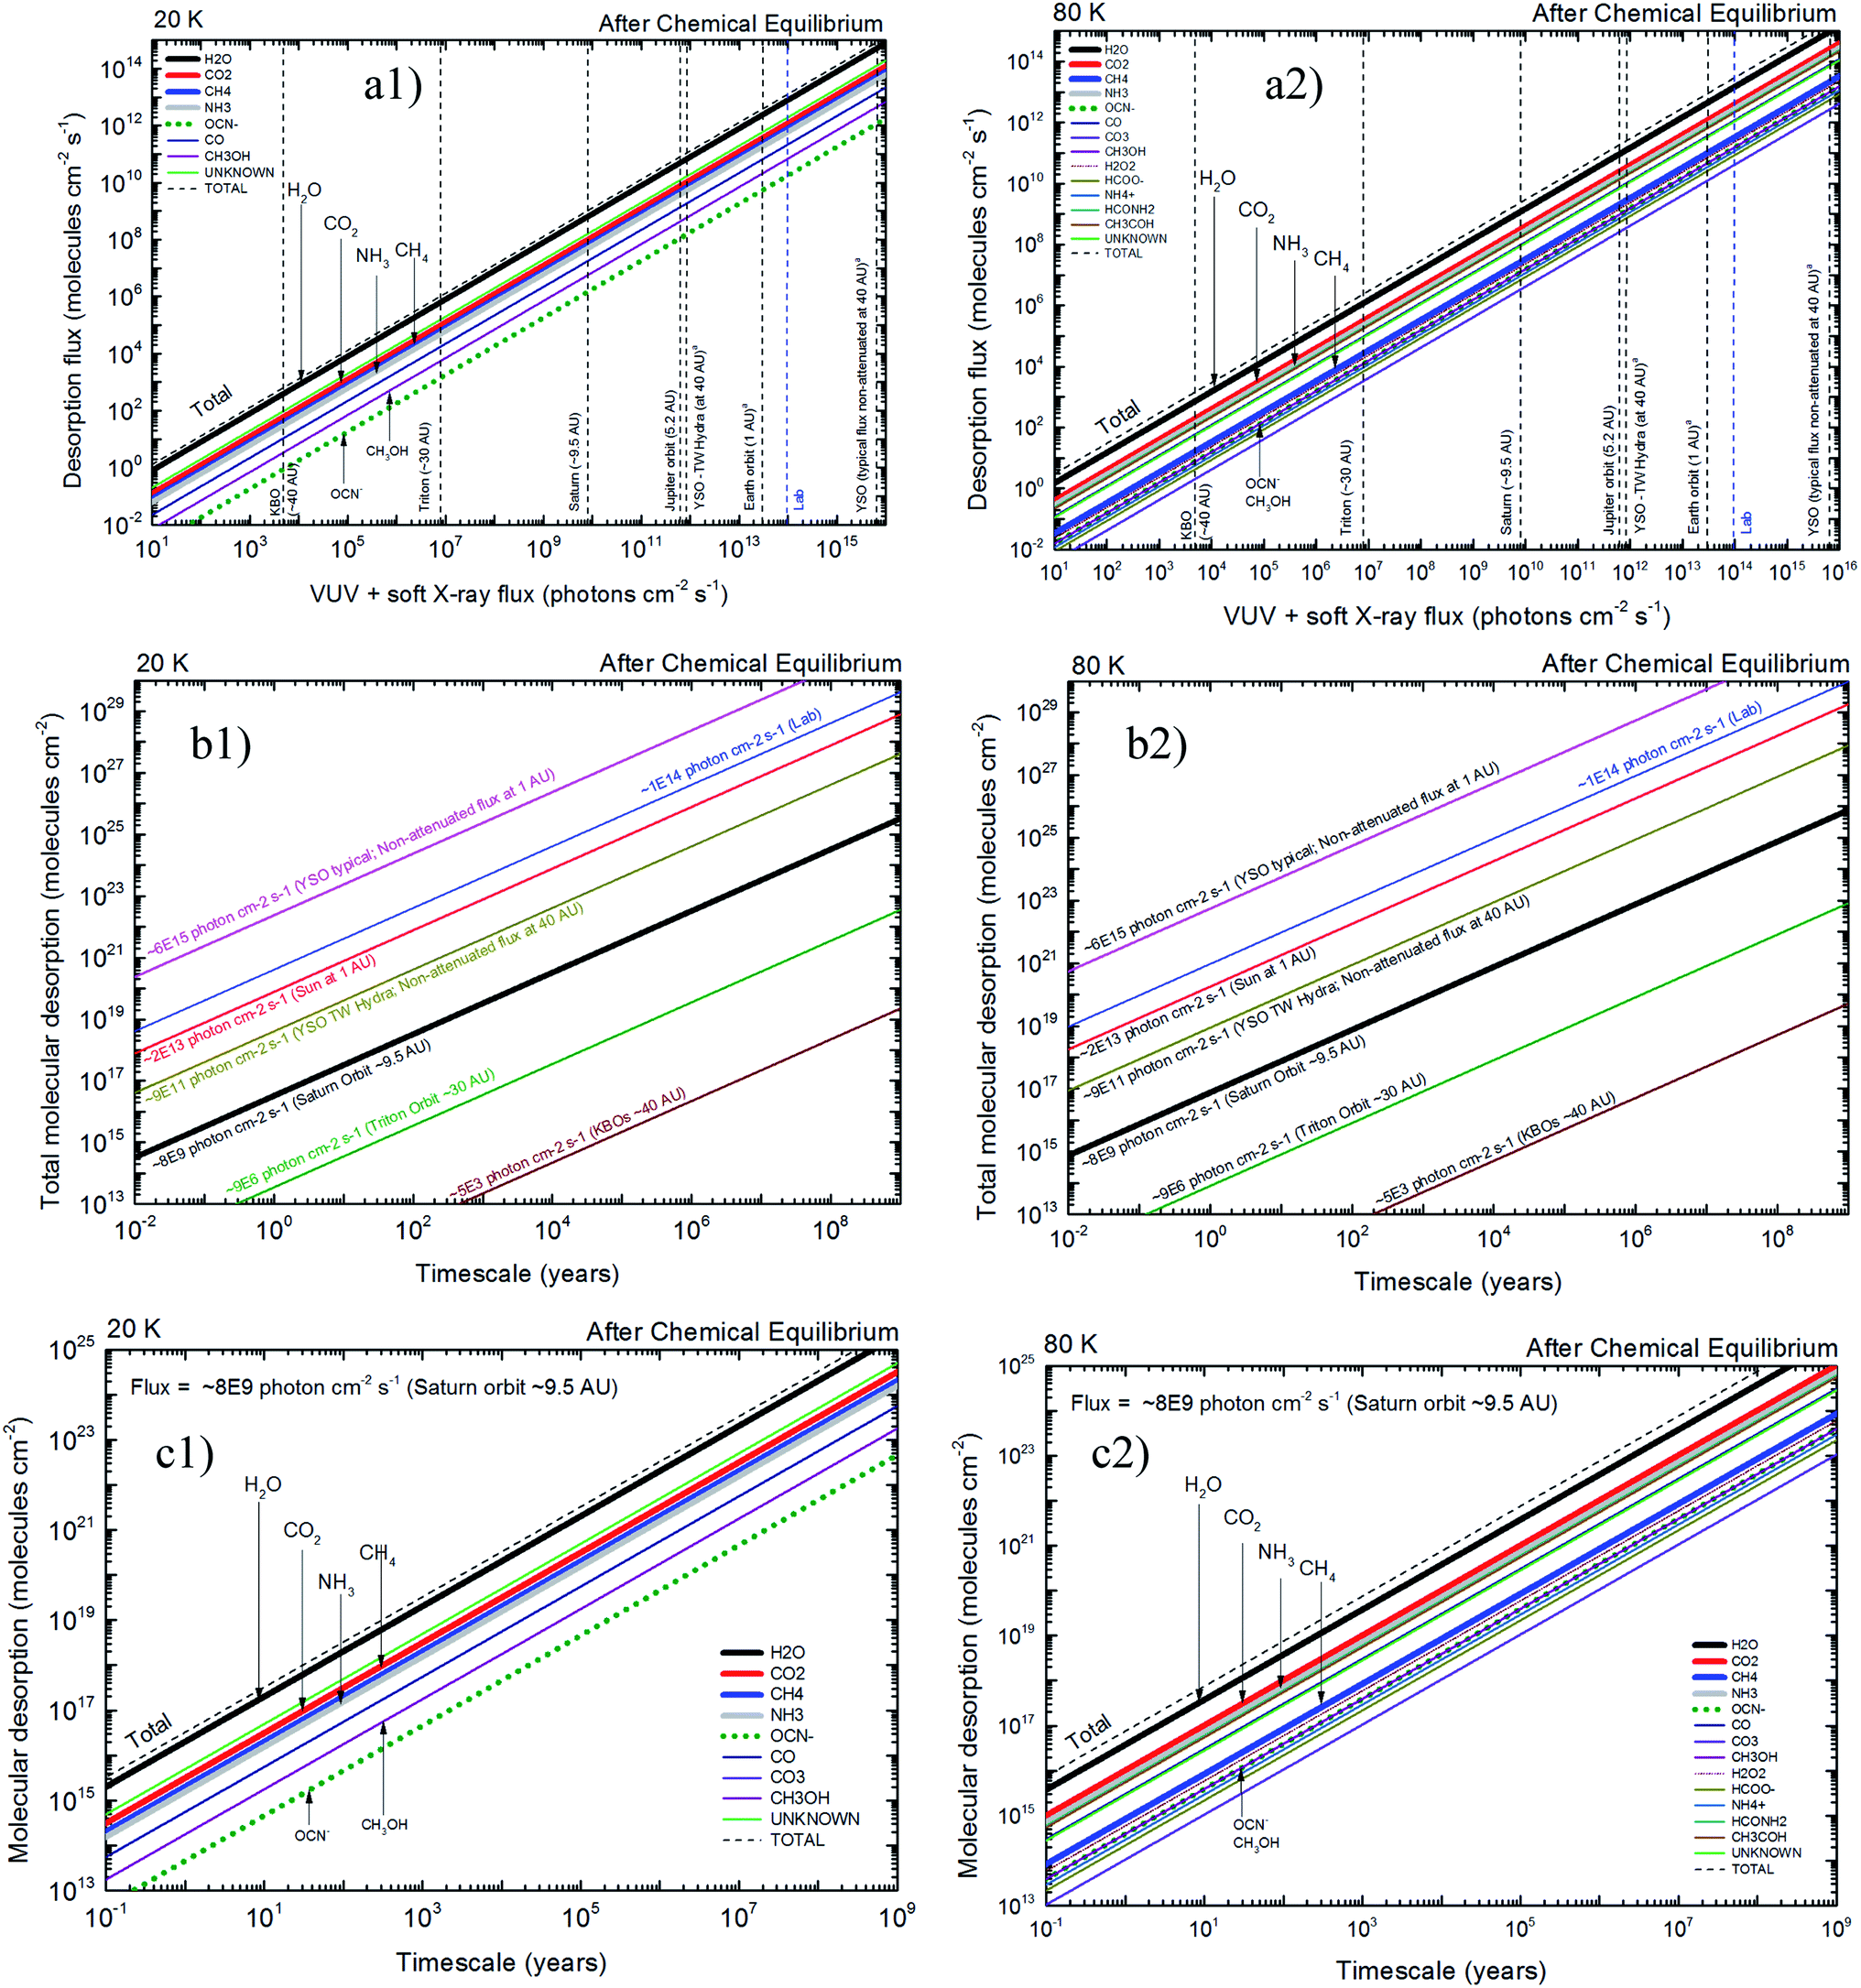 | ||
| Fig. 8 Implications of molecular desorption induced by X-rays in astrophysical environments for the studied samples after reach chemical equilibrium (left panels experiment at 20 K and right panels experiment at 80 K). Panels (a1) and (a2) presents the molecular desorption flux (individual and total) as a function of ionizing photon flux (vertical lines indicates flux at selected space environments). Panels (b1) and (b2) presents total desorption flux as a function of time in space environments (each sloped line is the function for a specific region in space). Panels (c1) and (c2) presents the molecular desorption at Saturn orbit as a function of time (e.g. direct application for Enceladus desorption induced by X-rays). | ||
Panels (c1) and (c2) of Fig. 8 presents the molecular desorption at Saturn orbit (VUV and X-ray flux ∼8 × 10⁹ photons per cm2 per s) as a function of time for ices at 20 K and 30 K, respectively. These panels have direct application for desorption induced by X-rays at Enceladus polar and equatorial surfaces. For example, during a timescale of 103 years the H2O desorption by X-rays was estimated to be 2 × 10¹⁹ molecules per cm2 and 4 × 10¹⁹ molecules per cm2, for ices at 20 K and 80 K, respectively. Additionally, the data at 80 K indicates that the desorption of NH3 is almost roughly 10 times higher than for CH3OH. Considering the daughters species (not present initially in the ice) we observe that at 20 K the desorption of OCN− is roughly the half the value estimated for CH3OH but at 80 K it is comparable to the value of CH3OH (e.g. 4 × 10¹⁷ molecules per cm2 during 103 years). These estimation help us to better understand the gas phase abundance and its chemistry in the vicinity of such ices exposed to X-ray radiation.
A comparison between a simulated mass spectra of desorbed species from both experiments with the mass spectra obtained by Cassini spacecraft65 in the vicinity to Enceladus is presented in Fig. 9. In this figure, panel (a) and panel (b) show the desorbed mass spectra for experiments at 20 K and 80 K, respectively. Panel (c) shows the same region of mass spectra obtained by Cassini spacecraft during on of flight-by over Enceladus moon (adapted from Waite et al.65). To simulate the mass spectra of desorbed species induced by X-rays, we employ individual mass spectra for selected species taken from the NIST database (https://webbook.nist.gov) and, after normalization, we multiply it by the molecular abundances determined in the experiments in two regimes as shown in Fig. 9a and b (one at the beginning of the experiments to simulate mass spectra of samples with low processing and other at the chemical equilibrium phase – highly processed sample and composition independent of radiation fluence). The selected species employed to create simulated mass spectrum were H2O, CO2, CH4, NH3, CO, CH3OH, HCONH2 and CH3HCO. Due to the lack of mass spectra in the NIST database for the other daughter species such as OCN−, CO3, H2O2, HCOO− and NH4+, as well as, due to the lack of information about unknown species, they were not considered in these mass spectra simulation.
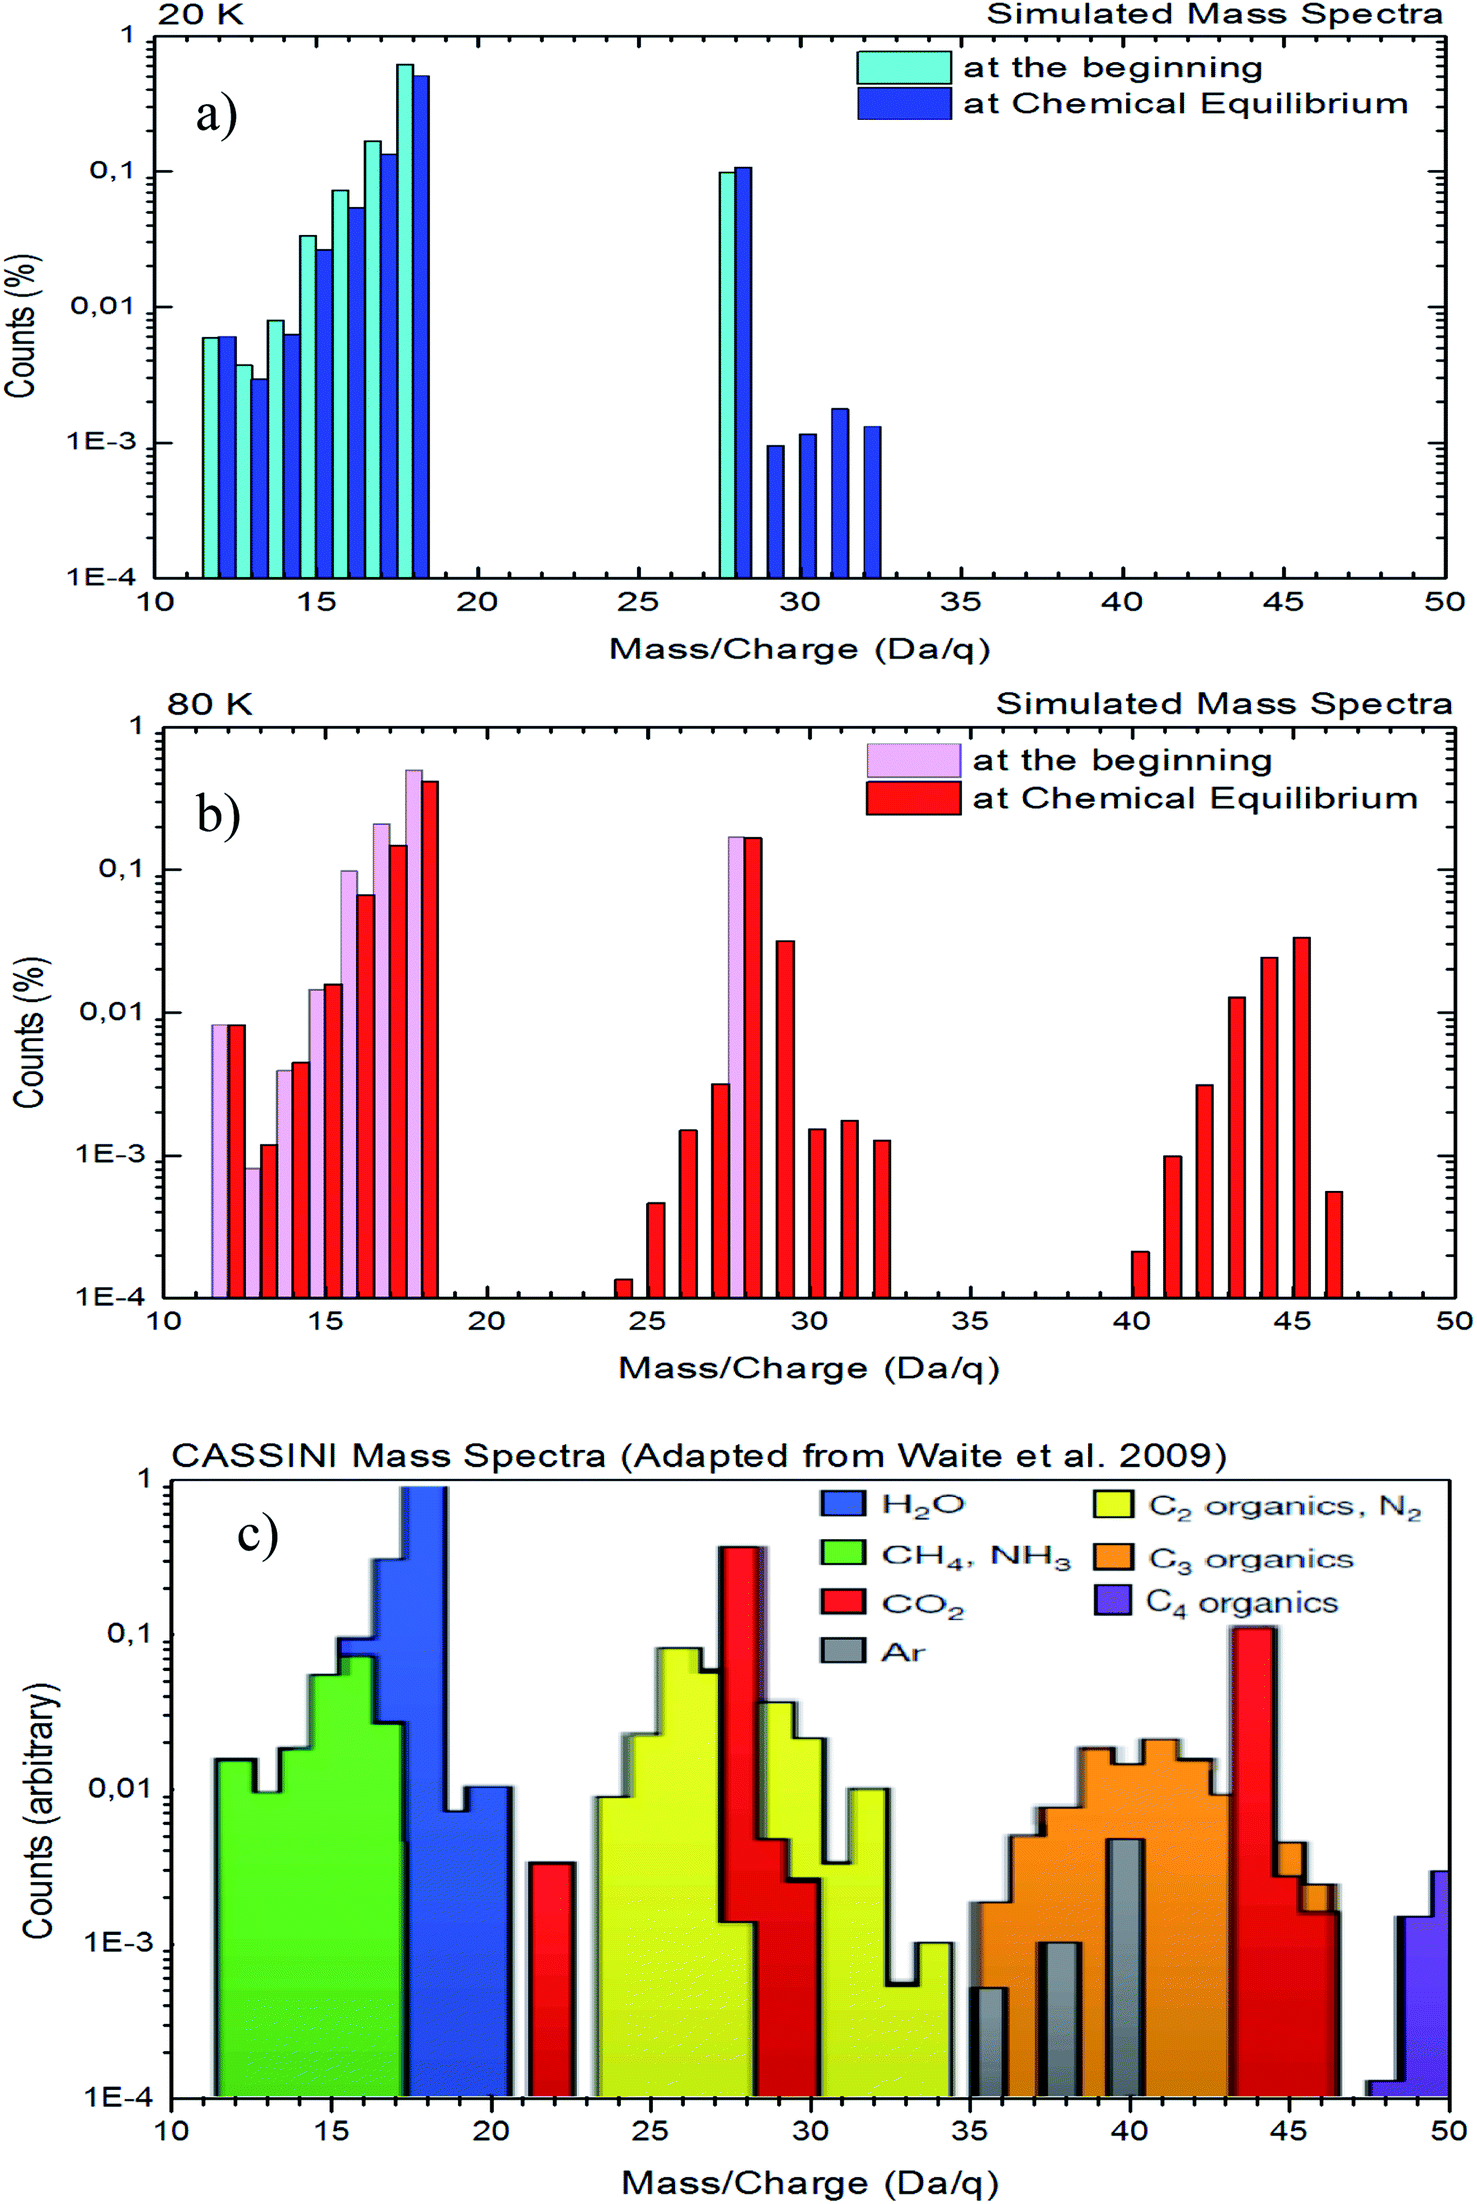 | ||
| Fig. 9 Comparison between the simulated mass spectra of desorbed species from both experiments with the mass spectra obtained by Cassini spacecraft during its flight-by over the Enceladus (adapted from Waite et al.65). Panels (a): experiment at 20 K, panel (b): experiment at 80 K, and panel (c): data from Cassini. See details in the text. | ||
In Fig. 9, we observe a good similarity between the simulated mass spectra at 80 K with the mass spectrometry data taken by the Cassini spacecraft in the vicinity of Enceladus65 (mainly at regions with masses from 24 to 32 and from 40 to 46). Although higher mass (up to 80) fragments were detected by Cassini spacecraft in the vicinity of Enceladus,65 in the current experiments (and with the employed methodology) we do no observe any desorption fragment with mass higher than 47. This might suggest that other types of radiation, such as cosmic rays, energetic solar particles, or even energetic ions from Saturn magnetosphere may play an important rule in the production of higher molecular complexity, assigned to the higher masses, on the mass spectrum collected by Cassini spacecraft in the vicinity of Enceladus. The comparison between 20 K and 80 K data also indicates that gas-phase chemistry close to hot regions of Enceladus might be richer than near cold surface regions.
Recently, Dupuy et al.66 have also investigate the photodesorption induced by X-rays in astrophysical ice analogs. Employing X-rays from SOLEIL synchrotron and the total electron yield (TEY) technique, the authors estimated the H2O photodesorption of ∼10−2 molecules per photon (value considering broadband photons up to 2 keV) for a 15 K water-rich. This value is one other of magnitude less than the value estimated employing FTIR spectroscopy performed by the current work. Both works reinforce the importance of such parameter in the modeling of astrophysical regions such as cold surfaces inside solar system and inside young stellar systems, ices in protoplanetary disks or X-ray-dominated regions.
5. Conclusion
We present an experimental study on the photolysis of two water-rich ices containing also CO2, CH4 and NH3 in the presence of broadband soft X-rays. The employed methodology is an attempt to simulates the photochemical processing (as well as the chemistry triggered by primary and secondary electrons induced in the process) and photodesorption processes induced by X-rays in frozen surfaces at space environments, such as the surfaces of Enceladus moon, outer solar system bodies and icy grains in the interstellar medium. The experiments were performed employing broadband synchrotron light (from 6 to 2000 eV, mainly soft X-rays and small fraction of VUV) in the solid samples at temperatures of 20 an 80 K, and the icy sample were monitored by infrared spectroscopy.For the current experiments the main conclusion are the following:
(i) The determined effective destruction cross section were between 0.2–8.5 × 10⁻¹⁸ cm2. The major differences in the effective destruction cross section were seen for CO2 (4.2 times higher for experiment E20K) and CH4 (16 times higher for experiment E20K). For H2O and NH3, the destruction cross section obtained at 80 K were slightly higher than the obtained value at 20 K.
(ii) The photolysis of the frozen sample produced a lot of new species, including OCN−, CO, CO3, CH3OH, H2O2, HCOO−, NH4+, HCONH2 and CH3HCO, although mostly of them were only possible to be detected in the ice with temperature at 80 K. The effective formation cross section were also determined which were slightly higher for the experiments performed at 80 K. A methodology to estimate the amount of unknown species was provided.
(iii) The compaction cross section induced by X-rays in the sample at 20 K were determined from the evolution of OHdb feature around 3650 cm−1. The obtained value was 1.8 × 10⁻¹⁷ cm−2, roughly 6 order of magnitude lower than impinged by MeV ions.31 We also identify a decreasing parabolic-like function dependence between ice porosity and temperature enhancement (during heating of unirradiated ice from 12 K to 80 K).
(iv) The studied samples reach chemical equilibrium at fluence around 2–3 × 10¹⁸ photons per cm2 (slightly higher for the experiment at 80 K, indicating that ice temperature has a small effect on the time to reach chemical equilibrium for the studied samples). The molecular abundances at chemical equilibrium was determined. Such quantities have strong importance for astrophysical models since once chemical equilibrium is reached in a space environment (kept at a constant temperature) the molecular abundances do not change with time even during continuous and extended ice processing by radiation. Timescales to reach chemical equilibrium in different space environments illuminated by X-rays were estimated. It is important to note that due to the different initial compositions and temperatures employed for the two water-rich ices studied (containing also CO2, CH4 and NH3) a degeneracy on the influence of the abundance of parent species and ice temperature is expected for the chemical equilibrium phase and its physicochemical parameters. Further experiments irradiating different sample composition at same temperature, as well as, similar ices irradiated at different temperatures may help to clarify this temperature/initial abundance degeneracy on physicochemical parameters of ices at large fluences.
(v) Desorption yield induced by X-rays (in chemical equilibrium stage) was estimated and the values was around 0.13–0.29 (roughly two times greater for the experiment at 80 K). The estimated desorbed species in the current methodology have a good similarity when compared with data obtained by Cassini spacecraft over Enceladus, suggesting that X-rays might also play an important rule an the chemistry in this moon.
Besides the application on the surface chemistry of Enceladus, the data quantified and discussed in this manuscript can be applied to several other water-rich frozen surfaces containing also CO2, NH3 and CH4. This my help to clarifies issues and radiation effects induced at other outer solar system bodies as well as, icy grains in space environments highly illuminated by X-rays such the ones in the vicinity of young stellar objects.
Conflicts of interest
There are no conflicts to declare.Acknowledgements
The authors acknowledge the FVE/UNIVAP and the Brazilian research agencies CNPq (projects #304130/2012-5; #306145/2015-4; #302985/2018-2), FAPESP (projects JP 2009/18304-0, DR 2013/07657-5, PD 2015/10492-3), CAPES and INCT-A. The authors also acknowledge the staff of LNLS/CNPEM and UNIVAP for their invaluable support.References
- A. G. G. M. Tielens and D. Hollenbach, Astrophys. J., 1985, 291, 722 CrossRef CAS.
- P. R. Maloney, D. J. Hollenbach and A. G. G. M. Tielens, Astrophys. J., 1996, 466, 561 CrossRef CAS.
- J. R. Goicoechea, N. J. Rodriguez-Fernandez and J. Cernicharo, Astrophys. J., 2004, 600, 214 CrossRef CAS.
- Th. Henning and D. Semenov, Chem. Rev., 2013, 113, 9016 CrossRef CAS PubMed.
- N. F. W. Ligterink, A. Coutens and V. Kofman, et al., Mon. Not. R. Astron. Soc., 2018, 469, 2219 CrossRef.
- J. K. Jørgensen, H. S. P. Müller and H. Calcutt, et al., Astron. Astrophys., 2018, 620, A170 CrossRef.
- H. Calcutt, J. K. Jørgensen and H. S. P Müller, et al., Astron. Astrophys., 2018, 616, A90 CrossRef.
- A. Coutens, N. F. W Ligterink and J.-C. Loison, et al., Astron. Astrophys., 2018, 623, L13 CrossRef.
- S. Manigand, H. Calcutt and J. K. Jørgensen, et al., Astron. Astrophys., 2019, 623, A69 CrossRef CAS.
- S. Pilling and A. Bergantini, Astrophys. J., 2015, 811, 151 CrossRef.
- K. Imanishi, M. Tsujimoto and K. Koyama, Astrophys. J., 2002, 572, 300 CrossRef CAS.
- R. Siebenmorgen and E. Krügel, Astron. Astrophys., 2010, 511, A6 CrossRef.
- S. Casanova, T. Montmerle, E. D. Feigelson and P. Andre, Astrophys. J., 1995, 439, 752 CrossRef.
- K. Koyama, K. Hamaguchi, S. Ueno, N. Kobayashi and E. D. Feigelson, Publ. Astron. Soc. Jpn., 1996, 48, L87 CrossRef CAS.
- K. Imanishi, K. Koyama and Y. Tsuboi, Astrophys. J., 2001, 557, 747 CrossRef CAS.
- S. Pilling, et al., J. Phys. Chem. A, 2009, 113, 11161 CrossRef CAS.
- R. Brown, R. N. Clark and B. Buratti, et al., Science, 2006, 311, 1425 CrossRef CAS.
- A. Hendrix, C. J. Hansen and G. M. Holsclaw, Icarus, 2010, 206, 608 CrossRef CAS.
- J. R. Spencer, J. C. Pearl and M. Segura, et al., Science, 2006, 311, 1401 CrossRef CAS.
- J. S. Kargel, Science, 2006, 311, 1389 CrossRef CAS.
- M. G. Rachid, et al., Planet. Space Sci., 2017, 149, 83 CrossRef CAS.
- F. A. Vasconcelos, et al., Astrophys. J., 2017c, 850, 174 Search PubMed.
- A. Jímenez-Escobar, G. M. Muñoz-Caro and A. Ciaravella, et al., Astrophys. J., Lett., 2012, 751, L40 CrossRef.
- Y.-J. Chen, A. Ciaravella and G. M. Muñoz-Caro, et al., Astrophys. J., 2013, 778, ID162 CrossRef.
- A. Jímenez-Escobar, Y.-J. Chen and A. Ciaravella, et al., Astrophys. J., 2016, 820, ID25 CrossRef.
- A. Ciaravella, A. Jímenez-Escobar, C. Cecchi-Pestellini, et al., in press, 2019, arXiv:1905.07958 [astro-ph.GA].
- A. R. B. Castro, G. B. Fraguas, J. G. Pacheco, et al., Commissioning of the SGM beamline, LNLS Tech Memorandum CT 06/97 (Memorando Tecnico), 1997, Campinas, Brazil Search PubMed.
- A. R. D. Rodrigues, A. F. Craievich and C. E. T. Goncálves da Silva, J. Synchrotron Radiat., 1998, 5, 1157 CrossRef CAS.
- S. Pilling, E. Seperuelo Duarte and A. Domaracka, et al., Phys. Chem. Chem. Phys., 2011b, 13, 15755 Search PubMed.
- S. Pilling, D. P. P. Andrade and E. M. do Nascimento, et al., Mon. Not. R. Astron. Soc., 2011a, 411, 2214 Search PubMed.
- S. Pilling, E. Seperuelo Duarte and E. F. da Silveira, et al., Astron. Astrophys., 2010a, 509, A87 Search PubMed.
- S. Pilling, E. Seperuelo Duarte and A. Domaracka, et al., Astron. Astrophys., 2010b, 523, A77 Search PubMed.
- E. L. Gibb, D. C. B. Whittet and A. C. A. Boogert, Astrophys. J., Suppl. Ser., 2004, 151, 35 CrossRef CAS.
- L. B. d'Hendecourt and L. J. Allamandola, Astron. Astrophys., Suppl. Ser., 1986, 64, 453 Search PubMed.
- O. Kerkhof, W. A. Schutte and P. Ehrenfreund, Astron. Astrophys., 1999, 346, 990 CAS.
- M. H. Moore, B. Donn, R. Khanna and M. F. A'Hearn, Icarus, 1983, 54, 388 CrossRef CAS.
- F. A. van Broekhuizen, J. V. Keane and W. A. Schutte, Astron. Astrophys., 2004, 415, 425 CrossRef CAS.
- C. J. Bennett, C. S. Jamieson, A. M. Mebel and R. I. Kaiser, Phys. Chem. Chem. Phys., 2004, 6, 735 RSC.
- M. J. Loeffler and U. Raut, et al., Icarus, 2006, 180, 265 CrossRef CAS.
- D. Berckmanns, et al., J. Phys. Chem., 1988, 92, 66 CrossRef.
- W. A. Schutte, et al., Astron. Astrophys., 1999, 343, 966 CAS.
- R. J. A. Grim, J. M. Greenberg and M. S. de Groot, et al., Astron. Astrophys., Suppl. Ser., 1989, 78, 161 CAS.
- A. Bergantini and S. Pilling, et al., Astron. Astrophys., 2014, 570, A120 CrossRef.
- A. G. M. Abdulgalil, D. Marchione and J. D. Thrower, et al., Philos. Trans. R. Soc., A, 2013, 371, 20110586 CrossRef CAS.
- B. L. Henderson and M. S. Gudipati, Astrophys. J., 2016, 800, 66 CrossRef.
- V. S. Bonfim, et al., Phys. Chem. Chem. Phys., 2017, 19, 26906 RSC.
- G. C. Almeida, et al., Mon. Not. R. Astron. Soc., 2017, 471, 1330 CrossRef CAS.
- F. A. Vasconcelos, et al., Phys. Chem. Chem. Phys., 2017a, 19, 12845 Search PubMed.
- F. A. Vasconcelos, et al., Phys. Chem. Chem. Phys., 2017b, 19, 24154 Search PubMed.
- S. Pilling, Proc. IAUS 332 - Astrochemistry VII, 2017, pp. 281–292, DOI:10.1017/S1743921317007840.
- C. Mejia and A. L. F. de Barros, et al., Icarus, 2015, 250, 220 CrossRef.
- R. A. Baragiola, et al., Nucl. Instrum. Methods Phys. Res., Sect. B, 2008, 266, 3057 CrossRef CAS.
- B. Rowland and J. P. Devlin, J. Chem. Phys., 1991, 94, 812 CrossRef CAS.
- B. Rowland, M. Fisher and J. P. Devlin, J. Chem. Phys., 1991, 95, 1378 CrossRef CAS.
- M. E. Palumbo, Astron. Astrophys., 2006, 453, 903 CrossRef CAS.
- E. Dartois, J. J. Ding, A. L. F. de Barros and P. Boduch, et al., Astron. Astrophys., 2013, 557, A97 CrossRef.
- U. Raut, B. D. Teolis and M. J. Loeffler, et al., J. Chem. Phys., 2007, 126, 244511 CrossRef CAS.
- K. I. Oberg, E. C. Fayolle and H. M. Cuppen, et al., Astron. Astrophys., 2009, 505, 183 CrossRef.
- C. A. Gueymard, Sol. Energy, 2004, 76, 423 CrossRef.
- C. Walsh, H. Nomura, T. J. Millar and Y. Aikawa, Astrophys. J., 2012, 674, 1242 Search PubMed.
- F. Fantuzzi, S. Pilling and A. C. F. Santos, et al., Mon. Not. R. Astron. Soc., 2011, 417, 2631 CrossRef CAS.
- I. Kamp, A. Scheepstra and M. Min, et al., Astron. Astrophys., 2018, 617, A1 CrossRef.
- S. M. Andrews, J. Huang and L. M. Pérez, et al., Astrophys. J., Lett., 2018, 869, L41 CrossRef CAS.
- C. Paranicas, R. Roussos and N. Krupp, et al., Planet. Space Sci., 2012, 61, 60 CrossRef CAS.
- J. H. Waite Jr, W. S. Lewis and B. A. Magee, et al., Nature, 2009, 460(7254), 487 CrossRef.
- R. Dupuy, M. Bertin and G. Feraud, et al., Nat. Astron., 2018, 2, 796 CrossRef.
| This journal is © The Royal Society of Chemistry 2019 |