 Open Access Article
Synthesis and luminescence properties of novel Eu2+/3+, Ce3+ ion single- and co-doped BaZn2(PO4)2 phosphors for white-light applications
Yuhan Zhu,
Wenjun Wang,
Zefeng Xu,
Qi Luo,
Ling Li * and
Xiaoguang Liu*
Hubei Collaborative Innovation Center for Advanced Organochemical Materials, Ministry-of-Education Key Laboratory for the Synthesis and Applications of Organic Functional Molecules, Hubei University, Wuhan, Hubei, China. E-mail: liling402431@hotmail.com; liuxiaoguang402@hotmail.com
First published on 6th August 2019
Abstract
A series of novel Eu2+/3+, Ce3+ ion single- and co-doped BaZn2(PO4)2 samples were prepared via a high-temperature solid-state reaction. XRD powder diffraction results indicated that all of the products were pure phases. The photoluminescence properties of BaZn2(PO4)2:Eu showed that Eu2+ and Eu3+ coexist in the system and Eu3+ can be self-reduced to Eu2+ in an air atmosphere. In addition, the strongest emission peak of Eu3+ ions at 593 nm implied that Eu3+ ions occupy the inversion symmetry lattice and also the site of Zn in BaZn2(PO4). We used the theoretical method of bond energy to explain why the self-reduction of Eu3+ to Eu2+ can occur in the BaZn2(PO4)2 system. The calculation results indicated that the bond energy change value  is smaller than
  , indicating that Eu2+ ions are more likely to occupy the Zn site and more stable than Eu3+ ions in BaZn2(PO4). Furthermore, the energy transfer process between Ce3+ and Eu2+ ions in the photoluminescence spectrum and the decay lifetime were observed, and the energy transfer mechanism was determined to be a dipole–dipole interaction. In this work, by adjusting the ratio of Ce and Eu ions, the emission color can be changed from blue to white, implying that the phosphor can be used as a promising candidate in the manufacture of white LEDs.
1. Introduction
Rare-earth doped luminescent materials have wide applications in the fields of illumination, display, laser, anti-counterfeiting, fiber-optic communication and biomedicine, and they have become a hotspot in many interdisciplinary research studies. The rare-earth doped white LED materials have drawn extensive attention due to their advantages of luminous efficiency, energy saving, environmental protection, long life, and simple structure.1–5 Among most rare-earth ions, Eu3+ ions have been extensively studied. It is a typical red-emitting rare-earth ion with an electronic structure of [Xe]4f6, and its emission spectrum is caused by an electronic transition from the excited state 5D0 high-energy level to the 7FJ (J = 0, 1, 2⋯6) ground-state energy level in the 4f configuration. If the Eu3+ ion is located at the strict inversion center, its 5D0 → 7F1 electronic transition is the strongest at around 590 nm, emitting orange-red light. When the Eu3+ ion is deviated from the inversion center position, the 5D0 → 7F2 electric dipole transition in the emission spectrum is the strongest at about 612 nm with red light.6–8 In recent years, the reduction from Eu3+ to Eu2+ has been found to occur in the same crystal in an air atmosphere. For example, in aluminosilicates9, aluminate,10,11 silicate,12 phosphate,13 borate,14,15 the reduction from Eu3+ to Eu2+ have appeared. The Eu2+ spectral position changes with the strength of the crystal field, and ultraviolet, blue, and red light are generated according to the degree of splitting.16 Ce3+ is also an important luminescent ion, and its transition between 4f and 5d is the allowed electric dipole transition; hence, it has high excitation and emission peaks. The interaction of the exposed d-electrons with the crystal field broadens the excitation and emission of Ce3+, and the emission of light can be adjusted from the near-ultraviolet to red region depending on the matrix. This property allows Ce3+ ions to spectrally overlap with most common luminescent ions in a specific matrix, greatly increasing the probability and efficiency of energy transfer. When the Ce3+ ion is in an excited state, it can transfer energy to the co-doped rare-earth ion by resonance according to the ion spacing, which is a commonly used and excellent sensitizer.17–19 Ce3+ ions can be co-doped with many ions such as Ce3+, Tb3+/Mn2+ in Ca19Ce(PO4)14,20 CaSc2O4:Ce3+, Yb3+,21 LiYSiO4:Ce3+, Eu3+,22 BaY2Si3O10:Ce3+, Pr3+,23 K2Ba3Si8O20:Ce3+, and Eu2+ (ref. 24) to generate energy transfer behavior.The bond energy theory is used to analyze and explain the priority occupancy for doping ions entering the crystal lattice. The change in bond energy is smaller as per the bond energy theory when the doping ions replace the cation sites in the crystal lattice, in which the easier the doping ions preferentially occupy. At present, this theory has been effectively used in the CaAl2Si2O8:Eu3+,9 Ca10M(PO4)7 (M = Li, Na, K):Eu2+/Eu3+,25 and Sr5(BO3)3F:Eu3+(ref. 26) samples.
MZn2(PO4)2 (M = Mg, Ca, Sr, Ba) is an important host with the advantages of low cost, high luminescence efficiency, low synthesis temperature and good thermal stability. Based on these characteristics, BaZn2(PO4)2 has also become one of the hot topics of discussion. In the previous reports, the properties of BaZn2(PO4)2 phosphors have been studied. For example, the photoluminescence properties of BaZn2(PO4)2:Ce3+, Tb3+/Dy3+ (ref. 27 and 28) and red phosphor BaZn2(PO4)2:Sm3+ (ref. 29) have been studied. However, the lattice occupancy and the self-reduction phenomenon of Eu ion doping in BaZn2(PO4)2 and the energy transfer behavior of Ce3+, Eu2+ co-doping in BaZn2(PO4)2 have not been discussed.
In this work, a series of Eu2+/3+ and Ce3+ single- and co-doped BaZn2(PO4)2 products were synthesized via a high-temperature solid-state reaction. First, the self-reduction phenomenon was found from Eu3+ to Eu2+ in the BaZn2(PO4)2 system. Next, we use the bond energy method to analyze the self-reduction reaction from Eu3+ to Eu2+ in the lattice position of Zn in BaZn2(PO4)2. At the same time, we use this method to explain why Eu3+ can be self-reduced to Eu2+. Finally, the photoluminescence properties and energy transfer mechanisms of Ce3+–Eu2+ ion co-doped BaZn2(PO4)2 are studied in detail. In addition, based on the energy transfer, the emission color can be adjusted from blue to white by adjusting the relative proportions of Ce and Eu ions.
2 Experimental
2.1 Preparation of phosphors
A series of Eu2+/3+, Ce3+ ion single- and co-doped BaZn2(PO4)2 phosphors were synthesized by a traditional high-temperature solid-state method in an air atmosphere. The raw materials selected include BaCO3, (NH4)2HPO4, ZnO, CeO2 and Eu2O3. The exact amount of raw materials of each component was calculated, and the analytical balance was accurately and effectively weighed. The raw materials were thoroughly ground and mixed evenly in an agate mortar, and transferred to an alumina crucible of appropriate size. Then the mixtures were pre-sintered at 850 °C for 4 h, and further calcined at 1000 °C for 4 h. Finally, all the as-synthesized products were naturally cooled to room temperature and ground to a powder.2.2 Characterization methods
The phase purity characterization of the phosphors was performed using an X-ray diffractometer. Excitation source information: 40 kV, 40 mA on a Bruker D8 Advance X-ray diffractometer with Cu Kα (λ = 1.5418 Å) radiation. The scanning mode is continuous, the scanning speed is 2° per minute, and the test range is 5–80°. The morphologies of the samples were characterized by scanning electron microscopy (SEM) on an instrument of JSM 6510 LV Electronics, Japan; the resolution is 3 nm. The spectrometer FLS980 was used to test the emission and excitation as well as decay curves of the samples. A 450 W xenon lamp was used as a steady-state light source in the test and a 60 W μF flash lamp was used as the decay curve test source.3. Results and discussion
3.1 Phase analysis and crystal structure
Fig. 1 depicts the XRD patterns of Eu2+/3+, Ce3+ ion single- and co-doped BaZn2(PO4)2 phosphors. Compared with the standard card JCPDS#16-0554, it can be seen that the diffraction peaks of the synthesized samples corresponded well to the standard card, and no other diffraction peaks appeared. Therefore, the prepared samples were all pure phases and no impurities were formed. This indicates that rare-earth ions enter the BaZn2(PO4)2 lattice, and no other impurity phases are formed; hence, the doping of these ions does not cause any change in the lattice structure of BaZn2(PO4)2. However, the XRD patterns of Eu2+/3+, Ce3+ ion single- and co-doped BaZn2(PO4)2 phosphors are light-shifted compared with the pure BaZn2(PO4)2 compound. This result could be attributed to the larger ionic radii of Eu3+ [r = 1.09 Å and 1.101 Å for CN = 4 and 7, respectively] and Ce3+ [r = 1.07 Å for CN = 7] with respect to those of Ba2+ (r = 1.38 Å for CN = 7, respectively) and Zn2+ (r = 0.60 Å for CN = 4, respectively). Moreover, as the radius of the dopant ions increase, the lattice gets distorted, and hence, the position of the diffraction peak shifts slightly.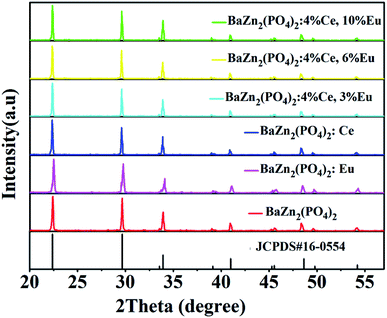 | ||
| Fig. 1 XRD patterns of Eu2+/3+, Ce3+ ion single- and co-doped BaZn2(PO4)2 phosphors and standard card (JCPDS#16-0554). | ||
The unit cell of BaZn2(PO4)2 is exhibited in Fig. 2. BaZn2(PO4)2 belongs to a monoclinic crystal structure of space group P21/c. The unit cell contains five kinds of cation coordination environments, namely Ba1, Zn1, Zn2, P1 and P2. Ba1 form isolated BaO polyhedra, which has seven coordination sites with an asymmetric polyhedron surrounded by oxygen atoms. Both Zn1 and Zn2 are tetrahedrons connected to oxygen. At the same time, there are two environments of tetrahedrons, one with vertices connected to a polyhedron centered on Ba and the other with a co-edge. P1 and P2 are also two four-coordinated sites. The parameters of the unit cell are a = 8.598 Å, b = 9.761 Å, c = 9.159 Å, and V = 768.45 Å3, respectively.
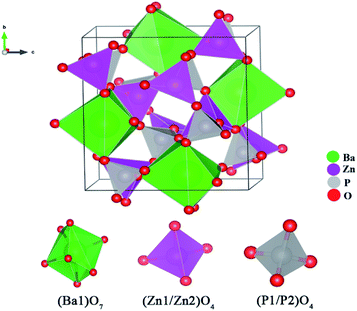 | ||
| Fig. 2 Schematic of the crystal structure of BaZn2(PO4)2 and coordination environments for Ba, Zn and P sites. | ||
The SEM micrograph, EDS mapping images and elemental distribution of Eu/Ce doped in BaZn2(PO4)2 synthesized under ambient conditions are displayed in Fig. 3. According to the SEM image of the two samples, we can see that all the samples have a block structure with inconsistent size. According to the EDS scanning structure and elemental distribution image, the atomic distribution patterns of Ba, O, P, Zn, Eu or Ce can be obtained very clearly in the Eu- or Ce-doped BaZn2(PO4)2 samples. These indicate that the Ce and Eu elements are indeed present in the BaZn2(PO4)2 sample.
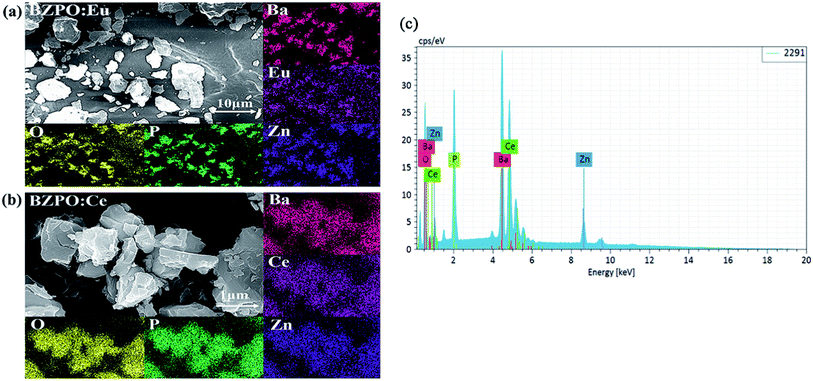 | ||
| Fig. 3 (a and b) Scanning electron micrographs and EDS of BaZn2(PO4)2:Eu/Ce. (c) Elemental distribution map of BaZn2(PO4)2:Ce. | ||
3.2 Photoluminescence properties of BaZn2(PO4)2:Eu
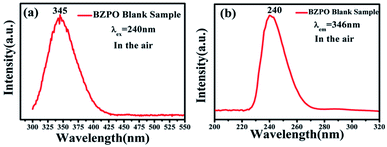
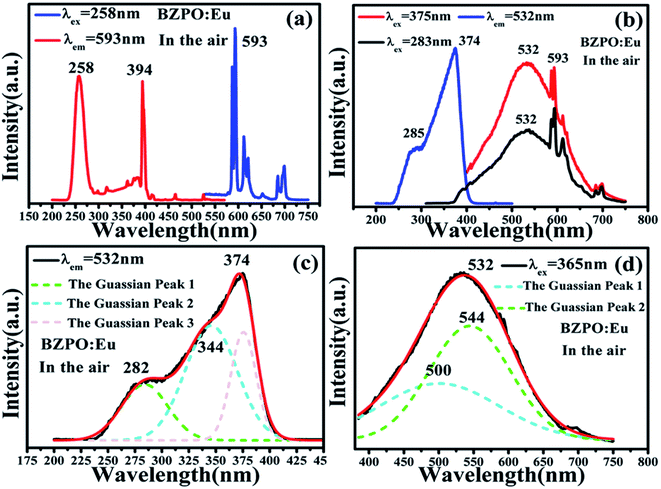
The excitation and emission spectra of the undoped BaZn2(PO4)2 sample are shown in Fig. 4. At an excitation wavelength of 240 nm, the emission spectrum consists of a broad peak at a maximum wavelength position of 345 nm in the wavelength range of 300–425 nm (Fig. 4a). In the excition spectrum (Fig. 4b), the maximum wavelength position of the excitation spectrum is at 240 nm.Fig. 5 displays the photoluminescence spectra of BaZn2(PO4)2:Eu phosphors. It can been found that a series of sharp peaks with an emission spectrum between 550–750 nm are due to the 5D0–7FJ (J = 0, 1, 2, 3, 4) transition of Eu3+ upon the 258 nm excitation, whose maximum wavelength position belongs to the 5D0–7F1 transition at 593 nm. By monitoring the emission at 593 nm, it was found that the excitation spectrum in the range of 200–550 nm consists of a broadband excitation with a central wavelength at 258 nm, which is attributable to the charge transition of O2−–Eu3+ and some sharp peaks can be ascribed to the characteristic excitation of Eu3+ in Fig. 5(a). We know that when the Eu3+ ion is in a position with a strict inversion center, it will be dominated by the allowable 5D0–7F1 magnetic dipole transition, and the emission peak is around 590 nm. Therefore, it can be judged that in the BaZn2(PO4)2:Eu sample we prepared, the Eu3+ ion occupies the inversion symmetry position. According to the asymmetrical structure centered on the Ba atom, it is presumed that the Eu3+ ion enters a symmetric tetrahedral structure centered on the Zn atom.
The spectrum of the phosphor BaZn2(PO4)2:Eu at different excitation and monitoring wavelengths is shown in Fig. 5(b). Upon monitoring the wavelength at 532 nm, it was found that the excitation spectrum of BaZn2(PO4)2:Eu consists of a narrow band absorption ranging from 200 to 450 nm with the dominant absorption peak at 374 nm, which comes from the 4f → 5d transition of Eu2+ ions. Under the excitation of 283 and 375 nm, BaZn2(PO4)2:Eu phosphors exhibited broad emission bands in the range of 350–750 nm with a maximum at 532 nm, which originates from the 5d → 4f transitions of Eu2+ ions. At the same time, the emission sharp peaks belonging to the 5D0–7F1 transition of Eu3+ at 593 nm can also be clearly observed. Therefore, the existence of Eu2+ was proved. From Fig. 5(a), it can be observed that Eu2+ and Eu3+ coexist in the system, indicating that the self-reduction process from Eu3+ to Eu2+ occurred in the BaZn2(PO4)2 crystal. We also made a Gaussian fitting to the excitation spectrum monitored at 532 nm wavelength and the emission spectrum at 365 nm wavelength, as shown in Fig. 5(c and d). The center positions of the three sub-excitation peaks obtained by Gaussian fitting are at 282, 344, and 375 nm, respectively. This is due to the splitting of the excitation peak broadband. Similarly, two sub-emission peaks of the emission spectrum are obtained with center positions at 500 and 544 nm. From this, we conclude that Eu2+ ions occupy two sites in the BaZn2(PO4)2 lattice.
In BaZn2(PO4)2 crystals, there are five kinds of cationic sites that can be occupied by the dopant, namely Ba1, Zn1, Zn2, P1 and P2. From the photoluminescence spectrum, we know that the strongest position of the emission peak of Eu3+ ions is at 593 nm, indicating that Eu3+ ions are in the inversion symmetry position and occupy the position of Zn. We use the theoretical method of bond energy to explain the reduction of Eu3+ to Eu2+ in the air and the priority of Eu2+ and Eu3+ ions in the lattice position of Zn in the system. It can be used by the following expression:
 | (1) |
 | (2) |
 is the variation in bond energy, that is, a change of bond energy caused when Eu2+ and Eu3+ ions enter the lattice to replace the Zn1 and Zn2 sites. The smaller the change in bond energy, the easier it is to be occupied by dopant ions. Here, if the bond energy change value
  is smaller than
  , then the Eu2+ ion is more likely to occupy the position of Zn, and vice versa. From eqn (2), we calculated the variation in bond energy when Eu2+/3+ ions occupy the Zn1 and Zn2 sites in the BaZn2(PO4)2 system. The results are shown in Table 2. For Eu2+/3+ ions, we can see that the bond energy variation values of
  and
and  are 28.6619, 29.0296, 57.1607 and 57.8942, respectively. It is clear that the bond energy difference
  of Eu2+ at the Zn site is smaller than that of
  , so Eu2+ is more likely to occupy this site than the Eu3+ ion. At the same time, this also implies that Eu2+ is more stable in the Zn site and it provides conditions that Eu3+ can be reduced to Eu2+ under non-reducing condition.
| Ions | J (kcal mol−1) | d0 (Å) |
|---|---|---|
| Zn2+–O2− | 86.900 | 1.704 |
| Eu3+–O2− | 109.400 | 2.074 |
| Eu2+–O2− | 56.180 | 2.049 |
 . The units are kcal mol−1
| Central atom | Coordination atom | Count | dm–o | EM–O | EEu2+–O2− | EEu3+–O2− | ||
|---|---|---|---|---|---|---|---|---|
| Zn1 | O2 | 1× | 1.9168 | 48.8924 | 80.3071 | 111.5430 | 28.6619 | 57.1607 |
| O1 | 1× | 1.9429 | 45.5623 | 74.8373 | 103.9458 | |||
| O3 | 1× | 1.959 | 43.6223 | 71.6507 | 99.5197 | |||
| O6 | 1× | 1.9878 | 40.3556 | 66.2851 | 92.0672 | |||
| Zn2 | O7 | 1× | 1.9065 | 50.2726 | 82.5740 | 114.6917 | 29.0296 | 57.8942 |
| O4 | 1× | 1.9491 | 44.8052 | 73.5938 | 102.2185 | |||
| O5 | 1x | 1.9654 | 42.8742 | 70.4220 | 97.8131 | |||
| O8 | 1x | 1.9663 | 42.7700 | 70.2509 | 97.5755 |
In summary, we calculated that when Eu2+ and Eu3+ ions are into the BaZn2(PO4)2 matrix, the bond energy change values of Eu2+ and Eu3+ ions at the Zn1 and Zn2 sites by using the theoretical method of bond energy. The bond energy change value  is smaller than
  , indicating that Eu2+ is more likely to occupy the Zn site than Eu3+, which also implies that Eu3+ can be self-reduced to Eu2+. All theoretical calculations are consistent with the PL spectrum phenomenon.
Based on the principle of charge compensation mechanism,30 when Eu3+ replaces the site of Zn2+, the charge in the environment is unbalanced. In order to maintain the overall charge exhibiting electrical neutrality, the formation of the cationic vacancy defect  will generate two negative electrons to compensate for the cation vacancy defects induced by
  . Then form a dipole complex
  , where
  represents an electron donor and
  an electron acceptor. When the negative charge generated on
  is transferred to
  , Eu3+ will be reduced to Eu2+:
3.3 Photoluminescence properties of BaZn2(PO4)2:Ce, Eu
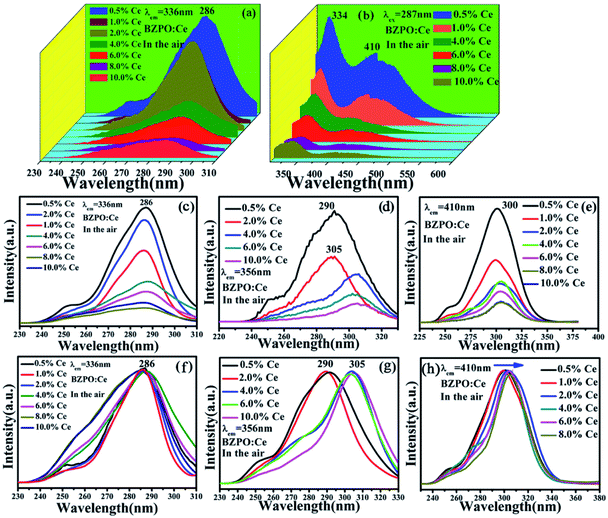
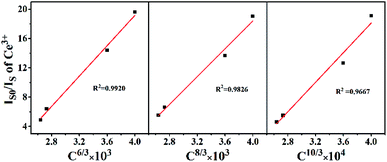
Fig. 6 depicts the excitation and emission spectra of different concentrations of Ce3+ doped in BaZn2(PO4)2. For Fig. 6(a), under the monitoring of 336 nm, the excitation spectrum is in the range of 230–310 nm, and the strongest absorption of these excitation bands is about 287 nm, which is due to the transition of the Ce3+ ion from the ground state to crystal field splitting level of the 5d state. In general, the emission spectrum of Ce3+ ion sample has a dual characteristic due to the ground state 2F5/2 and 2F7/2 spin orbital splitting, which indicates that Ce3+ is successfully doped into BaZn2(PO4)2. As shown in Fig. 6(b), the emission spectra have two broad bands centered at 334 and 410 nm in the range of 300–500 nm, which can be clearly observed under the excitation at 287 nm.The excitation spectra of the BaZn2(PO4)2:x% Ce sample monitored at 336, 356 and 410 nm are shown in Fig. 6(c–e). We can see that the photoluminescence intensity reaches the maximum when the doping concentration of Ce3+ is 0.5%. At the same time, we normalized the excitation spectra under these different monitoring wavelengths, as shown in Fig. 6(f–h). At the monitoring wavelength of 336 nm, the broadband center of the excitation spectrum was located at 286 nm; it is worth noting that when the monitoring wavelength is 356 nm, the central position of the excitation spectrum changes with different concentrations of Ce3+ doping, that is, the central position of the broad excitation bands are 290 and 305 nm, respectively. In addition, the excitation spectrum exhibited a red shift phenomenon when monitored at 410 nm which is due to the influence of the crystal field.31,32 By comparing the excitation spectra at different monitoring wavelengths in Fig. 6, it can be seen that in addition to the difference in luminescence intensity, the peak shape and the dominated peak position also have significant differences.
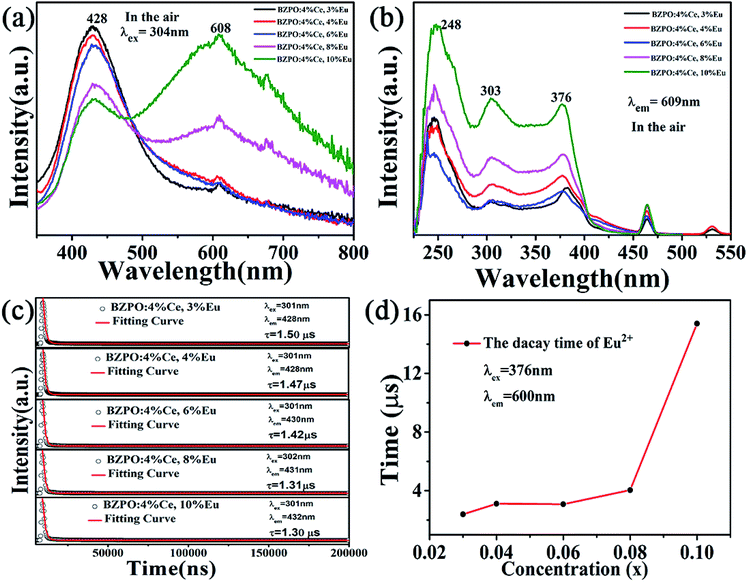
The emission spectrum of the BaZn2(PO4)2:4% Ce, x% Eu series sample at an excitation wavelength of 304 nm for Ce3+ is shown in Fig. 7(a). There are two distinct broadband emission peaks in the range of 300–800 nm, which are the 5d–4f transitions corresponding to Ce3+ and Eu2+ at 428 and 609 nm, respectively. In the BaZn2(PO4)2:4% Ce, x% Eu co-doped sample, not only the emission of Ce3+ but also the emission of Eu2+ was observed by the 304 nm characteristic excitation of Ce3+. At the same time, it can be clearly seen that as the concentration of Eu ions increases, the luminescence intensity of Ce3+ ions gradually decreases, and that of Eu2+ ions gradually increases. This strongly proves that energy transfer occurs between Ce3+ and Eu2+. Fig. 7(b) is the excitation spectrum obtained under the monitoring of 609 nm. It shows that there are three strong broad bands in the range of 225–550 nm, and their central positions at 248, 303 and 376 nm belong to the charge transition of O2−–Eu3+, the f–d energy level transition of Ce3+ and the 4f-5d transition of Eu2+, respectively. Therefore, we found that under the monitoring of Eu2+, the excitation spectrum exhibits the excitation peak of Ce3+, which further proves the phenomenon of Ce3+–Eu2+ energy transfer.
3.4 Energy transfer mechanism
In order to further study the energy transfer process, we tested the lifetime of Ce3+ ions under 320 nm excitation (λex = 302 nm, λem = 428 nm) and Eu2+ ions under the corresponding excitation and emission wavelengths, as shown in Fig. 7(c). The decay curves are better fitted by the second-order exponential decay. The formula is as follows:33
 | (3) |
| τ* = (A1τ21 + A2τ22)/(A1τ1 + A2τ2) | (4) |
According to eqn (3) and (4), the decay time of Ce3+ in BaZn2(PO4)2:4% Ce, x% Eu samples are approximately 1.5, 1.47, 1.42, 1.31 and 1.30 μs corresponding to x = 3, 4, 6, 8, 10 in Fig. 7(c). We can observe that as the concentration of Eu ions increases, the lifetime of Ce3+ ions decreases, whereas the lifetime of Eu2+ ions increases, which is in good agreement with the spectral characteristics of BaZn2(PO4)2:4% Ce, x% Eu. This also strongly indicates the energy transfer behavior between Ce3+ and Eu2+ ions.
Based on Dexter's theory, the critical distance of energy transfer is defined as the distance at which the transition probability is equal to the probability of Ce3+ radiation emission. The critical distance Rc for energy transfer between Ce3+ and Eu2+ in BaZn2(PO4)2 is discussed by the following formula:28
 | (5) |
 | (6) |
The chromaticity calculation was performed based on the photoluminescence spectra of the BaZn2(PO4)2:4% Ce, x% Eu phosphor at 304 nm excitation, and the calculation results of the CIE coordinates are shown in Fig. 9. Detailed CIE chromaticity coordinates are listed in Table 3. In a series of samples of BaZn2(PO4)2:4% Ce, x% Eu, as the doping concentration of Eu ions is from 0.03 to 0.1, we can see that the CIE coordinates of the samples change from the blue region to the white region. It is worth noting that the CIE chromaticity coordinates of the BaZn2(PO4)2:4% Ce, 8% Eu sample in the white light region (0.3195, 0.2959) is very close to the ideal white luminescence chromaticity coordinates (0.33, 0.33). It is suggested that the BaZn2(PO4)2:4% Ce, 8% Eu phosphor has suitable color coordinates as white phosphors in the field of lighting. The results show that the light emission of white phosphors can be achieved by appropriately adjusting the ratio of Ce/Eu ions.
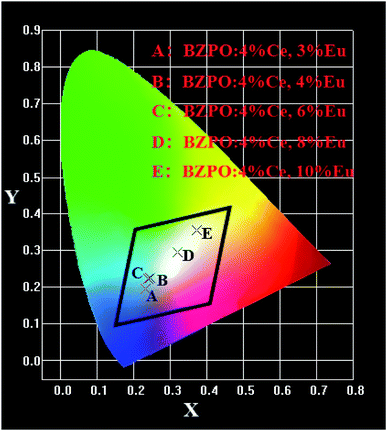 | ||
| Fig. 9 CIE chromaticity diagram for BaZn2(PO4)2:4% Ce, x% Eu under 304 nm excitation (x = 3, 4, 6, 8, 10). | ||
| Point | Sample | CIE (x, y) | Peak | Peak intensity |
|---|---|---|---|---|
| A | BZPO:4% Ce, 3% Eu | (0.2318, 0.1939) | 430 | 1256820 |
| B | BZPO:4% Ce, 4% Eu | (0.2450, 0.2238) | 429 | 1201980 |
| C | BZPO:4% Ce, 6% Eu | (0.2404, 0.2226) | 428 | 1146960 |
| D | BZPO:4% Ce, 8% Eu | (0.3195, 0.2959) | 429 | 910659 |
| E | BZPO:4% Ce, 10% Eu | (0.3718, 0.3562) | 608 | 1208720 |
4. Conclusions
A series of novel Eu2+/3+, Ce3+ ion single- and co-doped BaZn2(PO4)2 samples have been synthesized via a high-temperature solid-state reaction. It was confirmed by XRD powder diffraction that our target products are all pure phases. The self-reduction from Eu3+ to Eu2+ has been found in the BaZn2(PO4)2 system. The photoluminescence spectra show that Eu2+ and Eu3+ ions coexist in the BaZn2(PO4) crystal. At the same time, the strongest emission peak of Eu3+ ions belongs to the 5D0–7F1 transition of Eu3+ at 593 nm, which indicates that Eu3+ ions occupy the inversion symmetry lattice and occupy the site of Zn in BaZn2(PO4). According to the bond energy method, the priority of Eu2+ and Eu3+ ions in the lattice position of Zn and the self-reduction of Eu3+ to Eu2+ were explained in BaZn2(PO4). The results indicate that the value is smaller than
  , indicating that Eu2+ is more likely to occupy the Zn site and is more stable than Eu3+ in BaZn2(PO4), which also explains why Eu3+ ion can reduce to Eu2+ ion. For BaZn2(PO4)2:4% Ce, x% Eu phosphors, the energy transfer from Ce3+ to Eu2+ was deduced by excitation and emission spectra, which was further confirmed by the decrease in the decay lifetime of Ce3+ as the concentration of Eu ions gradually increases. The energy transfer mechanism between Ce3+ and Eu2+ proved to be a dipole–dipole interaction. Moreover, the CIE chromaticity coordinates show that the emission color of BaZn2(PO4)2:4% Ce, x% Eu phosphors can be changed from blue to white. In particular, the chromaticity coordinates (0.3195, 0.2959) of BaZn2(PO4)2:4% Ce, 8% Eu are very close to the ideal white luminescence (0.33, 0.33), indicating that the phosphor has potential applications in white LEDs.
Conflicts of interest
There are no conflicts to declare.Acknowledgements
This work is financially supported by the National Natural Science Foundations of China (Grant no. 21301053) and Hubei Natural Science Foundations from Science and Technology Department of Hubei Province (2018CFB517), Ministry-of-Education Key Laboratory for the Synthesis and Applications of Organic Functional Molecules (KLSAOFM1804).Notes and references
- K. Biswas, S. Balaji, D. Ghosh, A. D. Sontakke and K. Annapurna, J. Alloys Compd., 2014, 608, 266–271 CrossRef CAS.
- X. Zhang, L. Huang, F. Pan, M. Wu, J. Wang, Y. Chen and Q. Su, ACS Appl. Mater. Interfaces, 2014, 6, 2709–2717 CrossRef CAS PubMed.
- X. Zhang, J. Wang, L. Huang, F. Pan, Y. Chen, B. Lei, M. Peng and M. Wu, ACS Appl. Mater. Interfaces, 2015, 7, 10044–10054 CrossRef CAS.
- X. Zhang, J. Yu, J. Wang, C. Zhu, J. Zhang, R. Zou, M. Wu, B. Lei and Y. Liu, ACS Appl. Mater. Interfaces, 2015, 7, 28122–28127 CrossRef CAS PubMed.
- S. K. Jaganathan, A. J. Peter, V. Mahalingam and R. Krishnan, J. Mater. Sci.: Mater. Electron., 2019, 30, 2037–2044 CrossRef CAS.
- K. H. Jang, N. M. Khaidukov, V. P. Tuyen, S. I. Kim, Y. M. Yu and H. J. Seo, J. Alloys Compd., 2012, 536, 47–51 CrossRef CAS.
- M. Keskar, S. K. Gupta, R. Phatak, S. Kannan and V. Natarajan, J. Photochem. Photobiol., A, 2015, 311, 59–67 CrossRef CAS.
- M. Xia, Z. Ju, H. Yang, Z. Wang, X. Gao, F. Pan and W. Liu, J. Alloys Compd., 2018, 739, 439–446 CrossRef CAS.
- L. Li, Y. Pan, W. Wang, Y. Zhu, W. Zhang, H. Xu, L. Zhou and X. Liu, J. Alloys Compd., 2018, 731, 496–503 CrossRef CAS.
- M. V. d. S. Rezende, M. E. G. Valerio and R. A. Jackson, Mater. Res. Bull., 2015, 61, 348–351 CrossRef CAS.
- Y. Pan, W. Wang, Y. Zhu, H. Xu, L. Zhou, H. M. Noh, J. H. Jeong, X. Liu and L. Li, RSC Adv., 2018, 8, 23981–23989 RSC.
- Y. Chu, Z. Liu, Q. Zhang, H. Fang, Y. Li and H. Wang, J. Alloys Compd., 2017, 728, 307–313 CrossRef CAS.
- H. Li and Y. Wang, Inorg. Chem., 2017, 56, 10396–10403 CrossRef CAS PubMed.
- T. Li, P. Li, Z. Wang, S. Xu, Q. Bai and Z. Yang, Phys. Chem. Chem. Phys., 2017, 19, 4131–4138 RSC.
- W. Chen, X. Chen, F. Sun and X. Wang, J. Alloys Compd., 2017, 698, 565–570 CrossRef CAS.
- H. J. Lee, S. H. Choi, K. P. Kim, H. H. Shin and J. S. Yoo, Jpn. J. Appl. Phys., 2010, 49, 102101 CrossRef.
- C. Cao, H. K. Yang, J. W. Chung, B. K. Moon, B. C. Choi, J. H. Jeong and K. H. Kim, J. Mater. Chem., 2011, 21, 10342–10347 RSC.
- F. Huang, J. Cheng, X. Liu, L. Hu and D. Chen, Opt. Express, 2014, 22, 20924–20935 CrossRef PubMed.
- L. Zhang, Z. Fu, Z. Wu, Y. Wang, X. Fu and T. Cui, Mater. Res. Bull., 2014, 56, 65–70 CrossRef CAS.
- M. Shang, S. Liang, H. Lian and J. Lin, Inorg. Chem., 2017, 56, 6131–6140 CrossRef CAS PubMed.
- J. Li, L. Chen, Z. Hao, X. Zhang, L. Zhang, Y. Luo and J. Zhang, Inorg. Chem., 2015, 54, 4806–4810 CrossRef CAS PubMed.
- R. Shi, G. Liu, H. Liang, Y. Huang, Y. Tao and J. Zhang, Inorg. Chem., 2016, 55, 7777–7786 CrossRef CAS PubMed.
- R. Shi, Y. Huang, Y. Tao, P. Dorenbos, H. Ni and H. Liang, Inorg. Chem., 2018, 57, 8414–8421 CrossRef CAS PubMed.
- X. Kang, W. Lu, H. Wang and D. Ling, Mater. Res. Bull., 2018, 108, 46–50 CrossRef CAS.
- W. Wang, Y. Pan, Y. Zhu, H. Xu, L. Zhou, H. M. Noh, J. H. Jeong, X. Liu and L. Li, Dalton Trans., 2018, 47, 6507–6518 RSC.
- Y. Zhu, Y. Pan, W. Wang, Z. Xu, Q. Luo, L. Zhou, X. Liu and L. Li, Ceram. Int., 2019, 45, 14360–14365 CrossRef CAS.
- Y. Huang, K. Jang, H. S. Lee, E. Cho, J. Jeong, S.-S. Yi, J. H. Jeong and J. H. Park, Phys. Procedia, 2009, 2, 207–210 CrossRef CAS.
- L. Wang, M. Xu, H. Zhao and D. Jia, New J. Chem., 2016, 40, 3086–3093 RSC.
- Z. Wang, P. Li, Z. Yang and Q. Guo, J. Lumin., 2012, 132, 1944–1948 CrossRef CAS.
- G. Zhu, Y. Shi, M. Mikami, Y. Shimomura and Y. Wang, Mater. Res. Bull., 2014, 50, 405–408 CrossRef CAS.
- P. Dorenbos, Phys. Rev. B: Condens. Matter Mater. Phys., 2000, 62, 15640–15649 CrossRef CAS.
- P. Dorenbos, J. Lumin., 2000, 91, 155–176 CrossRef CAS.
- M. Jiao, N. Guo, W. Lu, Y. Jia, W. Lv, Q. Zhao, B. Shao and H. You, Inorg. Chem., 2013, 52, 10340–10346 CrossRef CAS PubMed.
- G. Li, D. Geng, M. Shang, Y. Zhang, C. Peng, Z. Cheng and J. Lin, J. Phys. Chem. C, 2011, 115, 21882–21892 CrossRef CAS.
| This journal is © The Royal Society of Chemistry 2019 |

