 Open Access Article
Hydrogen peroxide-assisted synthesis of oxygen-doped carbon nitride nanorods for enhanced photocatalytic hydrogen evolution†
Jiwei Liu‡
ab,
Guangzhou Ding‡a,
Jieyi Yub,
Xianguo Liub,
Xuefeng Zhangb,
Junjie Guo b,
Wei Ren
 c,
Jincang Zhangc and
Renchao Che
 *a
*a
aLaboratory of Advanced Materials, Department of Materials Science, Collaborative Innovation Center of Chemistry for Energy Materials, Fudan University, Shanghai 200438, China. E-mail: rcche@fudan.edu.cn
bCollege of Materials and Environmental Engineering, Hangzhou Dianzi University, Hangzhou 310012, China
cMaterials Genome Institute, International Center for Quantum and Molecular Structures, Shanghai University, Shanghai 200444, China
First published on 9th September 2019
Abstract
Polymer-derived carbon nitrides based photocatalysts are very promising for solar water splitting, CO2 reduction and environmental remediation. However, these photocatalysts still suffer from low visible light utilization efficiency, rapid recombination of photogenerated charge carriers and slow transfer kinetics. Herein, we report a hydrogen peroxide-assisted hydrothermal strategy to synthesize one-dimensional oxygen-doped carbon nitrides (OCN) for photocatalytic hydrogen evolution. A possible self-assembly mechanism is discussed. Experimental results and theoretical calculations indicate that the as-synthesized one-dimensional OCN possess narrowed band gap energy and optimized band structure, which may allow more effective visible-light harvesting and facilitate photogenerated electron–hole pair separation and transfer. As a result, the photocatalytic hydrogen evolution rates improve from 10.4 μmol h−1 to 74.0 μmol h−1 under visible light (λ > 400 nm), which is among the best of the reported CN-based photocatalysts for visible-light-driven hydrogen evolution. This study provides a new avenue toward the development of highly efficient carbon nitrides based photocatalysts for photocatalytic applications.
1. Introduction
As fossil fuels, such as coal, oil, and natural gas cause the serious problems of energy crisis and environmental contamination in modern society, there is urgency to find clean and renewable energy alternatives for achieving sustainable development.1 Since Fujishima and Honda first discovered photoelectrochemical water splitting in 1972, photocatalysis has been regarded as a green and sustainable method for hydrogen production and degradation of pollutants. During the past decades, great efforts have been devoted to developing low-cost, earth-abundant, efficient and durable photocatalysts.2,3 Due to their low cost, excellent stability, and good optical and electronic properties, polymeric carbon nitrides (PCN) based on triazine or tri-s-triazine units are of considerable interest in photocatalytic applications, including water splitting,4,5 CO2 reduction,6,7 and environmental remediation.8,9In principle, light harvesting, charge carriers separation and transfer, and surface redox reactions are three essential steps for photocatalysis. Therefore, the development of efficient photocatalysts is mainly focused on three aspects: enhancing light harvesting, reducing charge carriers recombination, and accelerating surface redox kinetics.4 One of the challenges for the utilization of PCN-based photocatalysts is inherently wide band gap, severe charge carrier recombination, and lack of surface active sites. To date, various strategies have been adopted to improve the photocatalytic performance of the PCN, such as elemental doping,10,11 copolymerization,12,13 surface functionalization,14,15 nanostructure engineering,16,17 heterostructure,18,19 and so on. Although a number of efforts have been made, it is still necessary to explore alternative strategies for rational design of highly efficient PCN-based photocatalysts.
It is well-known that the photocatalytic properties of nanomaterials depend not only on their chemical compositions but also sensitively on their morphologies. One-dimensional (1D) nanostructures (tubes, rods, wires, fibers, etc.) have recently received great attention in photocatalytic applications because of their high surface-to-volume ratio, abundant active sites, and excellent electrical and mechanical properties.20,21 For example, Yuan et al. have synthesized porous and low-defect graphitic carbon nitride nanotubes for efficient hydrogen evolution under visible light irradiation.22 Cao and co-workers have reported the preparation of graphitic-C3N4 nanofibers with enhanced photocatalytic activity in the RhB photodegradation.23 Very recently, Qu et al. have demonstrated an interconnected framework of mesoporous graphitic-C3N4 nanofibers merged with in situ incorporated nitrogen-rich carbon, which exhibit an extremely high hydrogen evolution rate without cocatalysts.24 However, fabrication of 1D PCN is very difficult because its self-assembly process is very complicated. To the best of our knowledge, there are few reports on the synthesis of 1D PCN-based photocatalysts toward highly efficient photocatalytic applications.
Herein, we developed a hydrogen peroxide-assisted hydrothermal strategy to synthesize 1D oxygen-doped carbon nitrides (OCN). Due to enhanced visible-light harvesting and improved charge carriers separation/transfer, the as-synthesized 1D OCN exhibited superior photocatalytic hydrogen performance compared to pristine PCN nanosheets under visible light Moreover, a possible self-assembly mechanism was discussed.
2. Experimental section
2.1. Materials
Melamine, thiourea, ammonium chloride, sodium sulfate anhydrous (Na2SO4), hydrogen peroxide (H2O2, 30%), triethanolamine and ethanol were obtained from Shanghai Sinopharm Chemical Reagent Co., Ltd. Dihydrogen hexachloroplatinate hexahydrate (H2PtCl6·6H2O) were purchased from Sigma-Aldrich. All chemicals were of analytical grade and used as received. Deionized water was obtained from Milli-Q system (Millipore, Bedford, MA) and used in all experiments.2.2. Synthesis of 1D OCN
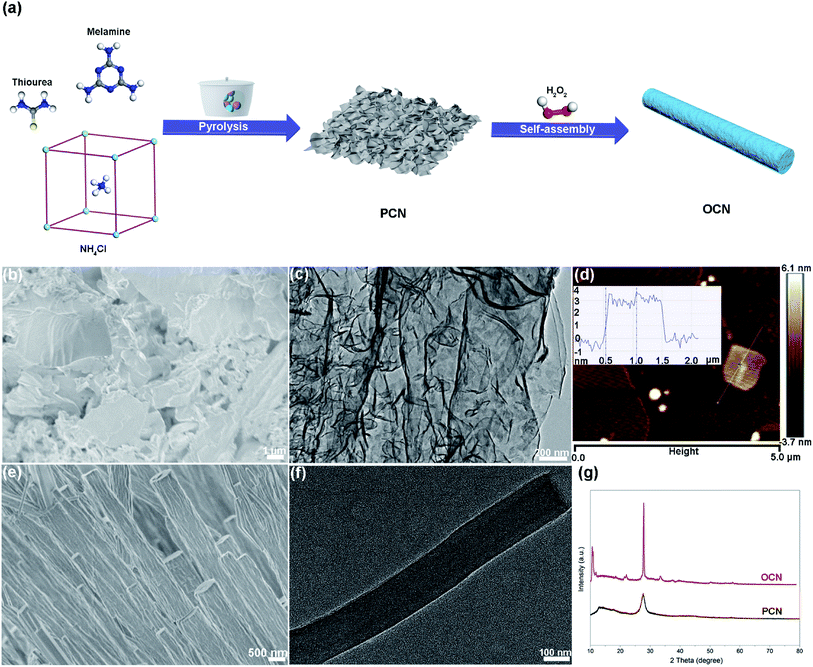
The H2O2-assisted synthesis of the 1D OCN was schematically illustrated in Fig. 1a. PCN nanosheets were first prepared by heating a mixture of melamine, thiourea and ammonium chloride at 550 °C for 4 h.25 Typically, 1 g of melamine, 1 g of thiourea and 10 g of ammonium chloride were fully mixed, placed in a closed crucible and heated at 550 °C for 4 h with a heating rate of 2 °C min−1. Then, 120 mg of the as-prepared PCN nanosheets was dispersed into 40 mL of deionized water under ultrasonication for 30 min to form a uniform aqueous solution. After that, 120 μL of 30% H2O2 were added into the above solution with magnetic stirring for 1 h. The mixed solution was then transferred into a Teflon-lined stainless-steel autoclave with a capacity of 50 mL. The autoclave was heated at 180 °C for 24 h and then allowed to cool to room temperature. Finally, the products were centrifuged and rinsed with ethanol and water several times and dried at 70 °C for 6 h in vacuum.2.3. Characterization
Powder X-ray diffraction (XRD) measurements were acquired using a Bruker D8 X-ray diffractometer (Bruker, Germany) with Ni-filtered Cu Kα radiation (40 kV, 40 mA). Atomic force microscopy (AFM) images were obtained by using a Multimode 8 (Bruker, Germany) in the tapping mode. The size and morphology of the products were characterized by a field-emission scanning electron microscope (FESEM, S-4800, HITACHI, Japan) and transmission electron microscope (TEM, JEM-2100F, JEOL, Japan). Fourier transform infrared spectroscopy (FTIR) was determined by a Thermo Fisher Nicolet 6700 spectrometer (ThermoFisher, USA). X-ray photoelectron spectroscopy (XPS) measurements were recorded on KRATOS Axis Ultra Dld (SHIMADZU, Japan) equipped with a monochromatic X-ray source (Al Kα, hν = 1486.6 eV). UV-vis diffused reflectance spectra (UV-vis DRS) of the samples were analyzed using a UV-3600 UV-vis-NIR spectrophotometer (SHIMADZU, Japan) at room temperature. Photoluminescence (PL) spectrum was recorded on a on a Fluorescence Spectrophotometer (F-7000, HITACHI, Japan) at an excitation wavelength of 380 nm. The transient state fluorescence spectra were tested by fluorescence spectrometer (FLS920, Edinburgh Instruments, UK). Nitrogen adsorption isotherm measurements were carried out at 77 K with a Micromeritics Tristar 3020 analyzer (USA).2.4. Photocatalytic H2 evolution
Photocatalytic H2 evolution was performed in a LabSolar H2 photocatalytic hydrogen evolution system (Perfectlight, China). A MICROSOLAR300 Xe lamp with an UV-cutoff filter (λ > 400 nm) was utilized as the visible light source. 50 mg of photocatalyst was added to an aqueous solution that contained 90 mL of water and 10 mL of triethanolamine. 1 wt% of Pt nanoparticles as cocatalyst were loaded onto the surface of the photocatalyst by in situ photodeposition using H2PtCl6·6H2O as the precursor. The reaction temperature was maintained at 5 °C and the reactor was irradiated with the Xe lamp under magnetic stirring. A gas chromatograph (GC7900, Techcomp, Shanghai) with a TCD detector was connected to the closed reaction system to determine the H2 evolution online. To investigate the stability of the photocatalyst, the photocatalytic process was cycled after the closed gas circulation system was evacuated regularly each 4 h. The photo intensity was determined by an optical power meter and the irradiation area was 19.6 cm2. The apparent quantum efficiency (AQE) was calculated based on the following equation:2.5. Photoelectrochemical measurement
Photoelectrochemical properties were measured using a CHI 660E electrochemical workstation (Chenhua, China) in a standard three-electrode system. A MICROSOLAR300 Xe lamp with an UV-cutoff filter (λ > 400 nm) was utilized as the visible light source. A working electrode was prepared as follows: 5 mg of samples were dispersed in an aqueous solution containing 0.8 mL of water, 0.2 mL of ethanol and 40 μL of 5 wt% Nafion under sonication. 200 μL of the mixture was coated onto a 1 × 2 cm2 fluorine-doped tin oxide (FTO) glass by a drop casting method, and then dried in an oven and calcined at 150 °C for 1 h. A Pt wire was used as counter electrode, and an Ag/AgCl electrode was the reference electrode. The electrolyte was 0.5 M Na2SO4 aqueous solution degassed with Ar. The transient photocurrents were recorded with an applied voltage of 0.5 V vs. Ag/AgCl, and Mott–Schottky (MS) curves were measured under dark condition (1 kHz). Meanwhile, electrochemical impedance spectroscopy (EIS) were obtained under visible-light irradiation in the frequency range from 100 kHz to 1 Hz.3. Results and discussion
3.1. Structure and morphology of the photocatalysts
Typical FESEM and TEM images of the PCN clearly demonstrate a well-defined sheet-like structure with wrinkles (Fig. 1b and c). As shown in Fig. 1d, the AFM image and corresponding height profile reveal a few-layered nanosheet morphology with a uniform thickness of about 3.0 nm, which is structurally analogous to graphene. The 1D OCN was then obtained by hydrothermal treatment of the PCN nanosheets with H2O2 at 180 °C for 24 h. The morphology of the OCN was investigated by FESEM and TEM. It can be clearly seen in Fig. 1e and f that the OCN exhibited a rod-like shape with a diameter of 200–500 nm and length of several tens of micrometers. XRD pattern of the PCN nanosheets showed two distinct diffraction peaks at 27.5° and 13.0° (Fig. 1g), which can be indexed as (002) and (100) characteristic peaks of graphitic materials, respectively. The former is derived from the stacking of the conjugated aromatic system, and the latter can be attributed to the in-plane ordering of tri-s-triazine units. As for the OCN, both the (002) and (100) peaks became more pronounced and sharper compared to the PCN. Moreover, the (002) and (100) peaks shifted to larger angle (27.9°) and smaller angle (10.8°), respectively, indicating the reconstruction of the stacking and in-plane ordering of conjugated aromatic units. This phenomenon could be attributed to the hydrolysis/oxidation of the nanosheets and the formation of rod-like structure. It is worth mentioning that the OCN was very sensitive to the electron beam under TEM observation. As shown in Fig. S1 in the ESI,† a porous structure can be obtained after irradiation for a few seconds. Nevertheless, the structural disorder in the OCN might be beneficial for the band structure engineering and the separation and transfer of photogenerated charge carriers.163.2. XPS and FTIR analyses
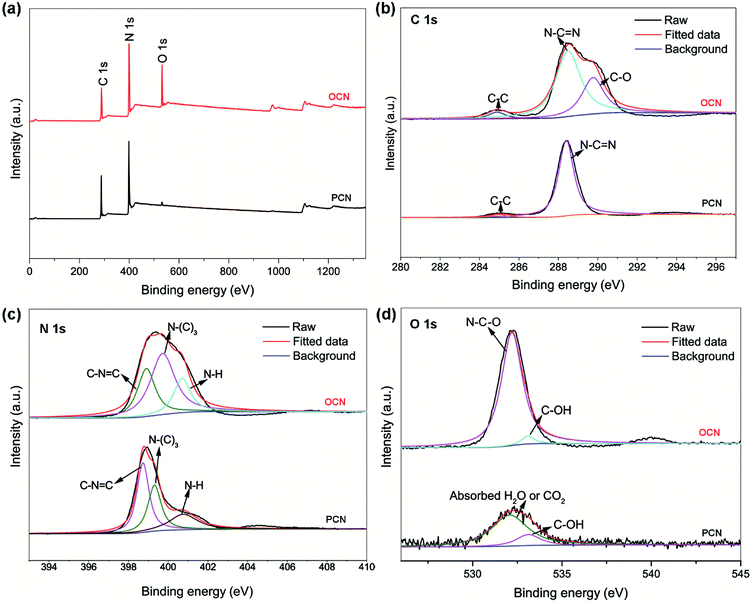
XPS was conducted to investigate the chemical compositions and the nature of chemical bonding. As shown in Fig. 2a, the survey XPS spectra of the PCN and OCN reveal the presence of C, N and O elements. It is noteworthy that the presence of a small O 1s signal in the PCN is probably due to the absorbed oxygen species. Fig. 2b shows the high-resolution XPS C 1s spectra. The peak at 284.8 eV can be assigned to the sp2 C–C bonds of graphitic carbon, while the strong one at 288.5 eV can be attributed to N–C![[double bond, length as m-dash]](https://www.rsc.org/images/entities/char_e001.gif) N configuration, which correspond to those of the PCN. Compared with the PCN, an emerging broad peak at 289.8 eV may originate from the C–O bonds, which implies a partial oxidation of C in the OCN. Fig. 2c shows the high-resolution XPS N 1s spectra, which can be deconvoluted into three peaks. For the PCN, the peaks at 398.7, 399.3 and 400.8 eV can be attributed to sp2-hybridized N (C–N
N configuration, which correspond to those of the PCN. Compared with the PCN, an emerging broad peak at 289.8 eV may originate from the C–O bonds, which implies a partial oxidation of C in the OCN. Fig. 2c shows the high-resolution XPS N 1s spectra, which can be deconvoluted into three peaks. For the PCN, the peaks at 398.7, 399.3 and 400.8 eV can be attributed to sp2-hybridized N (C–N![[double bond, length as m-dash]](https://www.rsc.org/images/entities/char_e001.gif) C), tertiary N (N–(C)3), and terminal amino groups (C–NH), respectively. After the hydrothermal treatment, the peaks at 398.7 and 399.3 eV shift upward to 398.9 and 399.7 eV, respectively, which can be attributed to the introduction of oxygen in the PCN framework.16,23 Quantification analysis shows the C/N ratio of 0.69 and 0.71 in the PCN and OCN, respectively, a little lower than the stoichiometry of the theoretical material (C/N = 0.75). In the O 1s spectra (Fig. 2d), the weak peaks at 531.8 and 533.2 eV in the PCN belong to the adsorbed H2O or C–OH groups. O-doping in the OCN can be confirmed by the presence of the stronger peak at 532.5 eV, which are due to the presence of N–C–O groups.26 The actual doping of oxygen is calculated to be 15.5%. Additionally, the XPS data shows atomic percentage of the C–N
C), tertiary N (N–(C)3), and terminal amino groups (C–NH), respectively. After the hydrothermal treatment, the peaks at 398.7 and 399.3 eV shift upward to 398.9 and 399.7 eV, respectively, which can be attributed to the introduction of oxygen in the PCN framework.16,23 Quantification analysis shows the C/N ratio of 0.69 and 0.71 in the PCN and OCN, respectively, a little lower than the stoichiometry of the theoretical material (C/N = 0.75). In the O 1s spectra (Fig. 2d), the weak peaks at 531.8 and 533.2 eV in the PCN belong to the adsorbed H2O or C–OH groups. O-doping in the OCN can be confirmed by the presence of the stronger peak at 532.5 eV, which are due to the presence of N–C–O groups.26 The actual doping of oxygen is calculated to be 15.5%. Additionally, the XPS data shows atomic percentage of the C–N![[double bond, length as m-dash]](https://www.rsc.org/images/entities/char_e001.gif) C and C–NH configurations decrease from 44.8% and 22.7% to 29.1% and 19.8%, respectively, while the value of the N–(C)3 groups increases from 32.5% to 51.1% (Table S1, ESI†). All these data indicate that some sp2-hybridized N in the PCN could be substituted by O atoms during the hydrothermal treatment, leading to decreased C–N
C and C–NH configurations decrease from 44.8% and 22.7% to 29.1% and 19.8%, respectively, while the value of the N–(C)3 groups increases from 32.5% to 51.1% (Table S1, ESI†). All these data indicate that some sp2-hybridized N in the PCN could be substituted by O atoms during the hydrothermal treatment, leading to decreased C–N![[double bond, length as m-dash]](https://www.rsc.org/images/entities/char_e001.gif) C value and increased C/N ratio in the OCN. By oxidation of the tertiary N, more N–C–O and C–OH groups were generated in the OCN.27
C value and increased C/N ratio in the OCN. By oxidation of the tertiary N, more N–C–O and C–OH groups were generated in the OCN.27
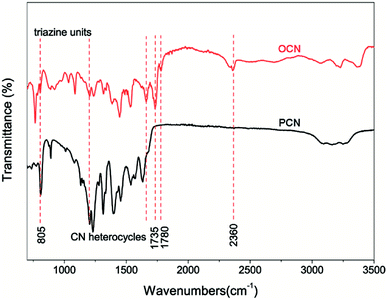
Fig. 3 shows the FTIR spectra to confirm the chemical structure of the samples. In the FTIR spectrum of the PCN, the peak at 805 cm−1 can be attributed to the characteristic breathing mode of tri-s-triazine units, and the peaks from 1200 to 1700 cm−1 correspond to the typical stretching vibration modes of CN heterocycles. The broad peaks between 3500 and 3000 cm−1 can be assigned to the stretching modes of uncondensed amino and O–H groups.28,29 Compared to the PCN, new peaks emerge at 1735 and 1780 cm−1 for the OCN, suggesting the formation of carbonyl groups. The peak around 2360 cm−1 may be ascribed to the overtone/combination tone of the stretching mode and bending mode of C–O. The results imply that some triazine rings of the PCN framework are broken and sp2 C–N bonds are replaced by the C–OH or N–C–O bonds, which coincide well with the XPS analysis.
3.3. Formation mechanism
To study the formation mechanism of the OCN, time-dependent FESEM and TEM observations of the hydrothermal process were carried out. Fig. 4 shows typical FESEM and TEM images of the samples obtained at different hydrothermal times. It can be seen in Fig. 4a and f that the product remained the nanosheet morphology after 3 h of the hydrothermal reaction. After continuous hydrothermal reaction for 6 h, the PCN nanosheets were gradually dissolved to form short nanorods (Fig. 4b and g). As the reaction time was prolonged to 9 h, long nanorods of several micrometer in length could be seen in Fig. 4c and h. The nanosheets were largely dissolved when the reaction time was prolonged to 12 h, generating a large amount of nanorods (Fig. 4d and i). It can be clearly seen in Fig. 4e and j that pure rod-like structure could be obtained after 24 h of the hydrothermal reaction. On the basis of the above observations, we propose a plausible mechanism for the formation of the OCN (Fig. S2, ESI†). The formation of the 1D OCN contains chemical tailoring, self-assembly and re-polymerization of the heptazine units. During the hydrothermal reaction in the H2O2 solution, H2O2 decomposed into oxygen, which induced the hydrolysis/oxidation of the PCN nanosheets. Part of the bridged tertiary nitrogen could be further cut off and the nanosheets would be tailored into smaller pieces comprising heptazine units with –NH and –OH groups. There might be more hydrogen bonds between N–H and O–H, which was quite important in the self-assembly process. With the increasing time, these smaller pieces could be rearranged and reassembled into nanorods by intermolecular hydrogen bonding and interlayer π–π stacking during recrystallization.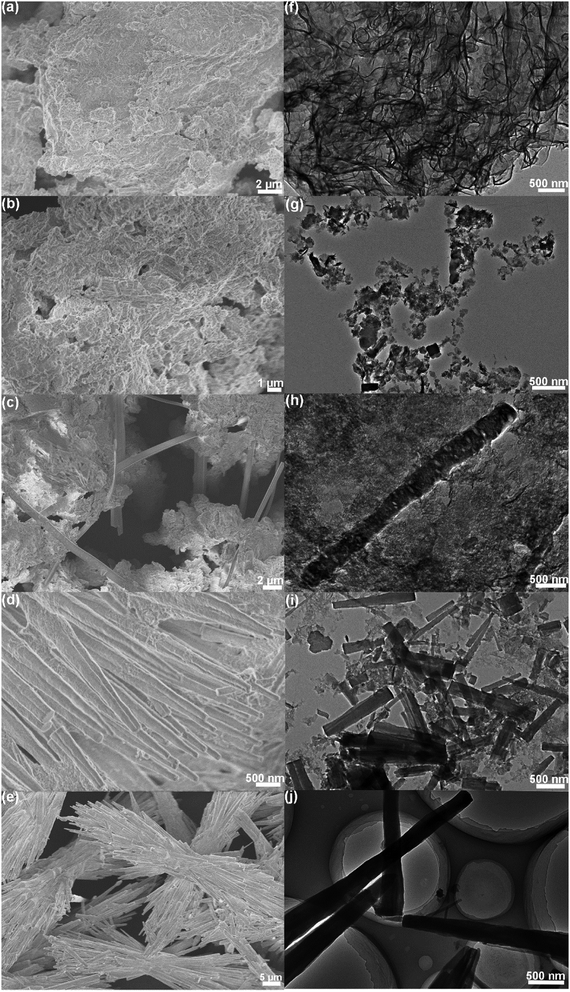 | ||
| Fig. 4 (a–e) FESEM and (f–j) TEM images of the samples obtained at different hydrothermal times: (a and f) 3 h, (b and g) 6 h, (c and h) 9 h, (d and i) 12 h and (e and j) 24 h. | ||
3.4. UV-vis DRS and Mott–Schottky spectra
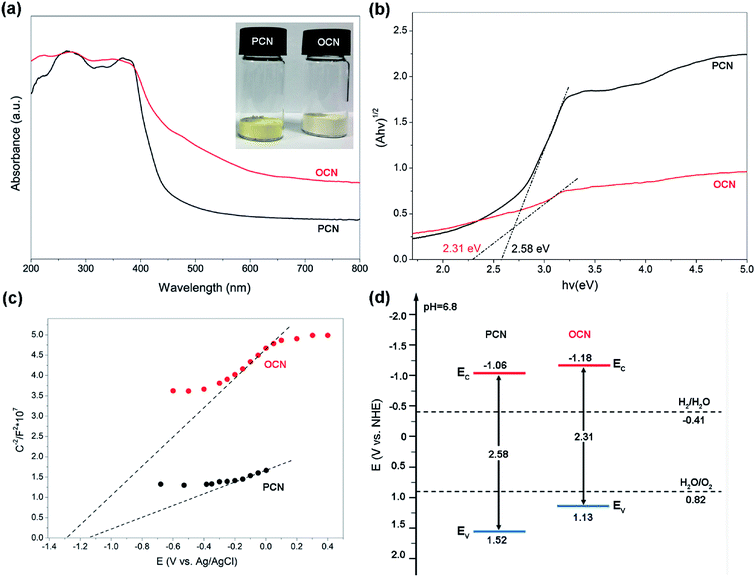
UV-vis DRS of the PCN and OCN are shown in Fig. 5a. It can be found that there is an absorption threshold value of 481 nm in the intrinsic absorption of the PCN. The OCN exhibits red shift and an absorption edge at 537 nm, which would be highly beneficial for absorbing the visible light in the solar spectrum. Moreover, the samples appear in different colors ranging from yellow to ivory white (inset, Fig. 5a). The color change may be ascribed to the enhanced absorption of visible light. The band gaps of the PCN and OCN are determined by the transformational Tauc plots obtained from the Kubellka–Munk function. As shown in Fig. 5b, the band gaps of the PCN and OCN can be estimated as 2.58 and 2.31 eV, respectively. Fig. 5c shows the Mott–Schottky plots to determine the flat-band potentials. It is apparent that both the PCN and OCN show a positive linear slope, indicating n-type conductivity. According to the intersections, the flat-band potentials of the PCN and OCN are deduced to be −1.16 and −1.28 eV (vs. Ag/AgCl), respectively. For n-type semiconductors, it has been reported that the conduction band (CB) are normally ∼0.1 eV more negative than the flat-band potential. According to the equation Evs. NHE = Evs. Ag/AgCl + 0.197, the CB values can be determined to be −1.06 and −1.18 eV (vs. NHE) for the PCN and OCN, respectively. Together with the band gap values from the UV-vis DRS, the band structure diagram can be depicted in Fig. 5d. It can be seen that the CB of the OCN is more negative than that of the PCN, indicating a stronger reduction ability for photogenerated electrons. However, the valence band (VB) of the OCN (1.13 V vs. NHE, pH 6.8) is less positive than that of the PCN (1.52 V vs. NHE, pH 6.8), which was in good agreement with the absorption edge red-shifted to longer wavelengths with lower energies from UV-vis DRS. Both the positions of CB and VB for the PCN and OCN straddle the reduction and oxidation potentials of water and can be eligible for the photocatalytic hydrogen or oxygen evolution.3.5. DFT calculation
In order to understand the origin of the change in electronic and optical properties of the OCN, the band structure and partial density of states (PDOS) for the PCN and OCN were calculated (Fig. 6). It can be clearly seen that the electronic DOS for the PCN exhibit a semiconductor character, where Fermi level is located within the middle of the band gap. In contrast, for the OCN, a narrower band gap can be observed with electron distribution around the Fermi level. The calculated band gap values of the PCN (2.76 eV) and OCN (2.35 eV) are a little larger than experimental ones due to the limitations of DFT calculations. Nevertheless, these results could still reveal that the OCN possess a relatively narrow band gap, which can improve the electrical conductivity and facilitate the charge transfer.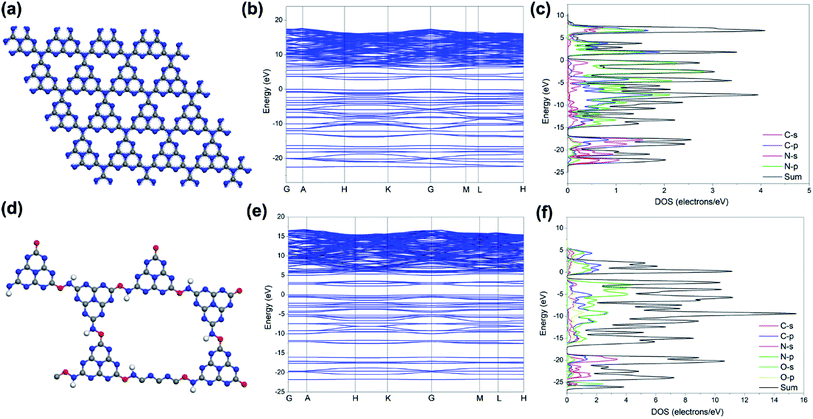 | ||
| Fig. 6 (a and d) Structure models of the PCN and OCN (gray: C; blue: N; red: O). (b and e) Calculated band structures and (c and f) corresponding PDOS for the PCN and OCN, respectively. | ||
3.6. Photocatalytic activity and stability
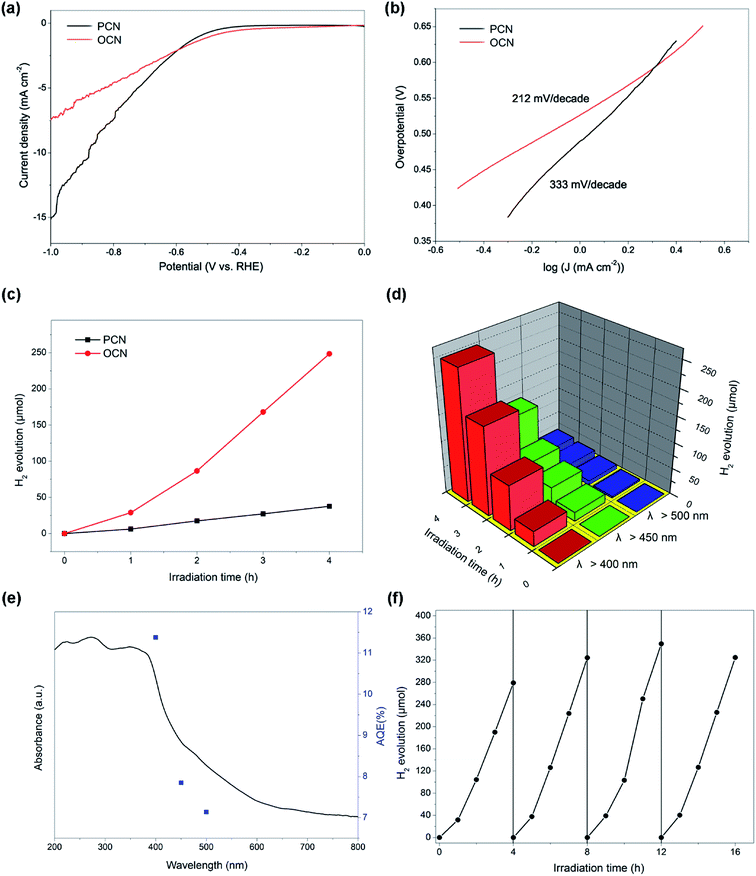
Fig. 7a shows the HER polarization curves of the samples with the 5 mV s−1 of scan rate between −1.0 and +0.2 V vs. RHE (reversible hydrogen electrode). The polarization curves exhibit increasing current densities with the decrease of cathodic potential, corresponding to the water reduction to evolve hydrogen. It can be seen that the OCN presents a lower onset potential and higher current densities (under the potential beyond −0.6 V vs. RHE) than the PCN. Moreover, based on the polarization curves, Tafel plots can be obtained according to the equation of η = a + b![[thin space (1/6-em)]](https://www.rsc.org/images/entities/char_2009.gif) log
log![[thin space (1/6-em)]](https://www.rsc.org/images/entities/char_2009.gif) j (η, j, and b were the overpotential, current density, and Tafel slope, respectively, and a was the intercept). As shown in Fig. 7b, the Tafel slope values for the PCN and OCN can be calculated to be 333 and 212 mV dec−1, respectively, suggesting the similar reaction pathways and favorable reaction kinetics and enhanced photocatalytic activity of the OCN. Afterwards, we tested the photocatalytic hydrogen evolution activity. It should be noted that no hydrogen was detected in the absence of either photocatalyst or visible light irradiation. Fig. 7c shows the photocatalytic hydrogen evolution of the PCN and OCN as a function of time under the visible light irradiation (λ > 400 nm). The hydrogen evolution rate of the PCN under λ > 400 nm was 10.4 μmol h−1. Notably, the OCN displays an enhanced hydrogen evolution rate (74.0 μmol h−1), which is ∼7 times higher than that of the PCN. Moreover, the OCN exhibits the hydrogen evolution rates of 32.9 and 4.7 μmol h−1 under visible-light irradiation (λ > 450 nm and 500 nm), respectively (Fig. 7d). The AQE for the OCN was calculated to be 11.38%, 7.85% and 5.84% at λ > 400 nm, 450 nm and 500 nm, respectively (Fig. 7e), which could approximatively match with the UV-vis DRS of the OCN. We also compared the photocatalytic hydrogen evolution activity of the OCN with previously reported CN-based photocatalysts (Table S2, ESI†), indicating that the OCN possesses superior photocatalytic H2 production activities.30,31 In addition, the photocatalytic stability of the OCN was tested. We repeat the hydrogen evolution experiments 4 times. As shown in Fig. 7f, the hydrogen evolution rate of the OCN is mainly unchanged after 16 h, with a consistently excellent activity in each cycling test. No obvious structural changes could be detected after long-term cycles, further implying the superior stability of the OCN (Fig. S3, ESI†). N2 adsorption–desorption isotherms were employed to determine the specific surface area using the Brunauer–Emmett–Teller (BET) method (Fig. S4, ESI†). Both the PCN and OCN exhibit a type IV isotherm with a type H1 hysteresis loop. The OCN demonstrates a BET surface area of 3.6 m2 g−1 and total pore volume of 0.19 cm3 g−1, respectively, compared to 72.5 m2 g−1 and 0.12 cm3 g−1 for the PCN. In addition, the pore size distribution of the OCN reveals a strong and narrow distribution centered at 3.2 nm, while the PCN exhibits a narrow distribution at 3.7 nm and a wide distribution at 24 nm, respectively. Therefore, the enhanced photocatalytic H2 evolution activity of the OCN could not be attributed to the surface area.
j (η, j, and b were the overpotential, current density, and Tafel slope, respectively, and a was the intercept). As shown in Fig. 7b, the Tafel slope values for the PCN and OCN can be calculated to be 333 and 212 mV dec−1, respectively, suggesting the similar reaction pathways and favorable reaction kinetics and enhanced photocatalytic activity of the OCN. Afterwards, we tested the photocatalytic hydrogen evolution activity. It should be noted that no hydrogen was detected in the absence of either photocatalyst or visible light irradiation. Fig. 7c shows the photocatalytic hydrogen evolution of the PCN and OCN as a function of time under the visible light irradiation (λ > 400 nm). The hydrogen evolution rate of the PCN under λ > 400 nm was 10.4 μmol h−1. Notably, the OCN displays an enhanced hydrogen evolution rate (74.0 μmol h−1), which is ∼7 times higher than that of the PCN. Moreover, the OCN exhibits the hydrogen evolution rates of 32.9 and 4.7 μmol h−1 under visible-light irradiation (λ > 450 nm and 500 nm), respectively (Fig. 7d). The AQE for the OCN was calculated to be 11.38%, 7.85% and 5.84% at λ > 400 nm, 450 nm and 500 nm, respectively (Fig. 7e), which could approximatively match with the UV-vis DRS of the OCN. We also compared the photocatalytic hydrogen evolution activity of the OCN with previously reported CN-based photocatalysts (Table S2, ESI†), indicating that the OCN possesses superior photocatalytic H2 production activities.30,31 In addition, the photocatalytic stability of the OCN was tested. We repeat the hydrogen evolution experiments 4 times. As shown in Fig. 7f, the hydrogen evolution rate of the OCN is mainly unchanged after 16 h, with a consistently excellent activity in each cycling test. No obvious structural changes could be detected after long-term cycles, further implying the superior stability of the OCN (Fig. S3, ESI†). N2 adsorption–desorption isotherms were employed to determine the specific surface area using the Brunauer–Emmett–Teller (BET) method (Fig. S4, ESI†). Both the PCN and OCN exhibit a type IV isotherm with a type H1 hysteresis loop. The OCN demonstrates a BET surface area of 3.6 m2 g−1 and total pore volume of 0.19 cm3 g−1, respectively, compared to 72.5 m2 g−1 and 0.12 cm3 g−1 for the PCN. In addition, the pore size distribution of the OCN reveals a strong and narrow distribution centered at 3.2 nm, while the PCN exhibits a narrow distribution at 3.7 nm and a wide distribution at 24 nm, respectively. Therefore, the enhanced photocatalytic H2 evolution activity of the OCN could not be attributed to the surface area.
3.7. Charge transfer and separation analyses
PL analysis was applied to investigate the charge transfer and separation efficiency of photogenerated electrons and holes in the PCN and OCN. As shown in Fig. 8a, the main PL emission peaks centered at 450 nm can be attributed to the band–band PL emission with the energy of light approximately equal to the band gap energy. Compared to the PCN, there is a significant decrease in the PL emission intensity of the OCN, suggesting that the charge recombination of excited electron–hole pairs might be effectively inhibited by the rod-like structure of the OCN. The improved transfer efficiency of charge carriers was also examined by time-resolved fluorescence spectra (Fig. 8b). The emission decay data could be fit by a triexponential function, and three radiative lifetime components with different percentages were summarized in the inset. Compared with the PCN, the OCN displayed an obviously prolonged lifetimes, implying an accelerated charge-transfer mechanism. It is known that the weak van der Waals force among PCN layers is unfavorable for the charge transfer between the adjacent layers and also, the intrinsically π-conjugated planes lead to inefficient random in-plane charge migration.30 Therefore, the increased lifetimes of charge carriers may be relevant to electron transport improvement in the OCN, which would be beneficial for increasing the probability of the photogenerated electrons and holes involving in photocatalytic reaction before recombination. To further evaluate the charge transfer and separation efficiency of the PCN and OCN, EIS and transient photocurrent were carried out (Fig. 8c). The OCN shows a much smaller semicircle in the Nyquist plot, suggesting lower interfacial charge transfer resistance. Under light irradiation, the radius of the semicircle turns smaller in comparison with dark cases. Consistently, the OCN exhibits higher photocurrent density than the PCN (Fig. 8d). These results further confirm efficient separation of electron–hole pairs and charge transfer in the OCN, thus contributing to the enhanced photocatalytic H2 evolution activity.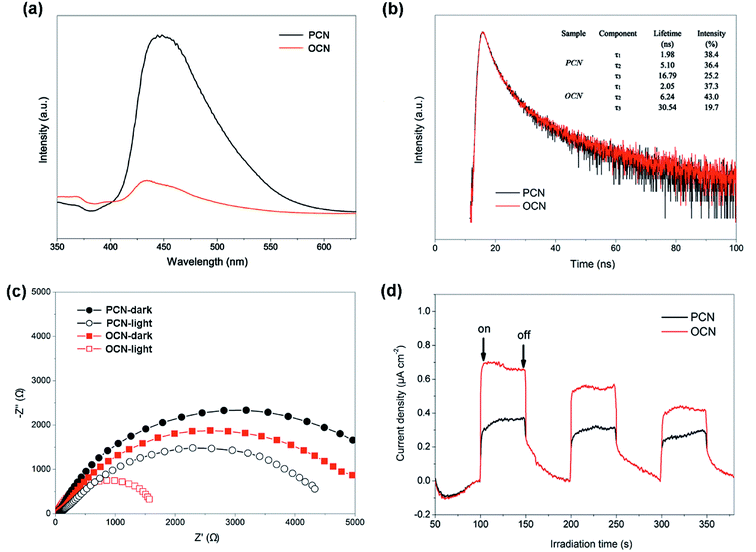 | ||
| Fig. 8 (a) PL and (b) time-resolved PL spectra of the PCN and OCN. (c) EIS and (d) transient photocurrent response of the PCN and OCN with/without visible-light irradiation (λ > 400 nm). | ||
3.8. Proposed photocatalytic mechanism
On the basis of these results, the mechanism of enhanced photocatalytic performance for the OCN is illustrated in Fig. 9. Under visible light irradiation, the OCN will absorb photons and generate electron–hole pairs. The formation of rod-like architecture could reduce the band gap and optimize the electronic structure, which improve the visible light absorption. Meanwhile, the 1D nanostructure would provide high photogenerated electron–hole pairs separation and transfer kinetics. The OCN may exhibit direct transfer of photogenerated electrons along the rod orientation direction for favorable charge separation. The resistance is relative weak and thus little recombination would be achieved, as confirmed by EIS and photocurrent response. The photogenerated electrons can transfer and move toward the surface of Pt cocatalysts and reduce H+ to H2, while the holes on the valence band can be consumed by TEOA. The enhanced photocatalytic H2 evolution performance of the OCN is believed to benefit from the improved visible light activity due to favorable energy gap, enhanced light harvesting, and charge separation and transfer resulting from the 1D nanostructure.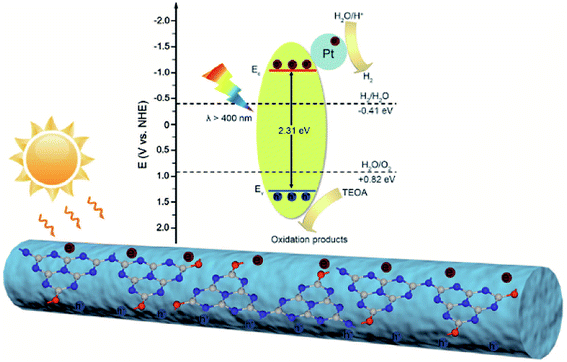 | ||
| Fig. 9 Schematic diagram for charge separation and transfer and H2 evolution mechanism of the OCN under visible-light irradiation. | ||
4. Conclusions
In summary, we have reported a simple and effective approach to synthesize one-dimensional carbon nitride nanorods via a self-assembly process. Benefiting from the 1D nanostructure, the as-synthesized OCN with optimized optical and electronic properties can harvest visible light and separate photogenerated charge carries more efficiently than pristine PCN nanosheets. The photocatalytic hydrogen evolution rates of the 1D OCN can reach up to 74.0 μmol h−1 under visible light (λ > 400 nm), which is ∼7 times higher than that of the PCN nanosheets and among the best of the reported CN-based photocatalysts for visible-light-driven hydrogen evolution. This study offers an avenue to synthesize one-dimensional carbon nitride-based photocatalysts for efficient photocatalytic applications.Conflicts of interest
There are no conflicts to declare.Acknowledgements
This work was financially supported by the Ministry of Science and Technology of China (973 Project No. 2018YFA0209102), National Natural Science Foundation of China (No. 11727807, 51725101, 51672050, 61790581, 51602030), Science and Technology Commission of Shanghai Municipality (16DZ2260600).Notes and references
- S. Chu, Y. Cui and N. Liu, Nat. Mater., 2017, 16, 16–22 CrossRef PubMed.
- A. Kudo and Y. Miseki, Chem. Soc. Rev., 2009, 38, 253–278 RSC.
- J. R. McKone, N. S. Lewis and H. B. Gray, Chem. Mater., 2014, 26, 407–414 CrossRef CAS.
- W. J. Ong, L. L. Tan, Y. H. Ng, S. T. Yong and S. P. Chai, Chem. Rev., 2016, 116, 7159–7329 CrossRef CAS PubMed.
- F. K. Kessler, Y. Zheng, D. Schwarz, C. Merschjann, W. Schnick, X. C. Wang and M. J. Bojdys, Nat. Rev. Mater., 2017, 2, 1–17 Search PubMed.
- S. J. Guo, S. Q. Zhao, X. Q. Wu, H. Li, Y. J. Zhou, C. Zhu, N. J. Yang, X. Jiang, J. Gao, L. Bai, Y. Liu, Y. Lifshitz, S. T. Lee and Z. H. Kang, Nat. Commun., 2018, 8, 1–9 Search PubMed.
- R. Kuriki, K. Sekizawa, O. Ishitani and K. Maeda, Angew. Chem., Int. Ed., 2015, 54, 2406–2409 CrossRef CAS PubMed.
- J. Y. Li, X. A. Dong, Y. J. Sun, G. M. Jiang, Y. H. Chu, S. C. Lee and F. Dong, Appl. Catal., B, 2018, 239, 187–195 CrossRef CAS.
- T. Xiong, H. Wang, Y. Zhou, Y. J. Sun, W. L. Cen, H. W. Huang, Y. X. Zhang and F. Dong, Nanoscale, 2018, 10, 8066–8074 RSC.
- S. Z. Hu, L. Ma, Y. Xie, F. Y. Li, Z. P. Fan, F. Wang, Q. Wang, Y. J. Wang, X. X. Kang and G. Wu, Dalton Trans., 2015, 44, 20889–20897 RSC.
- J. H. Li, B. A. Shen, Z. H. Hong, B. Z. Lin, B. F. Gao and Y. L. Chen, Chem. Commun., 2012, 48, 12017–12019 RSC.
- H. H. Ou, L. H. Lin, Y. Zheng, P. J. Yang, Y. X. Fang and X. C. Wang, Adv. Mater., 2017, 29, 1700008 CrossRef PubMed.
- L. H. Lin, H. H. Ou, Y. F. Zhang and X. C. Wang, ACS Catal., 2016, 6, 3921–3931 CrossRef CAS.
- Y. X. Li, H. Xu, S. X. Ouyang, D. Lu, X. Wang, D. F. Wang and J. H. Ye, J. Mater. Chem. A, 2016, 4, 2943–2950 RSC.
- N. N. Meng, J. Ren, Y. Liu, Y. Huang, T. Petit and B. Zhang, Energy Environ. Sci., 2018, 11, 566–571 RSC.
- Q. Han, Z. H. Cheng, B. Wang, H. M. Zhang and L. T. Qu, ACS Nano, 2018, 12, 5221–5227 CrossRef CAS PubMed.
- D. D. Zheng, X. N. Cao and X. C. Wang, Angew. Chem., Int. Ed., 2016, 55, 11512–11516 CrossRef CAS PubMed.
- Y. T. Lu, D. M. Chu, M. S. Zhu, Y. K. Du and P. Yang, Phys. Chem. Chem. Phys., 2015, 17, 17355–17361 RSC.
- L. L. Bi, D. D. Xu, L. J. Zhang, Y. H. Lin, D. J. Wang and T. F. Xie, Phys. Chem. Chem. Phys., 2015, 17, 29899–29905 RSC.
- Y. N. Xia, P. D. Yang, Y. G. Sun, Y. Y. Wu, B. Mayers, B. Gates, Y. D. Yin, F. Kim and Y. Q. Yan, Adv. Mater., 2003, 15, 353–389 CrossRef CAS.
- M. Tahir, C. B. Cao, N. Mahmood, F. K. Butt, A. Mahmood, F. Idrees, S. Hussain, M. Tanveer, Z. Ali and I. Aslam, ACS Appl. Mater. Interfaces, 2014, 6, 1258–1265 CrossRef CAS PubMed.
- Z. J. Huang, F. B. Li, B. F. Chen and G. Q. Yuan, RSC Adv., 2015, 5, 102700–102706 RSC.
- J. Li, C. B. Cao and H. S. Zhu, Nanotechnology, 2007, 18, 115605 CrossRef.
- Q. Han, B. Wang, J. Gao and L. T. Qu, Angew. Chem., Int. Ed., 2016, 55, 10849–10853 CrossRef CAS PubMed.
- X. L. Lu, K. Xu, P. Z. Chen, K. C. Jia, S. Liu and C. Z. Wu, J. Mater. Chem. A, 2014, 2, 18924–18928 RSC.
- L. Ming, H. Yue, L. Xu and F. Chen, J. Mater. Chem. A, 2014, 2, 19145–19149 RSC.
- H. J. Yu, R. Shi, Y. X. Zhao, T. Bian, Y. F. Zhao, C. Zhou, G. I. N. Waterhouse, L. Z. Wu, C. H. Tung and T. R. Zhang, Adv. Mater., 2017, 29, 1605148 CrossRef PubMed.
- Z. F. Huang, J. J. Song, L. Pan, Z. M. Wang, X. Q. Zhang, J. J. Zou, W. B. Mi, X. W. Zhang and L. Wang, Nano Energy, 2015, 12, 646–656 CrossRef CAS.
- Y. X. Zeng, X. Liu, C. B. Liu, L. L. Wang, Y. C. Xia, S. Q. Zhang, S. L. Luo and Y. Pei, Appl. Catal., B, 2017, 224, 1–9 CrossRef.
- J. Y. Li, Z. Y. Zhang, W. Cui, H. Wang, W. L. Cen, G. Johnson, G. M. Jiang, S. Zhang and F. Dong, ACS Catal., 2018, 8, 8376–8385 CrossRef CAS.
- J. Wang, Z. Yang, W. Q. Yao, X. X. Gao and D. P. Tao, Appl. Catal., B, 2018, 238, 629–637 CrossRef CAS.
Footnotes |
| † Electronic supplementary information (ESI) available: DFT calculations details, TEM images, UV-vis DRS, photocatalytic H2 evolution rates and N2 adsorption–desorption isotherms. See DOI: 10.1039/c9ra04418c |
| ‡ These authors contributed equally to this work. |
| This journal is © The Royal Society of Chemistry 2019 |

