DOI:
10.1039/C9RA04412D
(Paper)
RSC Adv., 2019,
9, 23545-23553
Visible-light photocatalytic performance, recovery and degradation mechanism of ternary magnetic Fe3O4/BiOBr/BiOI composite†
Received
12th June 2019
, Accepted 22nd July 2019
First published on 30th July 2019
Abstract
The ternary magnetic Fe3O4/BiOBr/BiOI (x![[thin space (1/6-em)]](https://www.rsc.org/images/entities/char_2009.gif) :3:1) photocatalysts were successfully synthesized by a facile solvothermal method. The samples were characterized by XRD, SEM, EDS, ICP-AES, XPS, UV-vis DRS, PL and VSM. Nitrogen-containing dye RhB was used as a degradation substrate to evaluate the photocatalytic degradation activities of the samples. The photocatalytic performance of Fe3O4/BiOBr/BiOI (0.4:3:1) is superior to other Fe3O4/BiOBr/BiOI (x:3:1). Compared with binary magnetic Fe3O4/BiOBr (0.5:1) prepared in our previous work, the Fe3O4/BiOBr/BiOI (0.4:3:1) has obvious advantages in photocatalytic activity and adsorption capacity. And the specific surface area (48.30 m2 g−1) is much larger than that of the previous report (Fe3O4/BiOBr/BiOI (0.5:2:2)) synthesized by a co-precipitation method. Besides, after 25 s of magnetic field, Fe3O4/BiOBr/BiOI (0.4:3:1) can be rapidly separated from water. After eight recycling cycles, the magnetic properties, photocatalytic activity, crystallization and morphology of the Fe3O4/BiOBr/BiOI (0.4:3:1) catalyst remain good. The possible photocatalytic degradation mechanism of RhB under Fe3O4/BiOBr/BiOI (0.4:3:1) photocatalyst was also proposed. The results indicate that the ternary magnetic Fe3O4/BiOBr/BiOI (0.4:3:1) composite with high photocatalytic degradation efficiency, good magnetic separation performance and excellent recyclability and stability has potential application prospect in wastewater.
:3:1) photocatalysts were successfully synthesized by a facile solvothermal method. The samples were characterized by XRD, SEM, EDS, ICP-AES, XPS, UV-vis DRS, PL and VSM. Nitrogen-containing dye RhB was used as a degradation substrate to evaluate the photocatalytic degradation activities of the samples. The photocatalytic performance of Fe3O4/BiOBr/BiOI (0.4:3:1) is superior to other Fe3O4/BiOBr/BiOI (x:3:1). Compared with binary magnetic Fe3O4/BiOBr (0.5:1) prepared in our previous work, the Fe3O4/BiOBr/BiOI (0.4:3:1) has obvious advantages in photocatalytic activity and adsorption capacity. And the specific surface area (48.30 m2 g−1) is much larger than that of the previous report (Fe3O4/BiOBr/BiOI (0.5:2:2)) synthesized by a co-precipitation method. Besides, after 25 s of magnetic field, Fe3O4/BiOBr/BiOI (0.4:3:1) can be rapidly separated from water. After eight recycling cycles, the magnetic properties, photocatalytic activity, crystallization and morphology of the Fe3O4/BiOBr/BiOI (0.4:3:1) catalyst remain good. The possible photocatalytic degradation mechanism of RhB under Fe3O4/BiOBr/BiOI (0.4:3:1) photocatalyst was also proposed. The results indicate that the ternary magnetic Fe3O4/BiOBr/BiOI (0.4:3:1) composite with high photocatalytic degradation efficiency, good magnetic separation performance and excellent recyclability and stability has potential application prospect in wastewater.
Introduction
The organic pollutants seriously affect the water environment and threaten human health. In particular, synthetic nitrogen-containing dyes (Rhodamine B (RhB), Methyl orange (MO), Congo red, etc) are one of the largest organic pollutants. Many treatment methods have been developed, such as biological methods, membrane separation technology, electrochemical methods, ozone oxidation and so on.1–3 Among them, photocatalytic technology is considered to be a promising and effective environmental pollutant treatment method with high mineralization efficiency, no secondary pollution, energy savings and simple processes.4,5 In the past few years, many active photocatalysts have been widely studied, and some of them have been successfully industrialized.6 However, the photocatalytic activities of most semiconductor photocatalysts (TiO2, ZnO, CdS, ZnS, etc.)7 are low, and their practical applications are greatly restricted by some defects, such as poor utilization rate of visible light, low separation rate of photogenerated electron–hole pairs, and difficult separation from the water body, etc.8–10 Accordingly, it is necessary to exploit new highly efficient and easily separated visible-light-responsive photocatalysts for degrading organics in water treatment.
In order to alleviate these problems, many attempts have been developed, such as the synthesis of various structures, doping of metal elements, construction of heterojunctions.11,12 The construction of heterojunction photocatalysts has been regarded as an efficient way to solve the above-mentioned defects of single semiconductors. The previously reported heterojunction photocatalysts include BiVO4/TiO2,13 BiOI/BiOBr,14 ZnS/CdS,15 BiVO4/Bi2Ti2O7,16 etc. Although this way improves the photocatalytic activities of the photocatalysts, the separation of the photocatalysts remains difficult.
Due to low-cost, high electrical conductivity (2 × 10⁴ S m−1), excellent magnetic properties (58.0 emu g−1), high theoretical capacity (924 mA h g−1), and eco-friendly properties, Fe3O4 becomes one of the most promising used magnetic materials in Fe3O4, γ-Fe2O3 and MFe2O4.17 Based on the above advantages, Fe3O4 can act as an electron transporter to inhibit recombination of photogenerated electron–hole pairs. In addition, Fe3O4 particles have been modified with photocatalysts to improve adsorption capacity and enlarge the specific surface area of the photocatalysts.18–20 The detailed reasons for choosing Fe3O4 to combine with photocatalysts are: (1) enhancement of specific surface area can increase the active site of the catalyst; (2) excellent magnetic character facilitates the recycling of the photocatalysts; (3) the existence of Fe–OH can improve the adsorptive capacity of the photocatalysts.20 Many heterojunction photocatalysts combined with Fe3O4 particles such as Fe3O4/AgBr/ZnO,21 BiVO4/Bi2Ti2O7/Fe3O4,20 g-C3N4/Fe3O4/MnWO4,22 Ag3PO4/ZnO/Fe3O4,23 etc. have been prepared to enhance the recycling ability. To the best of our knowledge, limited research has been reported about ternary magnetic Fe3O4/BiOBr/BiOI photocatalysts treating organic wastewater under visible light. Gao et al.24 have prepared Fe3O4/BiOBr/BiOI (0.5:2:2) composite by precipitation method to solve the problem that the BiOBr/BiOI (2:2) heterojunction photocatalyst is difficult to be separated from aqueous phase. However, Fe3O4/BiOBr/BiOI (0.5:2:2) composite synthesized by precipitation has the defects of non-uniform particle size and small specific surface area. Because the products prepared by solvothermal approach own high crystallinity, uniform particle size distribution and high yield, solvothermal approach has attracted more and more attention.
In this study, the ternary magnetic Fe3O4/BiOBr/BiOI (x:3:1) (x = 0.2, 0.3, 0.4 and 0.5) photocatalysts were successfully synthesized by a facile solvothermal method. The samples are characterized by X-ray diffraction (XRD), scanning electron microscope (SEM), X-ray photoelectron spectroscopy (XPS), Brunauer–Emmett–Teller (BET), UV-vis diffuse reflection spectroscopy (UV-vis DRS) and photoluminescence analysis (PL). Magnetic properties of magnetic samples were detected by vibrating sample magnetometer (VSM). The photocatalytic activities of the samples were evaluated by degrading RhB. The ternary magnetic Fe3O4/BiOBr/BiOI (0.4:3:1) photocatalyst was used in recycling experiments, and the crystallization, morphology and magnetic properties before and after recycling were detected by XRD, SEM and VSM. Besides, Fe3O4/BiOBr/BiOI (0.4:3:1) photocatalyst was compared the photocatalytic performance, adsorption capacity and magnetic property with those of previous studies. In the end, the mechanism of photocatalytic degradation of RhB under Fe3O4/BiOBr/BiOI (0.4:3:1) photocatalyst was analyzed in detail.
Experimental
Materials and synthesis of the photocatalysts
Materials. Ferric(III) chloride hexahydrate (FeCl3·6H2O) and Rhodamine B (RhB) were obtained from Aladdin. Sodium acetate (NaHCO3), potassium bromide (KBr), potassium iodide (KI), ethanol, ethylene glycol (EG) were gotten from Kermel Chemical Reagent, Tianjin. Bismuth nitrate (Bi(NO3)3·5H2O) was purchased from Macklin. All the chemical reagents were used as received without any further purification.
Synthesis of Fe3O4 nanoparticles. The Fe3O4 particles were prepared by a facile solvothermal method. 1 g (0.005 mol) FeCl3·6H2O were dissolved in 80 ml of EG. 3.6 g NaHCO3 was added in the stirring process. Then, the mixed solution was heated to 50 °C, and stirred evenly, then transferred to 100 ml Teflon-lined autoclave at 180 °C for 12 h. The black solid deposit was washed for three times with ethanol and water, respectively, and separated by magnetic field. The black particles were dried in vacuum at 70 °C for 12 h.
Characterization of the samples
The phase purity and crystal structure of the prepared products were characterized by X-ray diffraction (XRD) analysis. The morphology and microstructures of the particles were investigated by scanning electron microscope (SEM, JSM-7100F), equipped with energy-dispersive X-ray spectroscopy (EDS) to probe elemental analysis. Inductively couple plasma atomic emission spectroscopy (ICP-AES, Varian 720) was used to detect the contents of Fe and Bi elements in Fe3O4/BiOBr/BiOI (0.4:3:1). X-ray photoelectron spectroscopy (XPS) was used to analyze the chemical valence and composition of the ternary magnetic Fe3O4/BiOBr/BiOI (0.4:3:1) composite. The surface area and textural properties were determined by N2 adsorption–desorption isotherms on a Quantachrome instrument (ASIQC 050200-6, USA). The absorption wavelengths of the samples were detected by UV-vis diffuse reflection spectroscopy (UV-vis DRS) on a Hitachi U-4100, Japan. The fate of photogenerated carriers were investigated by photoluminescence analysis (PL) on Elmer fluorescence spectrophotometer. The magnetic properties of magnetic materials were measured by a vibrating sample magnetometer (VSM, LDJ9600).
Photocatalytic activity measurement
The photocatalytic activities of the samples were evaluated by degrading RhB under visible light irradiation. A 500 W Xe lamp with a cutoff filter (λ > 400 nm) was used as light source. The distance between the liquid surface and the light source is 15 cm. 0.035 g of the prepared catalysts were added to 100 mL RhB solution (20 mg L−1). The mixture was mechanically stirred in the dark for 60 minutes to reach absorption–desorption equilibrium between catalyst particles and RhB molecules. The light was then directed at the dispersion at room temperature. About 5 mL dispersion was token and centrifugally separated out catalyst powder. A 52 UV-vis spectrophotometer (Spectrum instruments, Shanghai) was used to analyze the concentrations of RhB. In the recycling experiment, the Fe3O4/BiOBr/BiOI (0.4:3:1) was separated from the dispersion with a magnet and washed with ethanol and ultrapure water several times sequentially.
Detection of final products
RhB molecule contains nitrogen atoms, so the final products (NH4+, NO2− or NO3−) of nitrogen atoms can be used to measure the degradation of RhB. Ammonia nitrogen (NH4+–N), nitrate nitrogen (NO3−–N) or nitrite nitrogen (NO2−–N) can be detected by SP-752 visible spectrophotometer (Spectrum instruments, Shanghai). Ammonia nitrogen (NH4+–N) was detected by Nessler's Reagent Spectrometry at 420 nm. Salicylic acid-concentrated sulfuric acid Spectrophotometry was utilized to determine the concentration of nitrate nitrogen (NO3−–N) at 410 nm. N-(1-Naphthyl)-ethylenediamine Spectrophotometry was used to analyze nitrite nitrogen (NO2−–N) at 540 nm.
Results and discussion
Characterization results
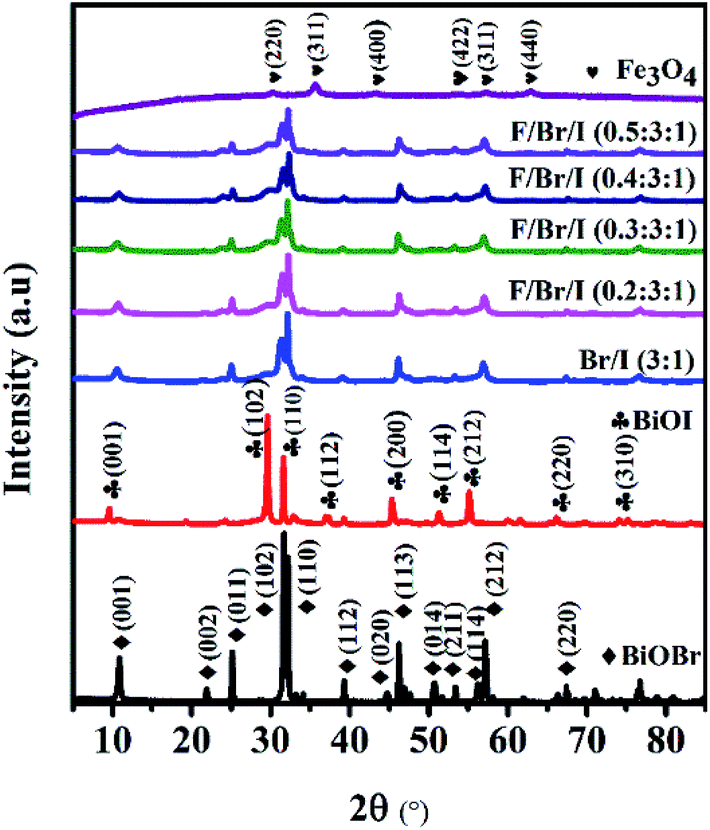
Crystal structure. Fig. 1 shows the XRD patterns of BiOBr, BiOI, Fe3O4 and Fe3O4/BiOBr/BiOI (x:3:1) with different Fe3O4 (x) mole ratios. The strong and sharp diffraction peaks implicate that all prepared products are highly crystalline. The all characteristic peaks of the prepared pure BiOBr and BiOI are well indexed to the tetragonal phase BiOBr (JCPDS no. 73-2061) and BiOI (JCPDS no. 10-0445), respectively. Meanwhile, all diffraction peaks of the prepared Fe3O4 can be clearly corresponded to JCPDS card no. 19-0629. As for the BiOBr/BiOI (3:1) and Fe3O4/BiOBr/BiOI (x:3:1) composites, all peaks are well indexed to tetragonal phase BiOBr, BiOI and the crystal Fe3O4, and no characteristic diffraction peaks of other impurities are observed. The results indicate that the prepared binary BiOBr/BiOI (3:1) and ternary magnetic Fe3O4/BiOBr/BiOI (x:3:1) (x = 0.2, 0.3,0.4 and 0.5) composites are only composed of BiOBr, BiOI and Fe3O4 phases. In addition, the intensity of diffraction peaks of BiOBr and BiOI weaken gradually with the increase of Fe3O4 mole ratios in ternary magnetic Fe3O4/BiOBr/BiOI (x:3:1) (x = 0.2, 0.3,0.4 and 0.5) composites, implying that Fe3O4 particles have been successfully deposited on the surface of BiOBr/BiOI (3:1) composite.26
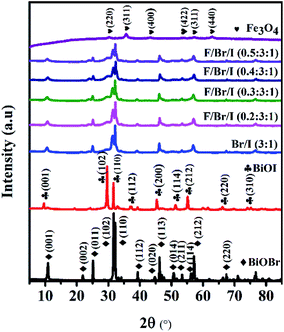 |
| | Fig. 1 XRD patterns of BiOBr, BiOI, Fe3O4 and Fe3O4/BiOBr/BiOI (x:3:1) (x = 0.2, 0.3,0.4 and 0.5) with different Fe3O4 (x) molar ratios (Br/I:BiOBr/BiOI; F/Br/I:Fe3O4/BiOBr/BiOI). | |
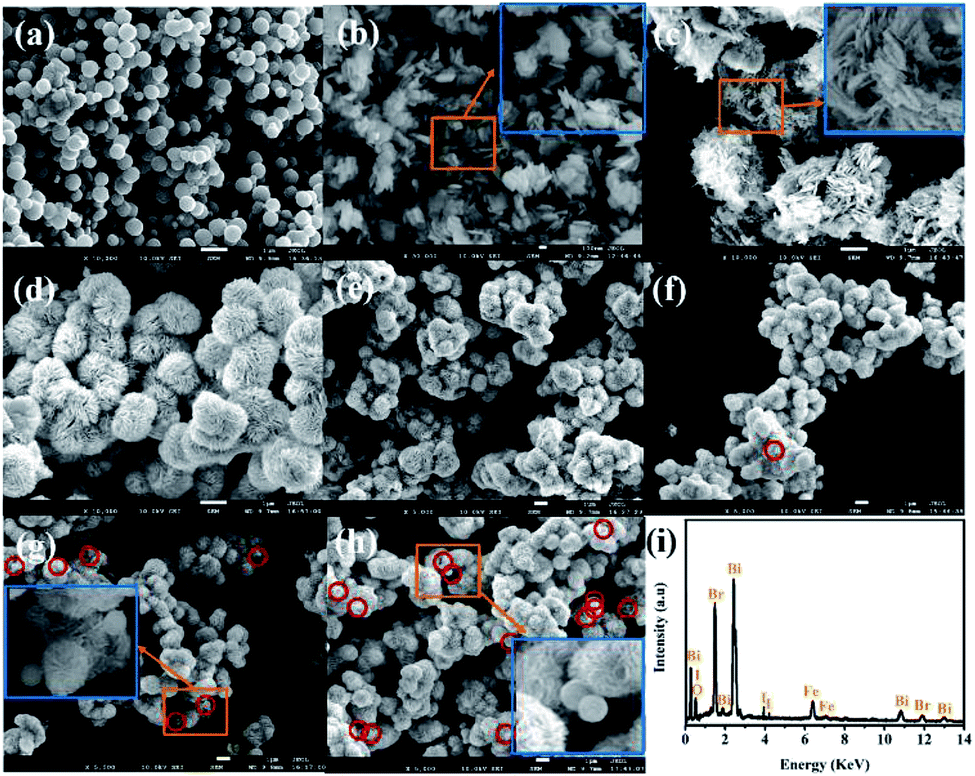
Morphology and composition characterization. As shown in Fig. 2a–c, the prepared pure Fe3O4, BiOBr and BiOI exhibit uniform nanospheres of about 600–700 nm, regular nanosheets of about 100–250 nm and irregular nanosheet structures, respectively. Compounded BiOBr and BiOI with the mole ratio of 3:1, the binary BiOBr/BiOI (3:1) composite shows a uniform flower-like hierarchical microsphere structure with average diameter of about 1600 nm. As for Fe3O4/BiOBr/BiOI (x:3:1) (x = 0.2, 0.3, 0.4 and 0.5) composites, the flower-like hierarchical microsphere structure (Fig. 2e–h) has not changed along with the adding of different mole ratios of Fe3O4. As seen from the enlarged image of Fig. 2g and h, with the increase of mole ratios of Fe3O4, it is obvious that Fe3O4 particles adhere to the surface of the binary BiOBr/BiOI (3:1) composite, which is consistent with the result of XRD analysis.
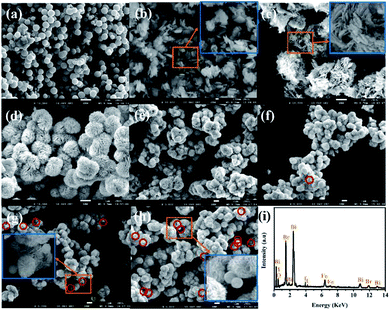 |
| | Fig. 2 SEM image of (a) Fe3O4, (b) BiOBr, (c) BiOI, (d) BiOBr/BiOI (3:1), (e) Fe3O4/BiOBr/BiOI (0.2:3:1), (f) F/Br/I (0.3:3:1), (g) F/Br/I (0.4:3:1) and (h) F/Br/I (0.5:3:1); (i) EDS spectrum of F/Br/I (0.4:3:1) (Br/I:BiOBr/BiOI (3:1); F/Br/I:Fe3O4/BiOBr/BiOI). | |
The chemical composition of the ternary magnetic Fe3O4/BiOBr/BiOI (0.4:3:1) composite was carried out by SEM-EDS elemental mapping when the SEM in scanning mode was operated. The EDS spectrum (Fig. 2i and S1†) shows strong signals of Bi, O, Br, I and Fe elements without detecting any other elements, which demonstrates that the ternary magnetic Fe3O4/BiOBr/BiOI (0.4:3:1) composite is composed of Bi, O, Br, I and Fe elements. What is more, the quantitative result presents the atomic of Bi:O:Br:I:Fe in the ternary magnetic Fe3O4/BiOBr/BiOI (0.4:3:1) composite is 19:33:15:48:57, which is in line with theoretical chemometrics ratio of 20:28:15:5:6 for Bi:O:Br:I:Fe in Fe3O4/BiOBr/BiOI (0.4:3:1) in view of instrumental error, implying that the mole ratio of Fe3O4, BiOBr and BiOI in the ternary magnetic Fe3O4/BiOBr/BiOI (0.4:3:1) composite is 0.4:3:1.
ICP-AES analysis (Table S1†) shows that the mass content (the mass of elements in catalyst per kilogram) of Fe and Bi are 671821.2 and 49761.7 mg kg−1 in Fe3O4/BiOBr/BiOI (0.4:3:1) composite, respectively. The molar ratio of the two is calculated to be 2.77:10, which is basically consistent with stoichiometric ratio of 3:10.
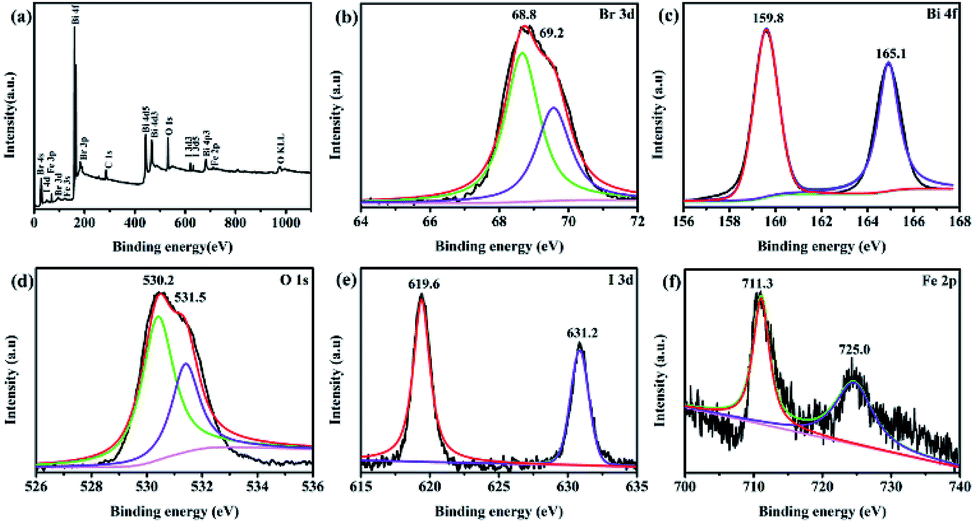
XPS analysis. The typical XPS survey spectrum (Fig. 3a) shows Bi, O, Br, I, Fe and C elements are detected, proving once again that the ternary magnetic Fe3O4/BiOBr/BiOI (0.4:3:1) composite is composed of Bi, O, Br, I and Fe five elements. While C1s at 284.6 eV as the reference for the binding energies of other elements is the adventitious carbon. As seen in Fig. 3b, two peaks with binding energies at 68.8 and 69.2 eV are Br 3d5/2 and Br 3d3/2 peaks, respectively.27 From the spectra shown in Fig. 3c, the peaks for Bi 4f are observed, and contain Bi 4f7/2 (Bi(III)) and Bi 4f5/2 (Bi(V)) peaks.24 As for the O 1s, two different oxygen species are presented, the strong peak located at 530.2 eV corresponds to lattice oxygen in Fe3O4/BiOBr/BiOI (0.4:3:1), and the binding energy situated at 531.5 eV is attributed to the hydroxyl groups attached to the surface of the magnetic catalyst.28 It can be seen from Fig. 3e, the I 3d shows two strong peaks at binding energies of 619.6 and 631.2 eV, which are matched with I 3d5/2 and I 3d3/2, respectively. The result confirms the −1 valence of I in the ternary magnetic composite. In addition, the Fe 2p binding energies of 711.3 and 725.0 eV are attributed to Fe 2p3/2 and Fe 2p1/2, confirming the existence of Fe3+ and Fe2+ in the sample. Through the XPS analysis, Fe3O4, BiOBr and BiOI coexist in the ternary magnetic Fe3O4/BiOBr/BiOI (0.4:3:1) composite, which corresponds to the results of XRD and SEM analysis.
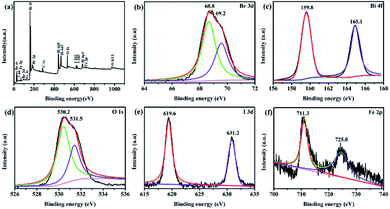 |
| | Fig. 3 XPS spectra of Fe3O4/BiOBr/BiOI (0.4:3:1) sample: (a) survey of the photocatalyst; (b) Br 3d; (c) Bi 4f; (d) O 1s; (e) Fe 2p; (f) I 3d. | |
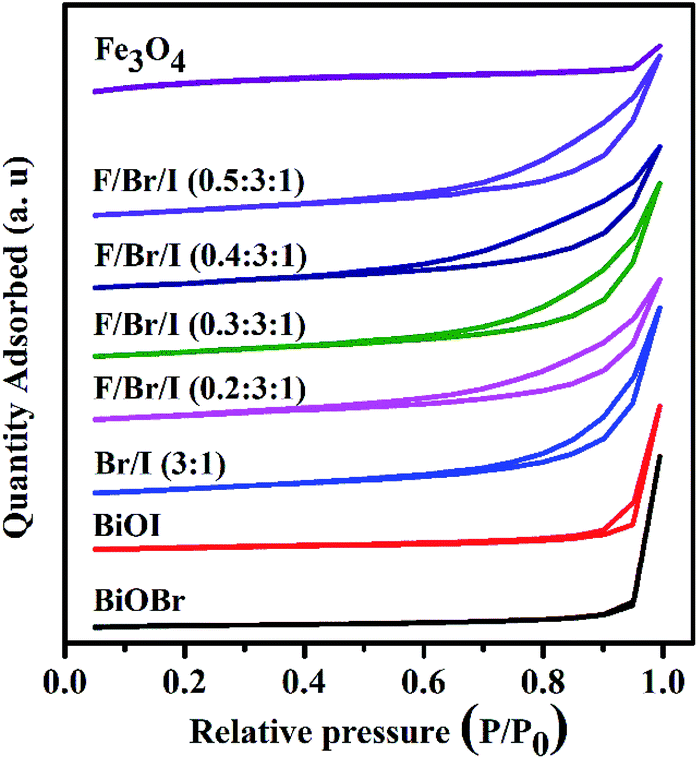
BET surface area analysis. The results of surface area and textural properties are shown in Fig. 4 and Table 2. As shown in Fig. 4, the isotherms of all as-prepared samples correspond to typical IV-type curves with a distinct H3 hysteresis loop (IUPAC classification),29 indicating the presence of 2–50 nm mesopores. The result of average pore diameters (Table 2) confirms this statement. The pure BiOBr and BiOI display relatively small specific surface area of 14.41 and 14.03 m2 g−1, and relatively large average pore diameters of 52.76 and 51.61 nm. In addition, the specific surface area of Fe3O4 is largest with 96.91 m2 g−1, while the pore volume and average pore diameter are relatively small. After compounded BiOBr with BiOI, the specific surface area of the formed BiOBr/BiOI (3:1) increases significantly to 44.21 m2 g−1, and the average pore diameter decreases obviously to 21.90 nm. And when Fe3O4 and BiOBr/BiOI (3:1) are compounded to form ternary magnetic Fe3O4/BiOBr/BiOI (x:3:1) composite, and the specific surface area of Fe3O4/BiOBr/BiOI (x:3:1) increases with the increase of the mole ratios of Fe3O4, and the pore volume and pore diameter decrease accordingly.
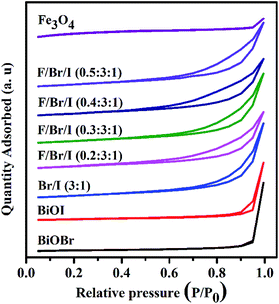 |
| | Fig. 4 N2 adsorption–desorption tests of BiOBr, BiOI, Fe3O4 and Fe3O4/BiOBr/BiOI (x:3:1) (x = 0.2, 0.3, 0.4 and 0.5) with different Fe3O4 (x) molar ratios (Br/I:BiOBr/BiOI (3:1); F/Br/I:Fe3O4/BiOBr/BiOI). | |
Table 2 Characteristics of the prepared samples by N2 adsorption–desorption tests
| Samples |
S (m2 g−1) |
P (cm3 g−1) |
A (nm) |
| BiOBr/BiOI. Fe3O4/BiOBr/BiOI; S: specific surface area; P: pore volume; A: average pore diameter. |
| BiOBr |
14.41 |
0.2152 |
52.76 |
| BiOI |
14.03 |
0.1810 |
51.61 |
| Br/Ia (3:1) |
44.21 |
0.2421 |
21.90 |
| F/Br/Ib (0.2:3:1) |
44.82 |
0.2251 |
17.29 |
| F/Br/I (0.3:3:1) |
46.67 |
0.2184 |
19.58 |
| F/Br/I (0.4:3:1) |
48.30 |
0.2193 |
16.18 |
| F/Br/I (0.5:3:1) |
52.59 |
0.1825 |
16.16 |
| Fe3O4 |
96.91 |
0.0888 |
18.32 |
UV-vis DRS analysis. The absorption wavelengths of the photocatalysts can be used to measure the absorptivity to light. The UV-vis diffuse reflectance spectra of BiOBr, BiOI and Fe3O4/BiOBr/BiOI (x:3:1) with different Fe3O4 (x) mole ratios are shown in Fig. 5. The absorption wavelengths of all samples are in Fig. 5. The absorption wavelengths of all samples are in the visible region. The band edge of BiOBr/BiOI (3:1) lies between the pure BiOBr (425 nm) and BiOI (670 nm). In comparison with BiOBr/BiOI (3:1) composite, the absorption wavelengths of the ternary magnetic Fe3O4/BiOBr/BiOI (x:3:1) exhibit slightly red shift, indicating that the introduction of Fe3O4 can enhance the absorptivity of the photocatalysts to visible light.
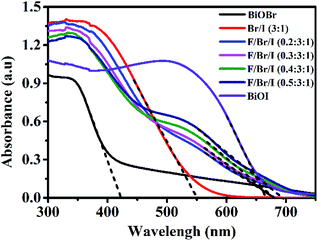 |
| | Fig. 5 UV-vis diffuse reflectance spectra of BiOBr, BiOI and Fe3O4/BiOBr/BiOI (x:3:1) (x = 0.2, 0.3, 0.4 and 0.5) with different Fe3O4 (x) molar ratios. (Br/I:BiOBr/BiOI (3:1); F/Br/I:Fe3O4/BiOBr/BiOI). | |
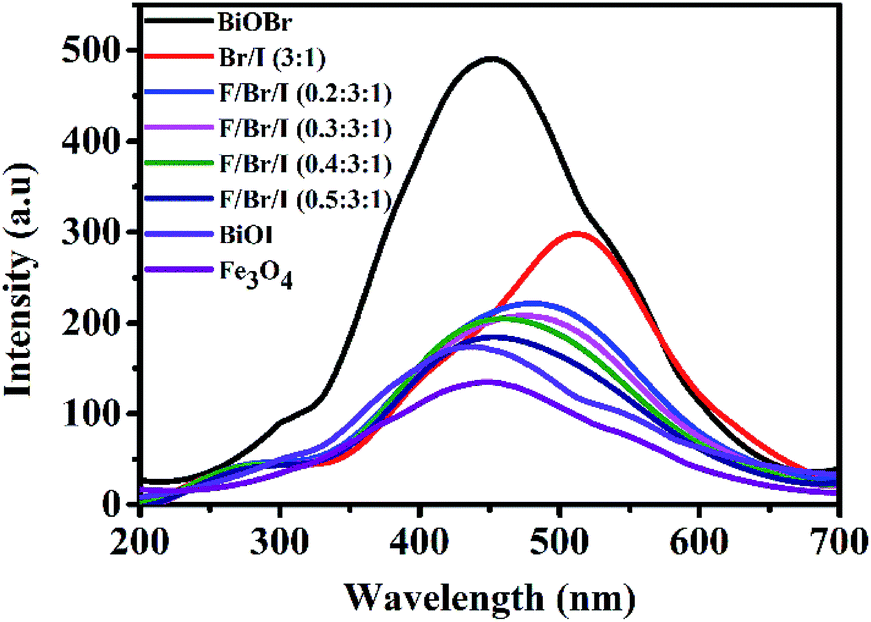
PL analysis. The PL analysis results are shown in Fig. 6. The intensity of the diffraction peak can be applied to estimate the recombination probability of photogenerated electron–hole pairs. The stronger the peak is, the greater the recombination probability is. Based on this principle, it can be seen from Fig. 6, the emission peak of the pure BiOBr is the strongest, indicating that the photogenerated electron–hole pairs, recombination rate is the largest, and that of BiOBr/BiOI (3:1) is second, between BiOBr and BiOI.30,31 While the emission peak of the pure Fe3O4 is the weakest, predicting the smallest recombination rate of photogenerated electron–hole pairs. The result illustrates that Fe3O4 owns strong electronic transmission capacity.32 As can be seen from Fig. 6, the peak strength of BiOI is second only to that of Fe3O4. Loaded Fe3O4 on BiOBr/BiOI (3:1) composite, the photogenerated electron–hole pairs, recombination rate of Fe3O4/BiOBr/BiOI (x:3:1) decreases significantly, which indirectly indicates that the utilization rate of photogenerated carriers is improved.
 |
| | Fig. 6 Photoluminescence (PL) spectra of BiOBr, BiOI, Fe3O4 and Fe3O4/BiOBr/BiOI (x:3:1) (x = 0.2, 0.3, 0.4 and 0.5) with different Fe3O4 (x) molar ratios. (Br/I:BiOBr/BiOI (3:1); F/Br/I:Fe3O4/BiOBr/BiOI). | |
Magnetic analysis. The magnetic properties of the magnetic samples (Fe3O4, and Fe3O4/BiOBr/BiOI (x:3:1) with different Fe3O4 (x) mole ratios) are shown in Fig. 7. All magnetic samples present good ferromagnetic behavior.33 It can be clearly realized that the magnetism of Fe3O4/BiOBr/BiOI (x:3:1) (x = 0.2, 0.3, 0.4 and 0.5) increases with the increase of Fe3O4 mole ratio (Fig. 7a (inset)). The saturation magnetization (MS) of pure Fe3O4 and Fe3O4/BiOBr/BiOI (x:3:1) composite (x = 0.2, 0.3, 0.4 and 0.5) are 58.28, 2.64, 3.89, 5.10 and 6.27 emu g−1, respectively. Seen from Fig. 7b, the color of the pure BiOBr and BiOI are greyish-white and red-brown, and BiOBr and BiOI compound with a mole ratio of 3:1 to form bright yellow catalyst. The color of Fe3O4 is black, when Fe3O4 combines with BiOBr/BiOI (3:1), the color of the ternary magnetic Fe3O4/BiOBr/BiOI (x:3:1) composites gradually shift from light brown to reddish brown. The Fig. 7b also shows the separation ability of magnetic samples under an external magnetic field. Powder samples dispersed in water present turbidity. After 25 s of applied magnetic field, the turbid suspensions become clear to varying degrees. The suspensions of the ternary magnetic Fe3O4/BiOBr/BiOI (0.2:3:1) and Fe3O4/BiOBr/BiOI (0.3:3:1) stay a little cloudy, and those of Fe3O4/BiOBr/BiOI (0.4:3:1), Fe3O4/BiOBr/BiOI (0.5:3:1) and Fe3O4 become very clear. This phenomenon illustrates that when the mole ratio of Fe3O4 is greater than 0.3, the synthesized ternary magnetic Fe3O4/BiOBr/BiOI (x:3:1) composites have good separation ability in the aqueous solution under an external magnetic field.
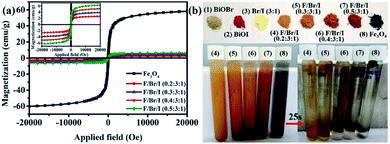 |
| | Fig. 7 (a) VSM curves of the magnetic samples; (b) pictures of the samples and magnetic separation performance of the magnetic samples (Br/I:BiOBr/BiOI (3:1); F/Br/I:Fe3O4/BiOBr/BiOI). | |
Photocatalytic performance
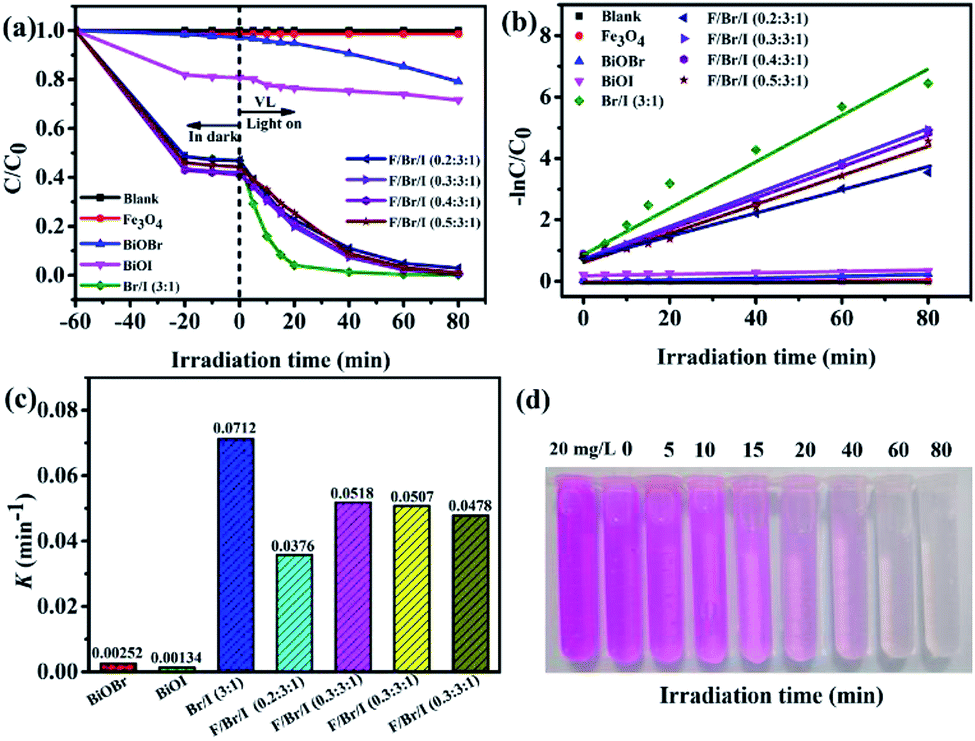
Photocatalytic degradability. Fig. 8a presents the photodegradation of RhB with illumination time over different photocatalysts under visible light. And the kinetic curves transform and first-order kinetic constants (K) of RhB degradation are shown in Fig. 8b and c. When the adsorption–desorption equilibrium reaches, the adsorption capacity of RhB by the samples can be calculated using qe (mg g−1).where C0 and C are the initial and equilibrium concentrations of RhB in the RhB solution (ppm), V is the solution volume (L), and m is the mass of the catalysts (g). The adsorption capacity of RhB by the as-prepared samples within 60 min is presented in the Table 3. The adsorption rates of BiOBr and BiOI to RhB are 1.5 and 18.1%, and the corresponding adsorption capacities of them are 1.86 and 12.79 mg g−1. Compared to the pure BiOBr and BiOI, the adsorption capacity of BiOBr/BiOI (3:1) increases greatly to 35.42 mg g−1. It is obvious that the adsorption capacities of Fe3O4/BiOBr/BiOI (x:3:1) (x = 0.2, 0.3, 0.4 and 0.5) is stronger than that of BiOBr/BiOI (3:1), and increases with the increase of Fe3O4 when the mole ratio of Fe3O4 is smaller than 0.5. The reason for this phenomenon may be that the load of Fe3O4 increases the specific surface area of the photocatalyst and forms Fe–OH on the surface of Fe3O4/BiOBr/BiOI (x:3:1) composite,20 but the adsorption capacity of Fe3O4 itself is very small, too much addition will cover the adsorption site of the photocatalyst. The maximum adsorption capacity of Fe3O4/BiOBr/BiOI (0.4:3:1) is 39.31 mg g−1.
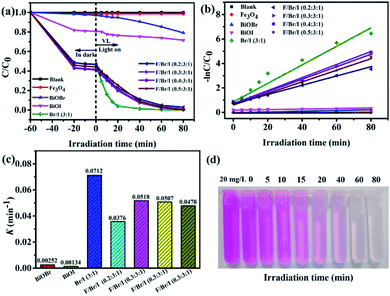 |
| | Fig. 8 (a) Photodegradation of RhB over different samples under visible light; (b) the kinetic curves transform of RhB degradation over different samples; (c) first-order kinetic constants (K) of RhB degradation over different samples; (d) the colour change of RhB solution with irradiation time (min) over Fe3O4/BiOBr/BiOI (0.4:3:1) (Br/I:BiOBr/BiOI (3:1); F/Br/I:Fe3O4/BiOBr/BiOI). | |
Table 3 The adsorption capacity of RhB under the prepared samples
| Samples |
qe (mg g−1) |
Samples |
qe (mg g−1) |
| BiOBr/BiOI. Fe3O4/BiOBr/BiOI. |
| Fe3O4 |
0.87 |
F/Br/Ib (0.2:3:1) |
35.45 |
| BiOBr |
1.86 |
F/Br/I (0.3:3:1) |
38.72 |
| BiOI |
12.79 |
F/Br/I (0.4:3:1) |
39.31 |
| Br/Ia (3:1) |
35.42 |
F/Br/I (0.5:3:1) |
37.14 |
Irradiation in visible light for 80 minutes, in the absence of any catalyst, RhB is difficult to decompose and exhibits excellent chemical stability, which indicates that the direct photolysis is neglectable. In addition, the photodegradation efficiency of RhB under the pure Fe3O4 can be also almost negligible. In the case of pure BiOBr and BiOI, RhB is obviously degraded. And the photodegradation rates of BiOBr and BiOI are 20.8% and 29.4%, respectively. While the corresponding K values are only 0.00252 and 0.00134 min−1. The low degradation rate of BiOI seems to be contrary to PL results, which may be due to the low photogenerated electron–holes produced by BiOI itself. This has a lot to do with the small specific surface area and the agglomerated morphology. It is worth mentioning that the photocatalytic activity of the BiOBr/BiOI (3:1) composite is dramatically enhanced when the BiOBr and BiOI combine with the mole ratio of 3:1, and the degradation rate and K of RhB reach to 99.8% and 0.0712 min−1, severally, which is attributed to its uniform flower-like hierarchical microsphere structure, larger specific surface area and smaller electron–holes recombination rate. After combined Fe3O4 with BiOBr/BiOI (3:1), the photocatalytic activities of Fe3O4/BiOBr/BiOI (x:3:1) (x = 0.2, 0.3, 0.4 and 0.5) decrease slightly, and the degradation rates of RhB are 97.1, 99.3, 99.2 and 98.9%, and K values are 0.0376, 0.0518, 0.0507 and 0.0478 min−1, severally. This result seems to be contrary to the wide absorption band edge and the low photogenerated carrier recombination rate of Fe3O4/BiOBr/BiOI (x:3:1) (x = 0.2, 0.3, 0.4 and 0.5). The reason for this result is that the pure Fe3O4 has no photocatalytic activity on RhB, and the presence of Fe3O4 covers part of the active sites. To sum up, the inhibitory effect of Fe3O4 on photocatalytic degradation is stronger than the promoting effect. Data analysis shows that the load of Fe3O4 improves the adsorption capacity of the photocatalyst, but slightly inhibits the photocatalytic activity.
The color change of RhB solution with irradiation time (min) over Fe3O4/BiOBr/BiOI (0.4:3:1) under visible light is shown in Fig. 8d. It is evident that the color of RhB solution becomes lighter with the increase of illumination time, until becomes colorless. The colorless RhB solution was detected to confirm the generation of NH4+–N, NO2−–N or NO3−–N by SP-752 visible spectrophotometer. The test result exhibits the existence of NH4+ and NO3−, and no NO2− was detected. It is noteworthy that the detected concentrations of NH4+–N and NO3−–N are 0.74 mg L−1 and 0.46 mg L−1, respectively. The total concentration of N atoms in NH4+ and NO3− is 1.20 mg L−1. The concentration value is basically the same as the concentration of N atoms (1.26 mg L−1) in RhB solution (20 mg L−1), inferring that nitrogen atoms of RhB in the solution is almost completely degraded.
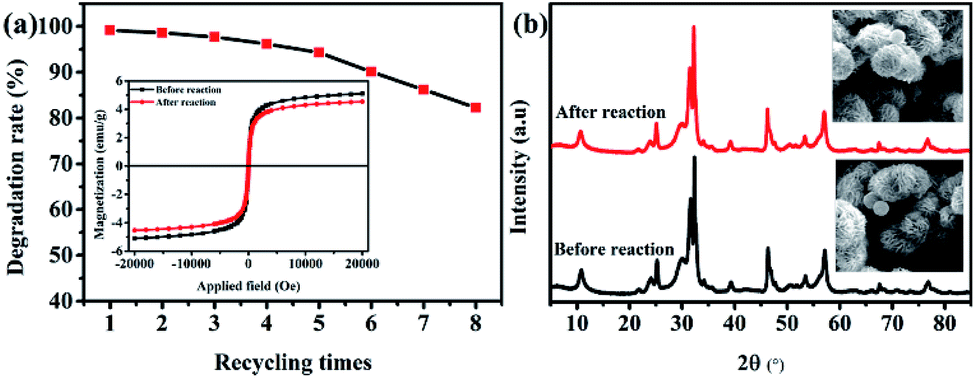
Reusability of the Fe3O4/BiOBr/BiOI (0.4![[thin space (1/6-em)]](https://www.rsc.org/images/entities/b_char_2009.gif) :3:1) composite. The reusability of the catalyst is also an important index to measure the performance of the catalyst. As shown in Fig. 9a, after eight recycles of photocatalytic degradation of RhB over the ternary magnetic Fe3O4/BiOBr/BiOI (0.4:3:1) composite, the degradation rate decreases slightly, from 99.2% to 82.3%. The magnetic change of the Fe3O4/BiOBr/BiOI (0.4:3:1) catalyst before and after recycling is presented in Fig. 9a (inset), the saturation magnetization decreases from 5.10 to 4.54 emu g−1, the decrease is only 11% before and after recycling. The changes of crystalline phase and morphology of the catalysts before and after reaction were observed by XRD and SEM. Seen from Fig. 9b, the Fe3O4/BiOBr/BiOI (0.4:3:1) catalyst maintains good crystallinity before and after reaction, and its morphology do not change significantly. The above analysis results illustrate that the ternary magnetic Fe3O4/BiOBr/BiOI (0.4:3:1) composite has good reusability and stability.
:3:1) composite. The reusability of the catalyst is also an important index to measure the performance of the catalyst. As shown in Fig. 9a, after eight recycles of photocatalytic degradation of RhB over the ternary magnetic Fe3O4/BiOBr/BiOI (0.4:3:1) composite, the degradation rate decreases slightly, from 99.2% to 82.3%. The magnetic change of the Fe3O4/BiOBr/BiOI (0.4:3:1) catalyst before and after recycling is presented in Fig. 9a (inset), the saturation magnetization decreases from 5.10 to 4.54 emu g−1, the decrease is only 11% before and after recycling. The changes of crystalline phase and morphology of the catalysts before and after reaction were observed by XRD and SEM. Seen from Fig. 9b, the Fe3O4/BiOBr/BiOI (0.4:3:1) catalyst maintains good crystallinity before and after reaction, and its morphology do not change significantly. The above analysis results illustrate that the ternary magnetic Fe3O4/BiOBr/BiOI (0.4:3:1) composite has good reusability and stability.
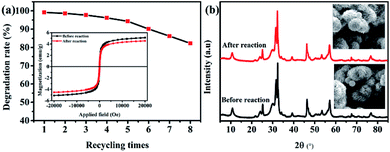 |
| | Fig. 9 (a) Recycling utilization experiments and magnetism of Fe3O4/BiOBr/BiOI (0.4:3:1) composite before and after recycling (inset); (b) XRD patterns and SEM images (inset) of Fe3O4/BiOBr/BiOI (0.4:3:1) composite before and after recycling. | |
Comparation with previous work. The quality of the catalyst can be reflected when compared with other catalysts. In our previous work, the binary magnetic Fe3O4/BiOBr (0.5:1) photocatalyst25 with better performance than other literatures34–36 has been developed. Compared with literature24 (Table 4), although the saturation magnetization of Fe3O4/BiOBr/BiOI (0.4:3:1) is smaller than that of Fe3O4/BiOBr (0.5:1), the specific surface area, adsorption capacity, degradation activity and K value are larger than those of binary magnetic Fe3O4/BiOBr (0.5:1) photocatalyst. Previous study24 has also synthesized ternary magnetic Fe3O4/BiOBr/BiOI (0.5:2:2) composite by precipitation method. As presented in Table 4, the saturation magnetization of Fe3O4/BiOBr/BiOI (0.4:3:1) is slightly smaller than that of Fe3O4/BiOBr/BiOI (0.5:2:2), but Fe3O4/BiOBr/BiOI (0.4:3:1) can also be well separated from water under magnetic field within 25 s. Besides, the specific surface area of Fe3O4/BiOBr/BiOI (0.5:2:2) (28.21 m2 g−1) is much less than that of Fe3O4/BiOBr/BiOI (0.4:3:1) (48.30 m2 g−1). The specific surface area of this paper is 3 times that of literature,24 which may indicate higher adsorption capacity and degradation activity of Fe3O4/BiOBr/BiOI (0.4:3:1).
Table 4 Compare this paper with Fe3O4/BiOBr (0.5:1) in our previous work25 and literature24a
| Magnetic photocatalyst |
M (emu g−1) |
S (m2 g−1) |
qe (mg g−1) |
D (%) |
K (min−1) |
| M: magnetization; S: specific surface area; D: degradation activity. |
| 25 |
17.3 |
34.11 |
14.53 |
78.4 |
0.035 |
| 24 |
7.2 |
28.21 |
— |
— |
— |
| This paper |
5.1 |
48.30 |
39.31 |
99.2 |
0.0507 |
Mechanism of photocatalytic activity
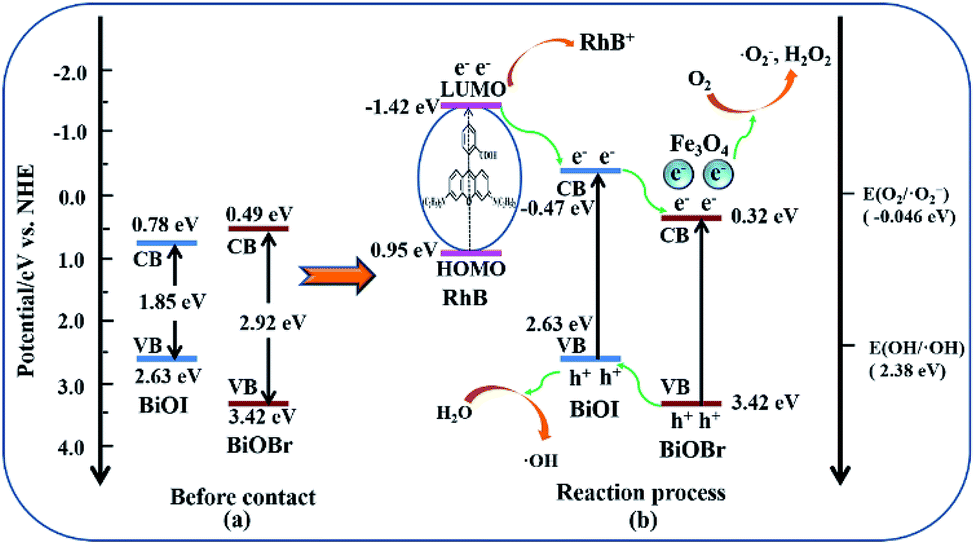
The band gap energy (Eg) of the semiconductor can be evaluated by the following calculation formula:where c, h, λ0 are the velocity of light, Planck constant and the maximum absorption wavelength, respectively. The Eg of BiOBr and BiOI are calculated to be 2.92 and 1.85 eV, which is consistent with the literature report.27,37 The valence band (VB) edge position and the conduction band (CB) edge position of BiOBr and BiOI can be calculated by Mulliken electronegativity theory via formulas (3) and (4):here Ec is the energy of free electrons on the hydrogen scale, about 4.5 eV. And X is the absolute electronegativity of the samples. The X values of BiOBr and BiOI are 6.21 and 6.45 eV. According to the formulas (3) and (4), the ECB and EVB of BiOI are 0.78 and 2.63 eV, respectively, and those of BiOBr are 0.49 and 3.42 eV. The band edge potentials of the VB and CB of BiOBr and BiOI are presented in Fig. 10a.
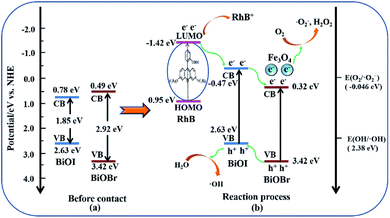 |
| | Fig. 10 The photodegradation mechanism for RhB over Fe3O4/BiOBr/BiOI (0.4:3:1) under visible-light irradiation (λ > 400 nm, central optical power with 250 mW cm−2). | |
Under light illumination, since the energy of photons is greater than the difference between LUMO and HOMO of dyes, the transition of electrons (e−) in dyes molecules occurs to form dyes+ which can continue to decompose into small molecules. However, the electrons and dyes+ are very easy to recombine to form dye molecules, which is the reason that the RhB is almost not degraded in the absence of photocatalyst. In the presence of photocatalysts, the situation will be greatly changed.
In RhB aqueous solution with Fe3O4/BiOBr/BiOI (0.4:3:1) photocatalyst under visible light illumination (λ > 400 nm, energy less than 3.10 eV), the energy of photons is larger than the Eg of BiOI (1.85 eV) and BiOBr (2.92 eV), the e− on the VB of BiOI (2.63 eV) and BiOBr (3.42 eV) transmits to the CB of BiOI (0.78 eV) and BiOBr (0.49 eV), so this will produce photoelectron–hole pairs (e−–h+) (reaction (5)). As shown in Fig. 10a, the CB edge potentials of BiOI (0.78 eV) and BiOBr (0.49 eV) seem to be detrimental to the transmission of electrons. In fact, it can be seen from the Fig. 10b, the electrons on the VB of BiOI (2.63 eV) and BiOBr (3.42 eV) can be stimulated to the more negative potentials (BiOI of −0.47 eV, and BiOBr of 0.32 eV). At this point, the CB of BiOBr (0.32 eV) is more positive potential than that of BiOI (−0.47 eV), which makes it possible for electrons to transfer from the CB of BiOI to the CB of BiOBr. Absorbed photons (energy less than 3.10 eV) with greater energy than the difference between LUMO (−1.42 eV) and HOMO (0.95 eV) of RhB, the electrons of RhB are excited to produce RhB+ (reaction (6)), and actively migrate to the CB position of BiOI due to the more negative potential of LUMO (−1.42 eV) than the CB potential of BiOI (−0.47 eV). And RhB + can decompose into small molecules or CO2, H2O, NO3− and NH4+ (reaction (7)). At the same time, the h+ on the VB of BiOBr automatically transfers to the VB of BiOI because of the more positive VB potential of BiOBr (3.42 eV) than that of BiOI (2.63 eV). Through the above principle analysis, the flow of electron–hole pairs establishes an external circuit to form a virtuous cycle, which promotes the continuation of photocatalytic process.
Next comes the production of active free radicals. The holes on the VB of BiOI will react with H2O molecules to emerge ·OH (reaction (8)), which is due to the more positive potential VB of BiOI than the redox potential of OH−/·OH (1.99 eV).38 While e− can be delivered by the Fe3O4 particles with strong electron transfer ability (reaction (9)). Because the CB potential of BiOI (−0.47 eV) is more negative than the potential of O2/·O2− (−0.046 eV),39 the electrons transferred by Fe3O4 particles combine with O2 molecules to form ·O2− (reaction (10)), and subsequently produce H2O2 (O2/H2O2, 0.682 eV) (reaction (11)), which can reaction with e− to emerge ·OH and OH− (reaction (12)).40 ·OH, ·O2− and H2O2 are oxidants, which can oxidize RhB molecules and RhB+ into small molecules, until RhB molecules and RhB+ are oxidized into CO2, H2O, NH4+ and NO3− (reaction (13)). The possible photocatalytic reactions of the ternary magnetic Fe3O4/BiOBr/BiOI (0.4:3:1) photocatalyst are as follows:
| | |
BiOBr/BiOI + hν → BiOBr/BiOI (h+ + e−)
| (5) |
| | |
RhB+ → intermediates + CO2 + H2O + NO3− +NH4+
| (7) |
| | |
H2O + BiOBr/BiOI (h+) → BiOBr/BiOI + H+ + ·OH
| (8) |
| | |
BiOBr/BiOI (e−) + Fe3O4 → BiOBr/BiOI + Fe3O4 (e−)
| (9) |
| | |
Fe3O4 (e−) + O2 → Fe3O4 + ·O2−
| (10) |
| | |
2·O2− + 2H+ → O2 + H2O2
| (11) |
| | |
H2O2 + Fe3O4 (e−) → ·OH + OH− + Fe3O4
| (12) |
| | |
RhB and RhB+ + ·OH, ·O2− and H2O2 → CO2 + H2O + NO3− + NH4+
| (13) |
Conclusions
The ternary magnetic Fe3O4/BiOBr/BiOI (x:3:1) composites were synthesized by a facile solvothermal method. The cha`racterization results reveal that all the Fe3O4/BiOBr/BiOI (x:3:1) samples possess good visible light response and large specific surface area. The RhB (20 mg L−1) solution can be degraded to colorless within 80 min over Fe3O4/BiOBr/BiOI (0.4:3:1) photocatalyst. Fe3O4/BiOBr/BiOI (0.4:3:1) can be rapidly separated from water within 25 s under external magnetic field. After 8 times recycles, the degradation rate decreases slightly, from 99.2% to 82.3%, the saturation magnetization decreases only 11%, and the crystallinity and morphology have not changed. Compared with binary magnetic Fe3O4/BiOBr (0.5:1) prepared by the same method in our previous work and the previous Fe3O4/BiOBr/BiOI (0.5:2:2) synthesized by co-precipitation method, the photocatalytic activity and adsorption capacity of Fe3O4/BiOBr/BiOI (0.4:3:1) are superior to them. All the results show the high photocatalytic degradation efficiency, good magnetic separation performance and excellent recyclability and stability of ternary magnetic Fe3O4/BiOBr/BiOI (0.4:3:1) photocatalyst. Photocatalytic mechanism analysis presents that RhB is degraded by oxidation of ·OH, ·O2− and H2O2.
Conflicts of interest
There are no conflicts to declare.
Acknowledgements
This work has been supported by the National Natural Science Foundation of China (21776196, 51778397 and 21707098), the National Key Research and Development Project (2016YFB0600502) and Innovative Projects for Post-graduate Education of Shanxi Province (No. 2018BY046).
References
- H. Sun, S. Liu, G. Zhou, H. Ming Ang, M. O Tadé and S. Wan, ACS Appl. Mater. Interfaces, 2012, 4, 5466–5471 CrossRef CAS PubMed.
- L. Schaider, K. Rodgers and R. A. Rudel, Environ. Sci. Technol., 2017, 51, 7304–7317 CrossRef CAS PubMed.
- P. Falås, A. Wick, S. Castronovo, J. Habermacher, T. Ternes and A. Joss, Water Res., 2016, 95, 240–249 CrossRef PubMed.
- S. Sun and W. Wang, RSC Adv., 2014, 4, 47136–47152 RSC.
- M. Cao, P. Wang, Y. Ao, C. Wang, J. Hou and J. Qian, Chem. Eng. J., 2015, 264, 113–124 CrossRef CAS.
- L. Reddy, J. Arias, J. Nicolas and P. Couvreur, Chem. Rev., 2012, 112, 5818–5878 CrossRef CAS PubMed.
- D. Sudha and P. Sivakumar, Chem. Eng. Process., 2015, 97, 112–133 CrossRef CAS.
- T. Xiong, M. Wen, F. Dong, J. Yu, L. Han, B. Lei, Y. Zhang, X. Tang and Z. Zang, Appl. Catal., B, 2016, 199, 87–95 CrossRef CAS.
- J. Joo, M. Dahl, N. Li, F. Zaera and Y. Yin, Energy Environ. Sci., 2013, 6, 2082–2092 RSC.
- S. Hoang, S. Guo, N. T. Hahn, A. J. Bard and C. Buddie Mullins, Nano Lett., 2012, 12, 26–32 CrossRef CAS PubMed.
- G. Liao, Y. Gong, L. Zhang, H. Gao, G. Yang and B. Fang, Energy Environ. Sci., 2019, 12, 2080–2147 RSC.
- A. Ajmal, I. Majeed, R. Malik, H. Idriss and M. Nadeem, RSC Adv., 2014, 4, 37003–37026 RSC.
- Y. Hu, W. Chen, J. Fu, M. Ba, F. Sun, P. Zhang and J. Zou, Appl. Surf. Sci., 2018, 436, 319–326 CrossRef CAS.
- Y. Wang, Y. Long, Z. Yang and D. Zhang, J. Hazard. Mater., 2018, 351, 11–19 CrossRef CAS PubMed.
- P. Zhang, B. Y. Guan, L. Yu and X. W. Lou, Chem, 2018, 4, 162–173 CAS.
- J. Li, M. Han, Y. Guo, F. Wang, L. Meng, D. Mao, S. Ding and C. Sun, Appl. Catal., A, 2016, 524, 105–114 CrossRef CAS.
- W. Deng, S. Ci, H. Li and Z. Wen, Chem. Eng. J., 2017, 330, 995–1001 CrossRef CAS.
- T. Wang, L. Zhang, H. Wang, W. Yang, Y. Fu, W. Zhou, W. Yu, K. Xiang, Z. Su, S. Dai and L. Chai, ACS Appl. Mater. Interfaces, 2013, 5, 12449–12459 CrossRef CAS PubMed.
- J. Liang, F. Liu, M. Li, W. Liu and M. Tong, Water Res., 2018, 137, 120–129 CrossRef CAS PubMed.
- D. Wang, J. Li, Z. Xu, Y. Zhu and G. Chen, J. Colloid Interface Sci., 2019, 533, 344–357 CrossRef CAS PubMed.
- M. Shekofteh-Gohari and A. Habibi-Yangjeh, Ceram. Int., 2015, 41, 1467–1476 CrossRef CAS.
- M. Mousavi, A. Habibi-Yangjeh and D. Seifzadeh, J. Mater. Sci. Technol., 2018, 34, 1638–1651 CrossRef.
- N. Güy, K. Atacan, E. Karaca and M. Özacar, Sol. Energy, 2018, 166, 308–316 CrossRef.
- S. Gao, C. Guo, S. Hou, L. Wan, Q. Wang, J. Lv, Y. Zhang, J. Gao, W. Meng and J. Xu, J. Hazard. Mater., 2017, 331, 1–12 CrossRef CAS PubMed.
- J. Li, F. Yang, Q. Zhou, R. Ren, L. Wu and Y. Lv, J. Colloid Interface Sci., 2019, 546, 139–151 CrossRef CAS PubMed.
- J. Fu, B. Chang, Y. Tian, F. Xi and X. Dong, J. Mater. Chem. A, 2013, 1, 3083–3090 RSC.
- W. An, W. Cui, Y. Liang, J. Hu and L. Liu, Appl. Surf. Sci., 2015, 351, 1131–1139 CrossRef CAS.
- Y. Huo, J. Zhang, M. Miao and Y. Jin, Appl. Catal., B, 2012, 111–112, 334–341 CrossRef CAS.
- X. Wu, R. Wang, Y. Du, X. Li, H. Meng and X. Xie, New J. Chem., 2019, 43, 2640–2648 RSC.
- L. Lin, M. Huang, L. Long, Z. Sun, W. Zheng and D. Chen, Ceram. Int., 2014, 40, 11493–11501 CrossRef CAS.
- Z. Liu, H. Ran, B. Wu, P. Feng and Y. Zhu, Colloids Surf., A, 2014, 452, 109–114 CrossRef CAS.
- S. Gao, C. Guo, J. Lv, Q. Wang, Y. Zhang, S. Hou, J. Gao and J. Xu, Chem. Eng. J., 2017, 307, 1055–1065 CrossRef CAS.
- M. Shekofteh-Gohari and A. Habibi-Yangjeh, J. Colloid Interface Sci., 2016, 461, 144–153 CrossRef CAS PubMed.
- C. Guo, Y. He, P. Du, X. Zhao, J. Lv, W. Meng, Y. Zhang and J. Xu, Appl. Surf. Sci., 2014, 320, 383–390 CrossRef CAS.
- G. Cao, G. Wang, Y. Bai and M. Liu, Micro Nano Lett., 2015, 10, 115–118 CrossRef CAS.
- C. Guo, S. Gao, J. Lv, S. Hou, Y. Zhang and J. Xua, Appl. Catal., B, 2017, 205, 68–77 CrossRef CAS.
- H. Huang, K. Xiao, Y. He, T. Zhang, F. Dong, X. Du and Y. Zhang, Appl. Catal., B, 2016, 199, 75–86 CrossRef CAS.
- L. Yosefi, M. Haghighi and S. Allahyari, Sep. Purif. Technol., 2017, 178, 18–28 CrossRef CAS.
- J. Hou, K. Jiang, M. Shen, R. Wei, X. Wu, F. Idrees and C. Cao, Sci. Rep., 2017, 7, 11665 CrossRef PubMed.
- N. Lu, Y. Wang, S. Ning, W. Zhao, M. Qian, Y. Ma, J. Wang, L. Fan, J. Guan and X. Yuan, Sci.
Rep., 2017, 7, 17298 CrossRef PubMed.
Footnote |
| † Electronic supplementary information (ESI) available. See DOI: 10.1039/c9ra04412d |
|
| This journal is © The Royal Society of Chemistry 2019 |
Click here to see how this site uses Cookies. View our privacy policy here. 
 Open Access Article
 This Open Access Article is licensed under a Creative Commons Attribution-Non Commercial 3.0 Unported Licence
 *
*