 Open Access Article
5-Carboxylcytosine is resistant towards phosphodiesterase I digestion: implications for epigenetic modification quantification by mass spectrometry†
Fang Yuan ab,
Ying Bi
 a,
Jia-Yuan Zhang
 ac,
Ying-Lin Zhou
 b,
Xin-Xiang Zhang*b and
Chun-Xiao Song
 *a
*a
aLudwig Institute for Cancer Research, Target Discovery Institute, Nuffield Department of Medicine, University of Oxford, OX3 7FZ, UK. E-mail: chunxiao.song@ludwig.ox.ac.uk
bBeijing National Laboratory for Molecular Sciences (BNLMS), MOE Key Laboratory of Bioorganic Chemistry and Molecular Engineering, College of Chemistry, Peking University, Beijing 100871, China. E-mail: zxx@pku.edu.cn
cState Key Laboratory of Natural and Biomimetic Drugs, School of Pharmaceutical Sciences, Peking University, Beijing 100191, China
First published on 16th September 2019
Abstract
DNA cytosine modifications are important epigenetic modifications in gene regulation and pathogenesis. DNA hydrolysis followed by HPLC-MS/MS is the gold standard in DNA modification quantification. In particular, it is the only sensitive and accurate method for low abundance modifications, such as 5-carboxylcytosine (5caC). Here, we report the discovery of the nuclease resistance property of 5caC to snake venom phosphodiesterase I (PDE1), a 3′ to 5′ exonuclease commonly used in several DNA hydrolysis protocols. We conducted a systematic evaluation of six commonly used hydrolysis protocols and found that all protocols that use PDE1 underestimate the level of 5caC. Finally, we identified the best method for cytosine modification quantification of biological samples, which leads to an over 10-fold higher amount of 5caC being detected compared with other methods. Our results highlight that caution should be taken when choosing a DNA hydrolysis protocol to quantify certain DNA modifications.
Chemical modifications of cytosine bases in DNA have been recognized as crucial epigenetic mechanisms for gene regulation and cellular development.1,2 5-Methylcytosine (5mC) and 5-hydroxymethylcytosine (5hmC) are the two most abundant and best studied DNA cytosine modifications,3 while 5-formylcytosine (5fC) and 5-carboxylcytosine (5caC) are low abundance demethylation intermediates.4 5HmC, 5fC and 5caC are oxidized sequentially from 5mC by the ten-eleven translocation (TET) family of dioxygenases,4,5 and 5fC and 5caC can be removed by thymine DNA glycosylase (TDG) and converted back to unmodified cytosine through base-excision repair.6,7 5FC and 5caC have also shown potential biological functions;8,9 for instance, 5caC stalls the RNA polymerase II elongation complex.10
The global levels of these DNA modifications are often the first important data required to study their functions, before more expensive experiments, such as sequencing are undertaken.11,12 In this regard, high-performance liquid chromatography coupled with tandem mass spectrometry (HPLC-MS/MS) is an important and widely used technology in epigenetics, and also the gold standard for accurately detecting and quantifying the overall level of DNA modifications.13,14 In fact, it is the only method sensitive enough to quantify 5caC, the scarcest cytosine modification in the mammalian genome with only several parts per million compared to unmodified cytosine.4,12 In order to perform HPLC-MS/MS analysis, DNA samples first need to be hydrolysed to single nucleosides. The traditional DNA hydrolysis approach is the nuclease P1 protocol developed by Crain et al.15 The abundance of several important DNA/RNA modifications was determined by HPLC-MS/MS using this protocol.16–18 However, this two-step trio-enzymatic digestion method is complex and time-consuming. For example, DNA must be denatured first and the pH of the aqueous solution needs to be adjusted twice. Eoin and Jesse later developed a simple protocol for hydrolysing DNA, which only needs one step of incubation. In this protocol, Benzonase, a commercially available endo-nuclease was used instead of P1 nuclease.19 All of the three enzymes used in this protocol can work together under the same pH condition and DNA does not have to be denatured first. This new one-step Benzonase protocol saves much time compared with the nuclease P1 protocol, and has become a popular choice since its publication.3,20,21 Another one-step protocol used DNase I instead of P1 nuclease or Benzonase.4 More recently, commercial enzymatic mixtures have also become available for one-step DNA digestion, albeit at a higher cost.
Our group has been using the simple and low cost Benzonase protocol in the HPLC-MS/MS quantification of DNA cytosine modifications. However, when we recently employed this protocol on a 5caC-containing synthesized oligonucleotide (ODN), we found that the 5caC level was two to three orders of magnitude lower than expected. On the other hand, the quantification result of 5caC 2′-deoxynucleoside standard solution treated with Benzonase protocol was consistent with the actual concentration. This phenomenon indicates that the Benzonase protocol has an unusual effect on hydrolysing 5caC-containing DNA.
This unexpected finding prompted us to conduct a systematic investigation of the Benzonase protocol together with five other commonly used DNA hydrolysis protocols, including two commercial products, for HPLC-MS/MS analysis of DNA cytosine modifications in the present study. MALDI-TOF analysis was also used in order to conduct a mechanistic study on the hydrolysis efficiency of target enzyme. Finally, in order to help researchers choose a suitable hydrolysis method for MS quantification of cytosine modifications, we investigated the performance of all existing protocols on hydrolysing genomic DNA from cell lines that contain variable levels of the four cytosine modifications.
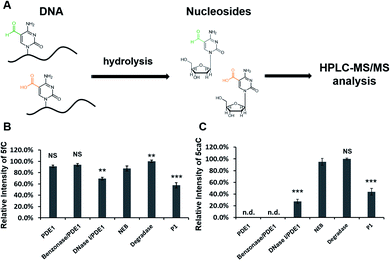
First, to verify the loss of 5caC signal during the HPLC-MS/MS analysis, we employed six commonly used hydrolysis protocols, including the Benzonase protocol, to hydrolyse two short ODNs containing either 5fC or 5caC (Table 1 and Fig. 1A). The hydrolysed products were analysed by HPLC-MS/MS. The result showed that, while DNase I/PDE1 and P1-treated samples showed lower 5fC levels (69.4% and 57.8% compared with DNA Degradase Plus treated sample), the 5fC-containing ODN treated by other hydrolysis protocols shared similar 5fC levels, indicating that different digestion protocols in general have little effect on the hydrolysis of 5fC-containing ODN (Fig. 1B). However, the 5caC levels differed dramatically in 5caC-containing ODN samples treated with different protocols (Fig. 1C). The DNA Degradase Plus protocol and NEB Digestion Mix gave the highest 5caC level, while no 5caC signal was detected in the samples treated with the PDE1 or Benzonase/PDE1 protocol. The 5caC level was also lower in the DNase I/PDE1 and P1-treated samples, but unlike 5fC results, DNase I/PDE1-treated sample gave much lower 5caC level (27.6%) compared with P1 (43.9%). This result showed that several hydrolysis protocols caused apparent 5caC loss in the HPLC-MS/MS analysis.
| Hydrolysis methods | Name | Enzyme | Time | Temp. (°C) |
|---|---|---|---|---|
| One-step | PDE1 | PDE1, ALP | 2 h | 37 |
| Benzonase/PDE1 | Benzonase, PDE1, ALP | 37 | ||
| DNase I/PDE1 | DNase I, PDE1, ALP | 37 | ||
| NEB | Nucleoside Digestion Mix (NEB) | 37 | ||
| Degradase | DNA Degradase Plus (Zymo) | 37 | ||
| Two-step | P1 | P1 nuclease, PDE1, ALP | Step 1: overnight | 37 |
| Step 2: 3 h |
An aqueous solution of 5caC 2′-deoxynucleoside with a known concentration was used as control sample. After treated with the same six enzymatic digestion protocols, the 5caC 2′-deoxynucleoside was analysed by HPLC-MS/MS. Except for DNase I/PDE1 group, the intensities of the 5caC peaks were similar among untreated and other methods treated nucleosides, showing that enzyme treatments do not affect the ability to detect 5caC single nucleosides (Fig. S1†). Based on these results, we propose that, the loss of 5caC signal in HPLC-MS/MS analysis using these hydrolysis protocols is due to the incomplete digestion of 5caC-containing ODN fragments, and therefore could severely influence the quantification of 5caC in DNA samples.
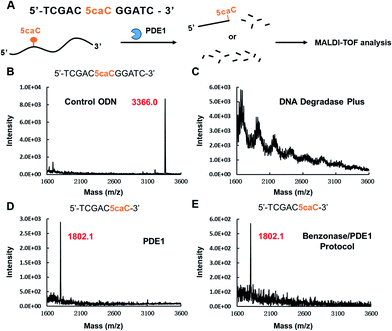
One common enzyme used in the protocols that resulted in 5caC signal loss is the 3′ to 5′ exonuclease PDE1 (Table 1). The 3′ to 5′ exonuclease activity of PDE1 was first found in 1959,22 and has been widely used to hydrolyse DNA samples since then.4,19 Certain lesions of DNA, such as apurinic (AP) sites and thymine glycols (Tg) are reported to be refractory to PDE1 digestion.23,24 Moreover, a polyamine-modified nucleoside was shown to be more resistant to PDE1 than unmodified ODNs.25 However, no studies have reported the nuclease resistance property of natural occurring DNA cytosine modifications like 5caC. To the contrary, studies that reported undetected 5caC using HPLC-MS/MS often attributed this to the extremely low abundance of this modification.26,27 In order to investigate whether 5caC is refractory to exonucleases like PDE1, we used an 11-mer caC-containing ODN as a model, and analysed the hydrolysed products of this model using MALDI-TOF after treatment with different enzymatic digestion protocols (Fig. 2A). The original ODN had one peak at m/z = 3366.0 (Fig. 2B), while DNA Degradase Plus-treated ODN showed no peak (Fig. 2C), indicating the complete digestion of the ODN. A new peak with m/z = 1802.1 was observed in both PDE1-treated ODN and Benzonase/PDE1-treated ODN (Fig. 2D and E), corresponding to the short fragment of this ODN ending with 5caC (5′-TCGAC5caC-3′), which demonstrated that, mechanistically, 5caC could block the 3′ to 5′ exonuclease activity of PDE1 digestion right at the modification position.
The time-dependent PDE1 resistance of 5caC to digestion was also investigated using the 5caC-containing ODN model. As shown in Fig. S2,† protocols that use the NEB Nucleoside, Digestion Mix or DNA Degradase Plus (Zymo) can digest target 5caC ODN completely in 2 h. However, protocols using Benzonase/PDE1 or PDE1 digested less than 20% of the ODN substrate even after 24 h of incubation, confirming the resistance of 5caC to PDE1 digestion.
Global quantification of one nucleoside modification can indicate its potential role in the biological system and is crucial data to guide subsequent sequencing and biological experiments. It is extremely important to choose a suitable hydrolysis method that can fully digest the DNA sample in an unbiased manner. The first paper to discover 5caC in the mammalian genome in 2011 used the DNase I/PDE1 protocol.4
Unlike P1 nuclease, which exhibits both exonuclease and endonuclease activity that can directly hydrolyse DNA to single nucleosides,28 Benzonase29 and DNase I28 are both endonucleases that cleave DNA to release oligonucleotides. In order to fully digest DNA into single nucleosides, exonuclease PDE1 is added in these two hydrolysis protocols. Unfortunately, for 5caC substrates, our results already showed that such combined DNA hydrolysis protocols could lead to modest to severe underestimation of 5caC levels in synthesized ODN samples. Genomic DNA (gDNA) contains much more complicated base compositions and chemical modifications. To further demonstrate the 5caC digestion issue in a more biologically related setting, we next tested gDNA from mTet1 catalytic domain overexpressed 293T cells. Since Tet proteins can oxidize 5mC to 5hmC, 5fC and 5caC, these three cytosine modifications are expected to exist in relatively high levels in this cell line.
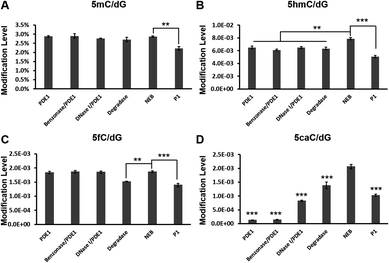
The HPLC-MS/MS quantification results of each cytosine modification are shown in Fig. 3. The levels of all modifications investigated in this experiment were lower using the P1 Nuclease hydrolysis protocol than a one-step protocol like the NEB Digestion Mix, indicating that, although with the longest incubation time, this two-step hydrolysis protocol cannot fully digest gDNA. As for different one-step hydrolysis methods treated samples, the levels of 5mC were similar among all samples, while the level of 5hmC was about 20% higher in the Digestion Mix-treated sample than others. The levels of 5fC were similar among PDE1, Benzonase/PDE1, DNase I/PDE1 and NEB Digestion Mix-treated samples, while 20% lower in the Degradase-treated sample. The levels of 5caC in this gDNA sample were strikingly different between the different hydrolysis methods. Unlike the ODN results, the NEB Digestion Mix-treated gDNA gave the highest 5caC level (5caC/dG value was 2.06 × 10⁻³), while the 5caC/dG value was 1.38 × 10⁻³ in the Degradase-treated sample, 33% lower than the Digestion Mix-treated group. PDE1 and PDE1/Benzonase methods gave the lowest 5caC/dG values (1.28 × 10⁻⁴ and 1.40 × 10⁻⁴ respectively), indicating that only 6.2% and 6.8% of the 5caC modifications were digested into single nucleosides in these samples. The 5caC/dG level in the DNase I and P1 nuclease-treated samples (8.26 × 10⁻⁴, and 1.03 × 10⁻³) were 40.0% and 49.7% of those in Digestion Mix-treated group, respectively.
Another biologically relevant sample we tested was gDNA from Tdgflox/flox mouse embryonic stem cells (mESC) and Tdg−/− mESC.30 There are a few studies that reported the level of 5caC in wild-type mESC,4,6 while Tdg knock-out leads to increased levels of 5fC and 5caC in mESC.30,31 Since most of these works used a PDE1-containing hydrolysis enzyme mix or the two-step protocol, we wanted to investigate the influence of different hydrolysis methods on the level of 5caC detected.
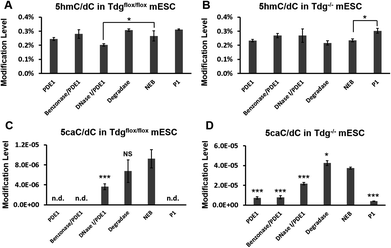
The same amount of gDNA was used in each hydrolysis experiment. As shown in Fig. 4A and B, the levels of 5hmC were similar among PDE1, Benzonase/PDE1, Degradase, NEB Digestion Mix and P1-treated Tdgflox/flox gDNA samples, and all one-step hydrolysis methods-treated Tdg−/− gDNA samples. However, the 5caC/dC levels in Tdg−/− mESC treated with Degradase or NEB Digestion Mix were 6 to 10 times higher than those treated with PDE1, Benzonase/PDE1 or P1 nuclease methods (Fig. 4D). Moreover, unlike the successful quantification of 5caC in Tdg−/− mESC using Degradase or NEB Digestion Mix, we could not detect any 5caC signal in Tdgflox/flox gDNA samples treated with the PDE1, Benzonase/PDE1 or P1 nuclease methods (Fig. 4C).
According to these results, we conclude that both the NEB Digestion Mix and DNA Degradase Plus are suitable hydrolysis methods to obtain accurate 5caC levels in gDNA from biological samples, although the former gives more stable results in most of the cases. DNase I and P1 nuclease protocols gave acceptable results in high 5caC-containing gDNA samples, while the 5caC level was severely underestimated in the PDE1 and Benzonase/PDE1 protocol treated gDNA sample. Although PDE1 should be avoid in the HPLC-MS/MS quantification of 5caC, it might be useful to analyse the distribution of 5caC in the genome. Since the hydrolysis of DNA using PDE1 will be blocked and leave 5caC at the 3′ end, it could be developed into a sequencing method to determine the localization of the 5caC.
In summary, we first reported the signal loss of 5caC during the HPLC-MS/MS quantification analysis using certain common DNA hydrolysis methods. We identified the cause to be that 5caC is resistant to PDE1, an exonuclease used in DNA hydrolysis protocols like, Benzonase/PDE 1 and DNase I/PDE 1. Genomic DNA extracted from mTet1 catalytic domain overexpressed 293T cells and Tdg knockout mESC were used to evaluate the performance of six commonly used DNA hydrolysis protocols. Among all the protocols tested, Nucleoside Digestion Mix gave the highest 5caC level. Our results have strong implications to the epigenetic research that cautions should be made when choosing a DNA hydrolysis protocol to quantify certain DNA modifications not to introduce bias. Such bias could be particularly strong in low abundance modifications, including 5caC, but also potentially other modifications, for instance, the more recently reported N6-methyladenine (N6-mA) in DNA.32–34
Conflicts of interest
There are no conflicts to declare.Acknowledgements
We would like to acknowledge P. Spingardi, G. Berridge and B. Kessler for helping with the HPLC-MS/MS; G.-L. Xu for providing the Tdgflox/flox mESC and Tdg−/− mESC; F. Howe for editing the manuscript. This work was supported by the Ludwig Institute for Cancer Research. Work in the C.-X. Song lab is also supported by Cancer Research UK (C63763/A26394 and C63763/A27122), NIHR Oxford Biomedical Research Centre, and Conrad N. Hilton Foundation. The views expressed are those of the authors and not necessarily those of the NHS, the NIHR or the Department of Health. F. Yuan and Y. Bi are supported by China Scholarship Council. J.-Y. Zhang is supported by NDM Summer Internship Programme. Funding for open access charge: The University of Oxford's Charity Open Access Fund (COAF).Notes and references
- R. J. Klose and A. P. Bird, Trends Biochem. Sci., 2006, 31, 89–97 CrossRef CAS PubMed.
- E. Li and Y. Zhang, Cold Spring Harbor Perspect. Biol., 2014, 6, a019133 CrossRef PubMed.
- S. Kriaucionis and N. Heintz, Science, 2009, 324, 929–930 CrossRef CAS PubMed.
- S. Ito, L. Shen, Q. Dai, S. C. Wu, L. B. Collins, J. A. Swenberg, C. He and Y. Zhang, Science, 2011, 333, 1300–1303 CrossRef CAS PubMed.
- M. Tahiliani, K. P. Koh, Y. Shen, W. A. Pastor, H. Bandukwala, Y. Brudno, S. Agarwal, L. M. Iyer, D. R. Liu, L. Aravind and A. Rao, Science, 2009, 324, 930–935 CrossRef CAS PubMed.
- Y.-F. He, B.-Z. Li, Z. Li, P. Liu, Y. Wang, Q. Tang, J. Ding, Y. Jia, Z. Chen, L. Li, Y. Sun, X. Li, Q. Dai, C.-X. Song, K. Zhang, C. He and G.-L. Xu, Science, 2011, 333, 1303–1307 CrossRef CAS PubMed.
- A. Maiti and A. C. Drohat, J. Biol. Chem., 2011, 286, 35334–35338 CrossRef CAS PubMed.
- M. W. Kellinger, C.-X. Song, J. Chong, X.-Y. Lu, C. He and D. Wang, Nat. Struct. Mol. Biol., 2012, 19, 831 CrossRef CAS PubMed.
- E.-A. Raiber, G. Portella, S. Martínez Cuesta, R. Hardisty, P. Murat, Z. Li, M. Iurlaro, W. Dean, J. Spindel, D. Beraldi, Z. Liu, M. A. Dawson, W. Reik and S. Balasubramanian, Nat. Chem., 2018, 10(12), 1258–1266 CrossRef CAS PubMed.
- L. Wang, Y. Zhou, L. Xu, R. Xiao, X. Lu, L. Chen, J. Chong, H. Li, C. He, X.-D. Fu and D. Wang, Nature, 2015, 523, 621 CrossRef CAS PubMed.
- P. W. Laird, Nat. Rev. Genet., 2010, 11, 191–203 CrossRef CAS PubMed.
- C.-X. Song, C. Yi and C. He, Nat. Biotechnol., 2012, 30, 1107 CrossRef CAS PubMed.
- R. Singh and P. B. Farmer, Carcinogenesis, 2006, 27, 178–196 CrossRef CAS PubMed.
- M. Munzel, D. Globisch, T. Bruckl, M. Wagner, V. Welzmiller, S. Michalakis, M. Muller, M. Biel and T. Carell, Angew. Chem., Int. Ed. Engl., 2010, 49, 5375–5377 CrossRef PubMed.
- P. F. Crain, in Methods in Enzymology, Academic Press, 1990, vol. 193, pp. 782–790 Search PubMed.
- L. Song, S. R. James, L. Kazim and A. R. Karpf, Anal. Chem., 2005, 77, 504–510 CrossRef CAS PubMed.
- K. S. Lim, A. Jenner and B. Halliwell, Nat. Protoc., 2006, 1, 1995 CrossRef CAS PubMed.
- Z. Liu, S. Liu, Z. Xie, W. Blum, D. Perrotti, P. Paschka, R. Klisovic, J. Byrd, K. K. Chan and G. Marcucci, Nucleic Acids Res., 2007, 35, e31 CrossRef PubMed.
- E. P. Quinlivan and J. F. Gregory, Anal. Biochem., 2008, 373, 383–385 CrossRef CAS PubMed.
- E. P. Quinlivan and J. F. Gregory 3rd, Nucleic Acids Res., 2008, 36, e119 CrossRef PubMed.
- J. Yin, S. Chen, N. Zhang and H. Wang, ACS Appl. Mater. Interfaces, 2018, 10, 21883–21890 CrossRef CAS PubMed.
- W. E. Razzell and H. G. Khorana, J. Biol. Chem., 1959, 236, 2114–2117 Search PubMed.
- M. Weinfeld, K.-J. M. Soderlind and G. W. Buchko, Nucleic Acids Res., 1993, 21, 621–626 CrossRef CAS PubMed.
- K. J. Bowman, R. L. Pla, Y. Guichard, P. B. Farmer and G. D. D. Jones, Nucleic Acids Res., 2001, 29, e101 CrossRef CAS PubMed.
- T. Ito, Y. Ueno, Y. Komatsu and A. Matsuda, Nucleic Acids Res., 2003, 31, 2514–2523 CrossRef CAS PubMed.
- L. M. Wheldon, A. Abakir, Z. Ferjentsik, T. Dudnakova, S. Strohbuecker, D. Christie, N. Dai, S. Guan, J. M. Foster, I. R. Corrêa, M. Loose, J. E. Dixon, V. Sottile, A. D. Johnson and A. Ruzov, Cell Rep., 2014, 7, 1353–1361 CrossRef CAS PubMed.
- M. Eleftheriou, A. J. Pascual, L. M. Wheldon, C. Perry, A. Abakir, A. Arora, A. D. Johnson, D. T. Auer, I. O. Ellis, S. Madhusudan and A. Ruzov, Clin. Epigenet., 2015, 7, 88 CrossRef PubMed.
- N. A. Desai and V. Shankar, FEMS Microbiol. Rev., 2003, 26, 457–491 CrossRef CAS PubMed.
- M. Nestle and W. K. Roberts, J. Biol. Chem., 1969, 244, 5219–5225 CAS.
- C.-X. Song, K. E. Szulwach, Q. Dai, Y. Fu, S.-Q. Mao, L. Lin, C. Street, Y. Li, M. Poidevin, H. Wu, J. Gao, P. Liu, L. Li, G.-L. Xu, P. Jin and C. He, Cell, 2013, 153, 678–691 CrossRef CAS PubMed.
- L. Shen, H. Wu, D. Diep, S. Yamaguchi, A. C. D'Alessio, H. L. Fung, K. Zhang and Y. Zhang, Cell, 2013, 153, 692–706 CrossRef CAS PubMed.
- G. Zhang, H. Huang, D. Liu, Y. Cheng, X. Liu, W. Zhang, R. Yin, D. Zhang, P. Zhang, J. Liu, C. Li, B. Liu, Y. Luo, Y. Zhu, N. Zhang, S. He, C. He, H. Wang and D. Chen, Cell, 2015, 161, 893–906 CrossRef CAS PubMed.
- B. Yao, Y. Cheng, Z. Wang, Y. Li, L. Chen, L. Huang, W. Zhang, D. Chen, H. Wu, B. Tang and P. Jin, Nat. Commun., 2017, 8, 1122 CrossRef PubMed.
- Q. Xie, T. P. Wu, R. C. Gimple, Z. Li, B. C. Prager, Q. Wu, Y. Yu, P. Wang, Y. Wang, D. U. Gorkin, C. Zhang, A. V. Dowiak, K. Lin, C. Zeng, Y. Sui, L. J. Y. Kim, T. E. Miller, L. Jiang, C. H. Lee, Z. Huang, X. Fang, K. Zhai, S. C. Mack, M. Sander, S. Bao, A. E. Kerstetter-Fogle, A. E. Sloan, A. Z. Xiao and J. N. Rich, Cell, 2018, 175, 1228–1243 CrossRef CAS PubMed.
Footnote |
| † Electronic supplementary information (ESI) available. See DOI: 10.1039/c9ra04375f |
| This journal is © The Royal Society of Chemistry 2019 |


