 Open Access Article
Compound reinforcement of glaze wear resistance by prestress and second grain phase
Yougen Yua,
Huazhi Sub,
Kang Guana,
Cheng Penga and
Jianqing Wu *a
*a
aSchool of Materials Science and Engineering, South China University of Technology, Guangzhou 510640, Guangdong, China. E-mail: ceramicgroup@163.com
bFoshan Daqian Ceramic Pigment & Glaze Co. Ltd., Foshan 528000, Guangdong, China
First published on 12th August 2019
Abstract
To study the reinforcement effect of prestress and hard grains on glaze wear resistance, fused quartz was added to a ceramic body to introduce various prestresses by creating a thermal expansivity difference with glaze, and feldspar opaque glazes with and without zircon grains were coated on the ceramic bodies. The elastic moduli and Poisson ratios of the glazes were measured by the 2D-DIC system. Furthermore, the prestress of the glaze was calculated according to the double-layer thermal residual stress model and measured by DIC using the stress-release method. The weight losses of the samples caused by the modified method of ISO 10545-7 were determined; the results showed that the weight of the glaze was reduced by 23.8% by increasing the prestress to 81.2 MPa and by 35.9% by adding 7.2 wt% zircon grains. By introducing 7.2 wt% zircon grains and enhancing the prestress to 123.7 MPa, the abrasion weight loss was decreased by 62.7%.
1 Introduction
The roles of the glazes applied to ceramic products are to cover the ceramic body, create a satisfactory appearance and protect the product surface from both mechanical and chemical damage.1–5 To achieve economic benefits and provide satisfactory products to customers, wear resistance is considered the most vital characteristic of glazed tiles in ceramic companies. However, a relevant problem of ceramic tiles is that wear inevitably occurs on the glazes.6–11 To address this problem, multiple methods have been developed including the addition of hard particles with high-temperature stability to the glaze, crystallization of hard grains from the glaze, and enhancement of the alumina/silica ratio or reduction in the amount of fluxing agent;12–18 this is because most of the hard grains, such as zircon, spinel, mullite and gahnite, exhibit higher refraction indices than the glass phase that results in the opaque appearance of the glaze. Thus, hard grains are widely used to enhance the wear resistance of opaque glazes. Zircon19,20 is the most frequently used material among these hard grains due to its high hardness, wide applicability in glazes and simple manufacturing process. However, considering the high price of ZrO2 and ZrSiO4, it is of significance for the ceramic industry to reduce the consumption of Zr or even replace it with other more economical materials.In the glass industry, it is common to improve the wear resistance and the strength of glass by a toughening treatment that involves tempering;21,22 the toughening treatment imposes a pressure stress on the surface of the products. However, pressure stress generated by the low thermal expansion of a glaze than that of the ceramic body exists in majority of glazed products. Higher prestress might help to further improve the grain glaze wear resistance. However, to date, limited studies have been conducted on the effect of pressure stress on the glaze wear resistance. Furthermore, it is difficult to evaluate the value of the pressure stress of glazed tiles, which is related to the elastic modulus and Poisson's ratio of the glaze and ceramic body. Note that to date, only few studies have investigated the elastic properties of glaze. High-temperature fluidity and the gas release process of a glaze confine the preparation of glazes with sizes suitable for the traditional bending method and the vibration method for the testing of Young's modulus.23,24 Although the compression test can directly measure the monolithic Young's modulus of samples with a strain gauge, to satisfy the fitting of most of the strain gauges, the samples should have a regular columnar shape and should be longer than 100 mm. However, glazed samples with length more than 25 mm are difficult to prepare using a precision saw; moreover, the surfaces of some glazed samples may be matte or rough; this further makes it unlikely to obtain accurate results for strain gauges.
The abovementioned limitations have led to the introduction of a new technique called digital image correlation (DIC); DIC25,26 is a fast, accurate, non-contact and non-destructive optical technique that can measure accurate displacements and calculate the strains on the surface of a specimen subjected to a driving force with the help of a speckle pattern placed on the test surface of the specimens. A camera with high SNR (signal to noise ratio) is used to obtain the images of the surface of specimens both with and without various loading conditions. Subsequently, the deformation of the speckle pattern in the selected region is tracked by comparing the images via the DIC analysis software. Finally, the strain on the surface is calculated.
In this study, a consumer-grade high-SNR camera was used to obtain the images of the specimens with and without various compression loadings. In addition, the 2D-DIC software was used to analyze the lateral and the axial strain on the specimens. Thus, the Young's modulus and Poisson's ratio of the specimens could be easily and accurately measured. Furthermore, a calculation model to evaluate the glaze stress generated by the cooling shrinkage was introduced, and the prestress of the glaze was measured by DIC using a stress-release method. Finally, both individual and collective effects of the prestress and zircon grains on the wear resistance of the glazed tile were investigated.
2 Experimental procedure
2.1 Sample preparation
Commercial green tile powder (YLW, H80244X, CHN) with and without various amounts of fused quartz (D50 = 18 μm) was used to prepare ceramic bodies with different thermal expansivity values. The green powder and fused quartz were mixed with a certain amount of water in a planetary mill. After drying, the mixture was granulated by passing it through a 20-mesh sieve, and then, the granulated powder was compressed to square green bodies with the side length of 110 mm. Herein, four kinds of ceramic bodies were prepared and labeled as R0, R3, R10 and R15, which contained 0 wt%, 3 wt%, 10 wt% and 15 wt% of fused quartz, respectively.To investigate the effect of prestress and zircon grains on the wear resistance of glaze, two kinds of glazes that were adaptable to the firing schedule of a roller kiln were prepared: one was feldspar opaque glaze with zircon grains, marked as G1, and the other was feldspar opaque glaze, marked as G2. The raw materials consisted of alumina, zircon, kaolin, calcite, albite, talc, barium carbonate and zinc oxide, and the compositions of these two glazes are listed in Table 1. After being passed through a 200-mesh sieve, the raw materials were mixed with a certain amount of water, 0.3 wt% sodium carboxymethyl cellulose (CMC), and 0.3 wt% sodium tripolyphosphate (STP) followed by milling in the planetary mill for 30 min. Then, the slurry was sprayed onto the green bodies. The thickness of the glazes was controlled by the weight gain of the ceramic bodies. To study the influence of thermal expansivity on the glaze wear resistance, approximately 10 g of G1 and G2 slurries were sprayed on the 7 mm-thick samples R0, R3, R10 and R15, which were marked as R0-G1–R15-G1 and R0-G2–R15-G2, respectively. To investigate the effect of the thickness ratio (glaze/ceramic body) on the glaze wear resistance, approximately 8 g, 10 g and 12 g of G2 slurries were sprayed onto 6, 7 and 8 mm thick R0, and the obtained samples were marked as R068–R0812. The subscript represents the thickness of R0, and the superscript represents the mass of the G2 slurry.
| Numb. | SiO2 | Al2O3 | CaO | ZnO | MgO | Na2O | ZrO2 | BaO |
|---|---|---|---|---|---|---|---|---|
| G1 | 51.13 | 17.76 | 7.76 | 2.83 | 6.33 | 4.75 | 4.79 | 4.65 |
| G2 | 49.74 | 19.22 | 9.98 | 3.68 | 3.34 | 7.34 | 0.00 | 6.70 |
After drying, the samples were thermally treated in a roller kiln at 1200 °C at the heating rate of 40 °C min−1, where they were held for 5 min at maximum temperature and then subjected to the average cooling rate of 50 °C min−1. The glaze surfaces were analyzed after firing.
To investigate thermal expansivity, elastic modulus and Poisson's ratio, the glaze slurry was dried and granulated by passing it through a 20-mesh sieve and then compressed into glazed bodies. These glazed bodies were placed on a corundum gasket and fired at 1200 °C for a certain period of time (30 min for G1 and 60 min for G2) to eliminate air bubbles resulting from the thick glaze layer. After firing, these hemispherical specimens were cut into cuboids and annealed at 600 °C for 2 h. The ceramic bodies were also cut into cuboids for the test.
2.2 Characterization techniques
X-ray diffraction (XRD; PANalytical X'pert PRO, Almelo, the Netherlands) using Cu Kα radiation from 10° to 60° with the step of 0.03° and the time step of 0.1 s was used to verify the crystalline phase of the glazes. Scanning electron microscopy (SEM; ZEISS EVO 18, Oberkochen, Germany) was used to observe the micromorphology of the samples in the back-scattered electron (BSE) pattern and secondary electron (SE) pattern. Samples were etched by a 1 vol% hydrofluoric acid solution for 1 min before observation. The thermal expansion of the samples was measured by a thermodilatometer (DIL 402 Expedis Classic) with the size of 3 × 3 × more than 25 mm. The Archimedes principle was employed to measure the water absorption of the samples.The established 2D-DIC system, an image of a specimen with speckle pattern and the testing machine are shown in Fig. 1. The DIC system consisted of a CMOS industrial camera (SunTae, MX880M, CHN, 8.8 megapixel, 2.5 μm pixel), one light source, one tripod stand and a PC workstation. A black spray was used to prepare a random speckled surface. The camera obtained the surface images of the specimens under various compressive loadings at the rate of 20.9 fps. The compressive loading was applied by a universal testing machine (Model 5567, Instron, USA). The open source software Ncorr V1.2 was used to process the obtained speckle pattern images. The subset radius of the region of interest (ROI) was set to 21–36 pixels, and the subset spacing was set to 1–3 pixels.
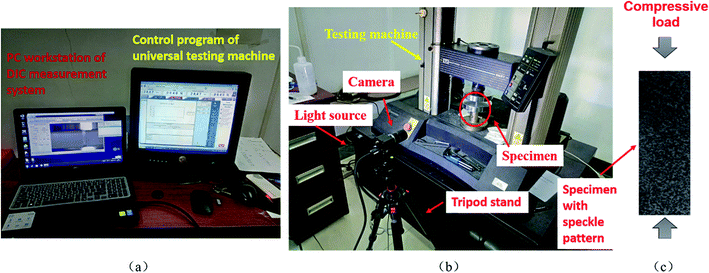 | ||
| Fig. 1 2D-DIC system testing machine and specimen with a speckle pattern ((a) control platform; (b) working platform; (c) specimen with speckle pattern). | ||
The wear resistance of the samples was characterized using a method modified based on the testing conditions of ISO 10545-7 (Ceramic tiles – part 7: Determination of resistance to surface abrasion for glazed tiles). After being weighed, the samples were cut to approximately 100 × 100 mm and fixed under metal holders for the test. A standardized abrasive slurry obtained from ISO 10545-7, which contained steel balls with various diameters, aluminum oxide and distilled water, was poured into the holders as the abrasive. The system was rotated with the eccentricity of 22.5 mm at 300 rpm, and the applied revolutions of the abrasive slurry were 8000 rounds. After drying, the weight loss of six specimens of one sample was determined by an analytical balance (Sartorius, GL623, Max 620 g, d = 1 mg).
For the measurement of prestress, the iron-zircon pigment at the water-material ratio of 1![[thin space (1/6-em)]](https://www.rsc.org/images/entities/char_2009.gif) :
:![[thin space (1/6-em)]](https://www.rsc.org/images/entities/char_2009.gif) 3 was used as a dye, and the random feature points were printed on the surfaces of the samples by cotton. After drying, the fixed industrial camera was used to obtain the image of the initial state of the sample surface in an immobile position. Then, the sample was annealed at 700 °C for 2 hours. After obtaining the surface image of the annealed state, the surface stress was released via the slitting method. Finally, after the slitting process, the surface image of the sample was obtained, and then, the surface strain was analyzed by the 2D-DIC system. Therefore, the corresponding stress value was determined in accordance with the elastic modulus of the glaze.
3 was used as a dye, and the random feature points were printed on the surfaces of the samples by cotton. After drying, the fixed industrial camera was used to obtain the image of the initial state of the sample surface in an immobile position. Then, the sample was annealed at 700 °C for 2 hours. After obtaining the surface image of the annealed state, the surface stress was released via the slitting method. Finally, after the slitting process, the surface image of the sample was obtained, and then, the surface strain was analyzed by the 2D-DIC system. Therefore, the corresponding stress value was determined in accordance with the elastic modulus of the glaze.
3 Results and discussion
3.1 XRD characterization of glazes
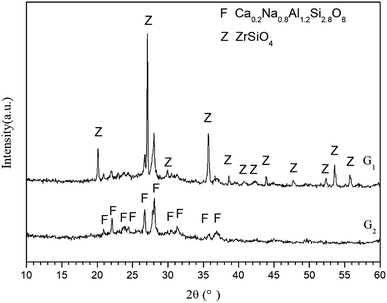
The XRD patterns of G1 and G2 are shown in Fig. 2. Only the feldspar phase Ca0.2Na0.8AlSi1.2O8 existed in G2, whereas zircon and feldspar coexisted in G1. As zircon grains are widely used to enhance the wear resistance of glazed tiles, in this study, glazes both with and without zircon have been used to investigate the role of zircon grains in enhancing the wear resistance of glazes.3.2 Elastic modulus measurement of the glaze
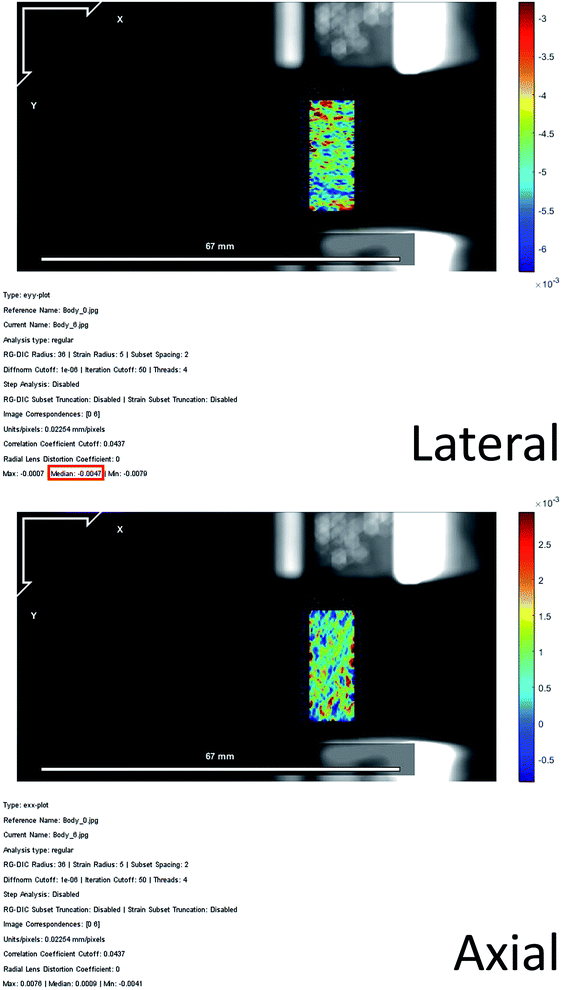
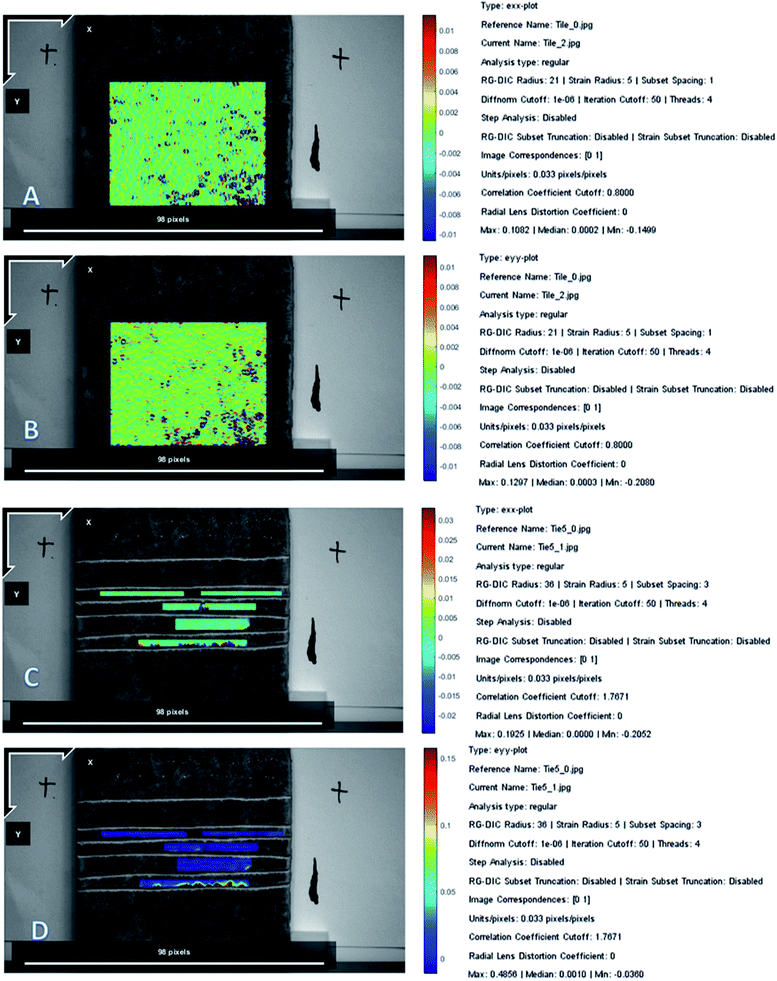
Fig. 3 shows the lateral and axial strain data plots of the R0 obtained in this study under the 15![[thin space (1/6-em)]](https://www.rsc.org/images/entities/char_2009.gif) 000 N compressive loading; these data plots consisted of a strain field contour in the specified direction, the key parameters set through the DIC analysis and the monolithic average strain under the specified load in the specified direction, as highlighted by the red frame. As shown in Fig. 3, in addition to the monolithic strains of the samples under compressive loads, the strain concentration regions of specimens under compressive loads could be clearly detected in the strain field contour.
000 N compressive loading; these data plots consisted of a strain field contour in the specified direction, the key parameters set through the DIC analysis and the monolithic average strain under the specified load in the specified direction, as highlighted by the red frame. As shown in Fig. 3, in addition to the monolithic strains of the samples under compressive loads, the strain concentration regions of specimens under compressive loads could be clearly detected in the strain field contour.
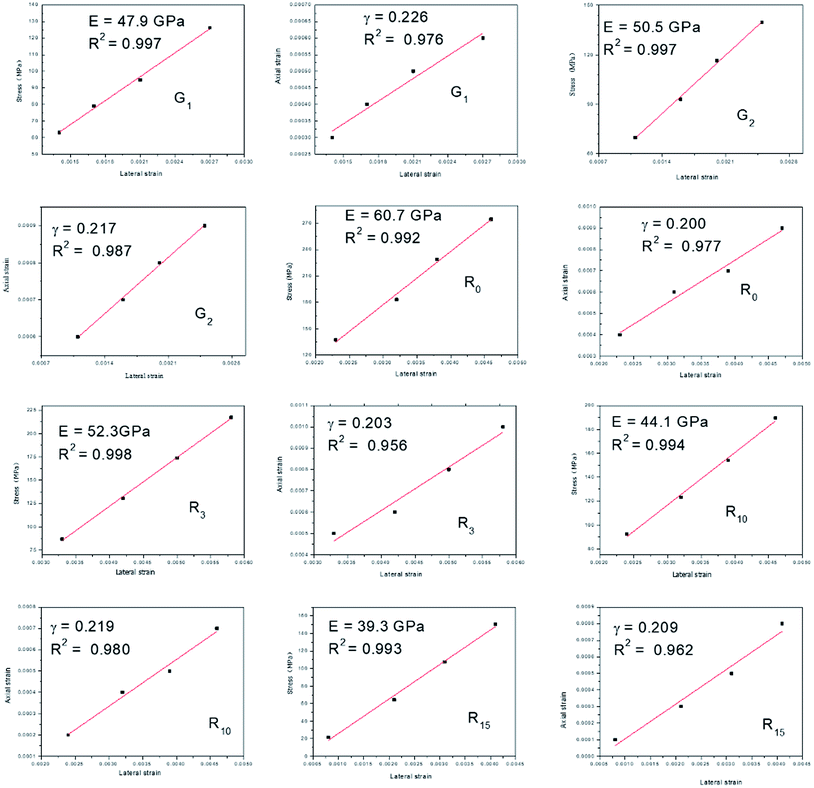
The stress could be calculated by the load and the sectional area of the samples, and the lateral and axial strains of the samples under various loads could be tested by the DIC measurement. Consequently, the stress–strain curves and the lateral–axial strain curves were obtained, as shown in Fig. 4.
Herein, four compressive loads were applied for each sample, and the slopes of the stress–strain curves and the lateral–axial strain curves provided the elastic modulus and Poisson's ratio of the sample, respectively. All the correlation coefficients R2 of the linear fittings for the curves were greater than 0.95, suggesting that the 2D-DIC system was competent to provide precise measurements of the strains.
3.3 Thickness ratio of the glazed tiles
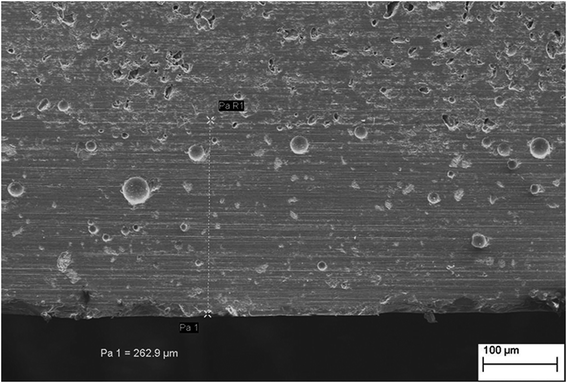
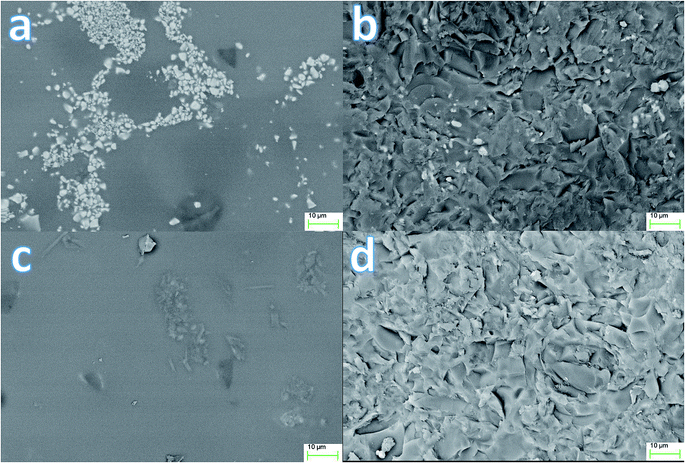
To study the effect of the thickness of glazes and ceramic bodies on the wear resistance of the samples and calculate the stress on the glaze surface, the glaze thicknesses were measured by SEM. Fig. 5 shows the cross-section images of the sample R0712. As the glazed layers had different morphology than the ceramic bodies, these two layers were clearly distinguished; moreover, since the heating process lasted for only 35 min, the gas could not be fully released during this extremely fast process. Although many bubbles existed in the samples, as shown in Fig. 5, the water absorption was less than 0.4%. As shown in Fig. 6, no blowhole defects were observed on the sample surfaces with or without the abrasion test; this indicated that the samples were sufficiently compact to be used for the abrasion test. The thicknesses of the glazes were measured by SEM, and the thicknesses of the sintered glazed tiles were measured by a micrometer caliper. Via this way, the thickness ratios of the glazed tiles were calculated and are listed in Table 2. Since G1 and G2 have similar components, the R-G1 and R-G2 samples have similar glaze thicknesses. Thus, the thickness ratio of these two series was similar to that of the sample R0710.| Sample | R088 | R0810 | R078 | R068 | R0710 | R0610 | R0812 | R0712 | R0612 |
|---|---|---|---|---|---|---|---|---|---|
| Thickness ratio | 0.018 | 0.024 | 0.025 | 0.026 | 0.028 | 0.033 | 0.039 | 0.040 | 0.043 |
3.4 Thermal expansivity of the glazes and ceramic tiles
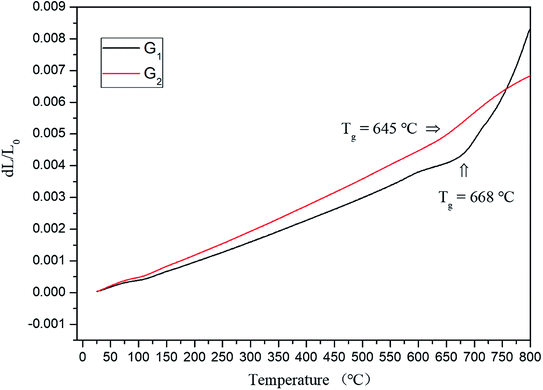
Both ceramic bodies and glazes are isotropic materials. The thermal expansivities of the glazes and ceramic bodies are αg and αb, respectively. Under the condition of αb > αg, the ceramic body suffers a tension stress, and the glaze suffers a pressure stress. The thermal expansivity investigated in this study was an average value of that obtained in the range from room temperature (25 °C) to Tg of the glaze. After the annealing treatment, the glass network structure of the glaze would become denser without any change in the thermal expansivity; this would lead to a greater expansion of the sample beyond Tg during the heating process than that for the sample without annealing; this phenomenon is expressed as a sudden increase in the slope of the thermal expansion curves.27 Thus, the thermal deformation and Tg of the samples could be measured by the thermal expansion curves, as shown in Fig. 7. It was observed that G1 and G2 presented similar thermal deformation behavior, and the Tg values of G1 and G2 were 668 °C and 645 °C, respectively. Because the degree of densification in G1 might be greater than that in G2, the slope of the G1 curves increased more. To simplify and make the calculation of thermal expansivity uniform, the temperatures used in this study ranged from 640 °C to 25 °C. The thermal expansivities of the ceramic bodies and glazes are listed in Table 3. Due to its extremely low thermal expansion, fused quartz has been widely used to reduce the thermal expansivity of heated components. Table 3 shows that the addition of fused quartz can significantly reduce the thermal expansivity of ceramic bodies, and the thermal expansivity of ceramic bodies added with 15 wt% fused quartz is 68% of that without fused quartz.| Sample | Thermal expansivity (×10−6 °C−1) |
|---|---|
| R0 | 8.9 |
| R3 | 8.6 |
| R10 | 7.9 |
| R15 | 6.8 |
| G1 | 6.5 |
| G2 | 7.7 |
3.5 The calculation of prestress
For an infinitely flat-shaped sample, the thickness ratio of the glaze layer to the green body layer can be denoted as j. During the cooling process, when the temperature is lower than the glaze temperature (Tg), both the glaze and the green body contract as the temperature decreases. In the absence of an external force, the contraction of the glaze differs from that of the ceramic. However, as they are bonded together and cannot contract freely, both the stress σg (for glaze) and σb (for the ceramic body) are experienced, resulting in the shrinking of the glaze and ceramic body at the same rate throughout the cooling process. Since the thermal expansivity of the ceramic body is larger than that of the glaze, σg is the pressure stress and σb is the tensile stress; moreover, the difference between the temperature of the glaze Tg and the natural surrounding temperature is named ΔT. Eqn (1) can be obtained by the static balance condition:
 | (1) |
As glaze and ceramic experience the same contraction, it can be derived that
 | (2) |
 | (3) |
| Δg = Δb | (4) |
Thus, the pressure stress of the glaze can be derived using eqn (1)–(4):
 | (5) |
3.6 The effect of prestress and zircon grains
The abrasion weight loss of G1 and G2 glazing on four kinds of ceramic bodies and the stresses of each sample calculated through eqn (5) are listed in Table 4. Eqn (5) shows that when the thermal expansivity of the ceramic body is greater than that of glaze, the pressure stress that the glaze suffers is stronger. R0 possessed highest thermal expansivity, and R15 possessed lowest thermal expansivity. Thus, R0-G1 and R0-G2 possessed strongest pressure stresses, whereas R15-G1 and R15-G2 possessed weakest pressure stresses in the G1 and G2 sample series, respectively. Because the thermal expansivity of R15 was lower than that of G2, the sample R15-G2 suffered tensile stress, which could be defined as a negative value of pressure stress. Moreover, with an increase in the pressure stresses of the glazes, the weight losses of the samples diminished accordingly; this was attributed to the stronger wear resistance performance. Regardless of whether wear-resistance grains (in this study, zircon) were included in the glazes, the pressure stress could enhance the wear resistance of the glazed tiles, and the reinforcement effect of the zircon grains was more effective than prestress. In this study, the gains in wear resistance contributed by the pressure stress were 14.4% and 17.6% for G1 and G2, respectively. Although the pressure stresses of the samples R15-G1 and R10-G2 were similar and close to those of the stress-free samples, the abrasion weight loss of the former was 35.9% less than that of the latter, respectively, due to the addition of 7.2 wt% zircon grains. Compared with that of the sample R15-G2, the weight loss of the sample R0-G1 decreased by 62.7% due to the introduction of the zircon grains (7.2 wt%) and preloading of a high pressure stress (123.7 MPa).| Sample | Weight loss (mg) | Pressure stress (MPa) |
|---|---|---|
| R0-G1 | 99.2 ± 2.0 | 89.3 |
| R3-G1 | 105.4 ± 4.4 | 77.9 |
| R10-G1 | 109.7 ± 1.7 | 51.7 |
| R15-G1 | 113.5 ± 0.5 | 11.0 |
| — | — | — |
| R0-G2 | 137.2 ± 1.2 | 46.4 |
| R3-G2 | 146.3 ± 3.1 | 34.7 |
| R10-G2 | 154.3 ± 4.5 | 7.7 |
| R15-G2 | 161.4 ± 3.5 | −34.4 |
3.7 Effect of the thickness of glaze and body
Table 5 lists the abrasion weight losses and the calculated stresses of G2 glazed tiles with different thickness ratios (glaze/body). The results suggested that the effect of the thickness ratio on the stress suffered by the glaze was significantly weaker than the effects of thermal expansion when compared with the results presented in Table 4. Furthermore, the relationship between the glaze thicknesses and the abrasion weight losses of the R06, R07 and R08 series samples is shown in Fig. 8. For the samples with the same ceramic body thickness (approximately 6 mm, 7 mm or 8 mm), an increase in the glaze thickness led to an increase in the weight loss of the samples; this indicated a relatively weaker wear resistance capacity. Moreover, for the glazed tiles with glaze layers of similar thickness, an increase in the thickness of the ceramic bodies would enhance their wear resistance. A glazed tile may undergo deformation during the cooling process due to the different contractions of the glaze and ceramic body. This deformation of the glazed tiles causes a structural adjustment in the glaze–ceramic body, and the actual value of the pressure stress may be less than the calculated value. A thicker ceramic body or thinner glaze layer may lead to a weaker deformation of the glazed tiles; thus, the value of the pressure stress is more consistent with the ideal model. In this study, the sample R088 had the thickest ceramic body layer, the thinnest glaze layer and the highest pressure stress among the sample G2 series, and the abrasion weight loss of R088 was 23.9% less than that of R15-G2.| Sample | Thickness ratio | Weight loss (mg) | Pressure stress (MPa) |
|---|---|---|---|
| R088 | 0.018 | 130.3 ± 1.7 | 46.8 |
| R0810 | 0.024 | 134.0 ± 1.4 | 46.6 |
| R078 | 0.025 | 134.6 ± 0.6 | 46.5 |
| R068 | 0.026 | 139.6 ± 0.8 | 46.5 |
| R0710 | 0.028 | 137.2 ± 1.2 | 46.4 |
| R0610 | 0.033 | 143.2 ± 0.2 | 46.2 |
| R0812 | 0.039 | 142.4 ± 1.4 | 46.0 |
| R0712 | 0.040 | 143.7 ± 0.9 | 46.0 |
| R0612 | 0.043 | 146.0 ± 0.2 | 45.9 |
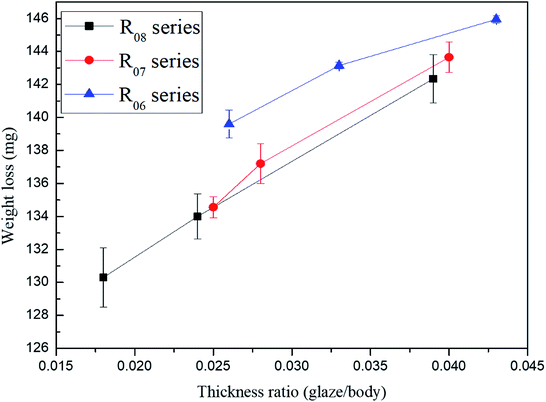 | ||
| Fig. 8 The average weight loss of the R06, R07 and R08 series G2 glazed tiles with different thickness ratios. | ||
3.8 Prestress measurement
Fig. 9 shows the optical images of the 2D-DIC measurement platform and the initial and post-treatment state of the sample. By fixing the position of the camera as well as the sample, not only could the stability of the test be guaranteed, but also the strain field prior to and after the sample processing could be obtained through the 2D-DIC analysis, whose results are shown in Fig. 10. After the annealing treatment, the tempering stress on the surface of the samples was virtually eliminated. Therefore, the strains caused by annealing appeared in the directions of the X axis and Y axis, whose figures were 0.0002 and 0.0003, respectively. Since the strip cutting process is only helpful to release the stress in the direction normal to the strip, the experimental strip direction was parallel to the X axis. Therefore, no strain was detected in the X axis direction after the slitting processing, whereas the large strain of 0.0010 was generated in the Y-axis direction. The results show that the sample suffered both the tempering stress and shrinkage stress during the cooling process; based on the elastic modulus of the glaze, the tempering stress was calculated to be 10.1–15.2 MPa, and the shrinkage stress was 50.5 MPa; these values were close to the results obtained from the simulation calculations.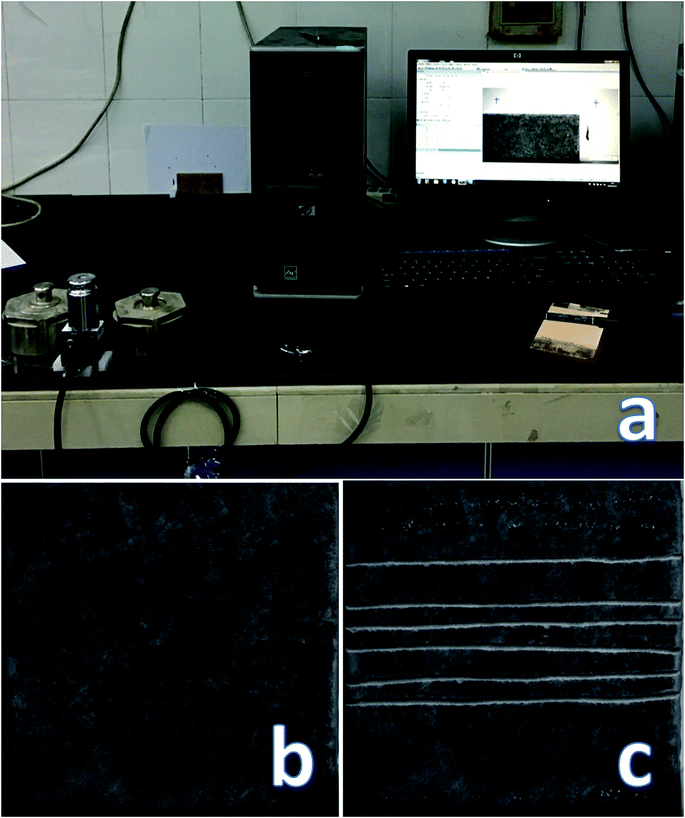 | ||
| Fig. 9 The 2D-DIC system and sample surface images ((a) DIC system, (b) initial surface of sample, and (c) strip-cutting destruction surface of sample). | ||
4 Conclusion
(1) The elastic modulus and Poisson ratio of the glaze and ceramic bodies can be accurately, conveniently and efficiently measured by a 2D-DIC system. The prestress of the glaze can then be calculated according the double-layer thermal residual stress model. The stress of the glazed tile can be measured by this 2D-DIC system combined with the stress-release method.(2) A greater thermal expansivity difference or a lower thickness ratio between the glaze and the ceramic body can enhance the wear resistance of the glaze by providing a stronger pressure stress to the glaze or reducing the deformation of the glazed tile, respectively. As the thermal expansivity of the ceramic body increased from 6.8 × 10⁻⁶ °C−1 to 8.9 × 10⁻⁶ °C−1 and the thickness ratio of the G2 glazed tile decreased from 0.043 to 0.018, the calculated pressure stress of the G2 glazed tiles was increased by 81.2 MPa, and the abrasive weight loss of the glazed tiles was reduced by 23.9%.
(3) Glaze wear resistance can be effectively reinforced by compositely introducing hard grains and prestress. In this study, compared with the cases of the samples R0-G1 and R15-G2, the addition of a 123.7 MPa prestress and 7.2 wt% zircon resulted in the reduction of the glaze abrasive weight loss by 62.7%.
Conflicts of interest
There are no conflicts to declare.Acknowledgements
This work was financially supported by the National Natural Science Foundation of China (Grant No. B5141540).References
- L. Fröberg, et al., Chemical durability of glazed surfaces, J. Eur. Ceram. Soc., 2007, 27(2), 1811–1816 CrossRef.
- L. Hupa, et al., Chemical resistance and cleanability of glazed surfaces, Surf. Sci., 2005, 584(1), 113–118 CrossRef CAS.
- M. Piispanen, et al., Chemical resistance and cleaning properties of coated glazed surfaces, J. Eur. Ceram. Soc., 2009, 29(10), 1855–1860 CrossRef CAS.
- J. Määttä, et al., Effect of coating on cleanability of glazed surfaces, J. Eur. Ceram. Soc., 2007, 27(16), 4555–4560 CrossRef.
- R. Kuisma, et al., Microstructure and cleanability of uncoated and fluoropolymer, zirconia and titania coated ceramic glazed surfaces, J. Eur. Ceram. Soc., 2007, 27(1), 101–108 CrossRef CAS.
- E. Barrachina, et al., Development of a glass-ceramic glaze formulated from industrial residues to improve the mechanical properties of the porcelain stoneware tiles, Mater. Lett., 2018, 220, 226–228 CrossRef CAS.
- M. Sheikhattar, H. Attar and S. Sharafi, et al., Influence of surface crystallinity on the surface roughness of different ceramic glazes, Mater. Charact., 2016, 118, 570–574 CrossRef CAS.
- A. Viat, M. De Barros Bouchet and B. Vacher, et al., Nanocrystalline glaze layer in ceramic-metallic interface under fretting wear, Surf. Coat. Technol., 2016, 308, 307–315 CrossRef CAS.
- G. Topateş, B. Tarhan and M. Tarhan, Chemical durability of zircon containing glass-ceramic glazes, Ceram. Int., 2017, 43(15), 12333–12337 CrossRef.
- M. Leśniak, J. Partyka and M. Sitarz, Impact of ZnO on the structure of aluminosilicate glazes, J. Mol. Struct., 2016, 1126, 251–258 CrossRef.
- Y. Abouliatim, et al., Study of borosilicate glaze opacification by phosphates using Kubelka–Munk model, Ceram. Int., 2017, 43(8), 5862–5869 CrossRef CAS.
- B. Karasu, E. Dölekçekiç and B. Özdemir, Compositional modifications to floor tile glazes opacified with zircon, Br. Ceram. Trans., 2013, 100(2), 81–85 CrossRef.
- R. J. Castilone, D. Sriram and W. M. Carty, et al., Crystallization of Zircon in Stoneware Glazes, J. Am. Ceram. Soc., 1999, 82(10), 2819–2824 CrossRef CAS.
- I. L. Aurélio, L. S. Dorneles and L. G. May, Extended glaze firing on ceramics for hard machining: Crack healing, residual stresses, optical and microstructural aspects, Dent. Mater., 2017, 33(2), 226–240 CrossRef PubMed.
- S. Ghosh, K. S. Pal and N. Dandapat, et al., Glass-ceramic glazes for future generation floor tiles, J. Eur. Ceram. Soc., 2013, 33(5), 935–942 CrossRef CAS.
- S. Wang, C. Peng and H. Xiao, et al., Microstructural evolution and crystallization mechanism of zircon from frit glaze, J. Eur. Ceram. Soc., 2015, 35(9), 2671–2678 CrossRef CAS.
- E. Bou, A. Moreno and A. Escardino, et al., Microstructural study of opaque glazes obtained from frits of the system: SiO2-Al2O3-B2O3-(P2O5)-CaO-K2O-TiO2, J. Eur. Ceram. Soc., 2007, 27(2–3), 1791–1796 CrossRef CAS.
- M. Llusar, C. Rodrigues and J. Labrincha, et al., Reinforcement of single-firing ceramic glazes with the addition of polycrystalline tetragonal zirconia (3Y-TZP) or zircon, J. Eur. Ceram. Soc., 2002, 22(5), 639–652 CrossRef CAS.
- T. Murakami, et al., Zirconia surface modification by a novel zirconia bonding system and its adhesion mechanism, Dent. Mater., 2017, 33(12), 1371–1380 CrossRef CAS PubMed.
- L. Kurpaska, Structural properties of zirconia-in situ high temperature XRD characterization, J. Mol. Struct., 2018, 1163, 287–293 CrossRef CAS.
- A. Koike, et al., Difference of cracking behavior due to Vickers indentation between physically and chemically tempered glasses, J. Non-Cryst. Solids, 2012, 358(24), 3438–3444 CrossRef CAS.
- C. L. Shepard, B. D. Cannon and M. A. Khaleel, Measurement of Internal Stress in Glass Articles, J. Am. Ceram. Soc., 2010, 86(8), 1353–1359 CrossRef.
- BS ISO 19603-2016, Fine ceramics (advanced ceramics, advanced technical ceramics), Test method for determining elastic modulus and bending strength of thick ceramic coatings.
- ASTM E1876-01(2006), Standard Test Method for Dynamic Young's Modulus, Shear Modulus, and Poisson's Ratio by Impulse Excitation of Vibration.
- I. A. Lima Neto, M. A. R. Ceia, R. M. Misságia, G. L. P. Oliveira, V. H. Santos, R. P. R. Paranhos and N. L. Archilha, Testing and evaluation of 2D/3D digital image analysis methods and inclusion theory for microporosity and S-wave prediction in carbonates, Mar. Pet. Geol., 2018, 97, 592–611 CrossRef.
- M. A. Sutton and F. Hild, Recent Advances and Perspectives in Digital Image Correlation, Exp. Mech., 2015, 55(1), 1–8 CrossRef.
- W. D. Kingery, H. K. Bowen and D. R. Uhlmann, Introduction To Ceramics, Wiley, New York, NY, USA, 2nd edn, 1976 Search PubMed.
| This journal is © The Royal Society of Chemistry 2019 |

