 Open Access Article
A novel n-type CdS nanorods/p-type LaFeO3 heterojunction nanocomposite with enhanced visible-light photocatalytic performance
Akram-Alsadat Hoseini,
Saeed Farhadi *,
Abedin Zabardasti
 and
Firouzeh Siadatnasab
Department of Chemistry, Lorestan University, Khorramabad, 68151-44316, Iran. E-mail: farhadi.s@lu.ac.ir; sfarhadi1348@yahoo.com; Fax: +986633120618; Tel: +986633120611
First published on 7th August 2019
Abstract
In this work, a novel n-type CdS nanorods/p-type LaFeO3 (CdS NRs/LFO) nanocomposite was prepared, for the first time, via a facile solvothermal method. The as-prepared n-CdS NRs/p-LFO nanocomposite was characterized by using powder X-ray diffraction (XRD), Fourier transform infrared spectroscopy (FT-IR), X-ray photoelectron spectroscopy (XPS), scanning electron microscopy (SEM), high-resolution transmission electron microscopy (HR-TEM), energy-dispersive X-ray spectroscopy (EDX), UV-visible diffuse reflection spectroscopy (DRS), vibrating sample magnetometry (VSM), photoluminescence (PL) spectroscopy, and Brunauer–Emmett–Teller (BET) surface area analysis. All data revealed the attachment of the LFO nanoparticle on the surface of CdS NRs. This novel nanocomposite was applied as a novel visible light photocatalyst for the degradation of methylene blue (MB), rhodamine B (RhB) and methyl orange (MO) dyes under visible-light irradiation. Under optimized conditions, the degradation efficiency was 97.5% for MB, 80% for RhB and 85% for MO in the presence of H2O2 and over CdS NRs/LFO nanocomposite. The photocatalytic activity of CdS NRs/LFO was almost 16 and 8 times as high as those of the pristine CdS NRs and pure LFO, respectively. The photocatalytic activity was enhanced mainly due to the high efficiency in separation of electron–hole pairs induced by the remarkable synergistic effects of CdS and LFO semiconductors. After the photocatalytic reaction, the nanocomposite can be easily separated from the reaction solution and reused several times without loss of its photocatalytic activity. Trapping experiments indicated that ·OH radicals were the main reactive species for dye degradation in the present photocatalytic system. On the basis of the experimental results and estimated energy band positions, the mechanism for the enhanced photocatalytic activity was proposed.
1. Introduction
In the past decades, novel visible-light-driven semiconductors have attracted considerable attention as the most promising materials in the photocatalytic field, especially for the application in degradation of organic contaminants and the conversion of solar energy.1–4 Among various semiconducting materials, TiO2 is probably the most promising one because of its high photocatalytic efficiency, excellent chemical and photochemical stability, environmental friendliness, and low-cost for large-scale water treatment.5,6 However, TiO2 can absorb only UV light in the solar spectrum, accounting for only 4–5% of sunlight, because of its large energy band gap of 3.2 eV, so that the effective utilization of visible light or solar energy is limited.7–12 To increase the utilization efficiency of sunlight and improve the photocatalytic activity, novel visible-light photocatalysts with high activity and stability must be developed.13–18Among visible-light-driven photocatalysts, cadmium sulfide (CdS), an n-type semiconductor with a band gap of ∼2.4 eV, is one of the most important semiconductors and has been extensively studied during the past decades.19–21 The narrower band gap promotes the utilization of visible light and makes CdS a competitive candidate as a visible light photocatalyst. However, the rapid recombination of the excited electron–hole pairs, low quantum yield and high susceptible to sulfide photocorrosion of the CdS-based photocatalyst are obstacles which seriously limit its further utilization in practical wastewater remediation.22 The construction of p–n-type heterojunction composites should be a suitable strategy to delay the electron–hole pair recombination, stabilize the structure, and improve the photocatalytic activity of semiconductors.23–27 In this context, the CdS-based heterojunctions such as CdS–TiO2,28 CdS–GO,29 CdS–Bi2MoO6,30 CdS–Bi2WO6,31 CdS–C3N4![[thin space (1/6-em)]](https://www.rsc.org/images/entities/char_2009.gif) 32 and CdS–Bi2O2CO3
32 and CdS–Bi2O2CO3![[thin space (1/6-em)]](https://www.rsc.org/images/entities/char_2009.gif) 33 have been reported, which exhibited high photocatalytic activity and stability. However, the wide band gap semiconductors can not absorb as much visible light or solar energy. If CdS combines with a narrow band gap semiconductor, the light absorbing would be enhanced. Thus, the continuous development of visible light driven semiconductor cocatalysts is essential to enhance the photocatalytic activity of CdS photocatalysts.34–37
33 have been reported, which exhibited high photocatalytic activity and stability. However, the wide band gap semiconductors can not absorb as much visible light or solar energy. If CdS combines with a narrow band gap semiconductor, the light absorbing would be enhanced. Thus, the continuous development of visible light driven semiconductor cocatalysts is essential to enhance the photocatalytic activity of CdS photocatalysts.34–37
Perovskite-type lanthanum-orthoferrite (LaFeO3) is an important p-type semiconductor which can be driven by visible light owing to the narrow band gap of ∼2.0 eV.38 LaFeO3 exhibits high photocatalytic activity towards degradation of organic contaminant under visible light irradiation and it is stable in various environments.39 Until now, a few of LaFeO3-based heterojunctions such as LaFeO3/Ag3PO4,40 LaFeO3/SrTiO3,41 LaFeO3/TiO2,42 LaFeO3/C3N4,43 LaFeO3/GrO,44 LaFeO3/H3PW12O40![[thin space (1/6-em)]](https://www.rsc.org/images/entities/char_2009.gif) 45 and LaFeO3/Ag2CO3
45 and LaFeO3/Ag2CO3![[thin space (1/6-em)]](https://www.rsc.org/images/entities/char_2009.gif) 46 have been reported for specific photocatalytic reactions, indicating that LaFeO3-based catalysts exhibit enhanced photocatalytic activity. Therefore, the combination of n-type CdS with p-type LaFeO3 semiconductor could be a good method to improve the visible light absorption capability and further enhance the photocatalytic performance of CdS under visible light irradiation. As far as we know, the combination of p-type LaFeO3 and n-type CdS for photocatalytic purposes has not been reported previously.
46 have been reported for specific photocatalytic reactions, indicating that LaFeO3-based catalysts exhibit enhanced photocatalytic activity. Therefore, the combination of n-type CdS with p-type LaFeO3 semiconductor could be a good method to improve the visible light absorption capability and further enhance the photocatalytic performance of CdS under visible light irradiation. As far as we know, the combination of p-type LaFeO3 and n-type CdS for photocatalytic purposes has not been reported previously.
In this work, a novel CdS nanorods/LaFeO3 (CdS NRs/LFO) nanocomposite was prepared via a facile solvothermal method. Several spectroscopic techniques were used to characterize the CdS NRs/LFO nanohybrid. The photocatalytic performance of the CdS NRs/LFO nanocomposite for H2O2-assisted degradation of organic dyes such as methylene blue (MB), rhodamine B (RhB), and methyl orange (MO) under visible light irradiation has been evaluated. The effects of different parameters i.e., H2O2 amount, catalyst dosage and initial dye concentration on the process efficiency were investigated. Furthermore, the activity of CdS NRs/LFO nanocomposite was compared with those of pure CdS NRs and LFO under similar conditions. To the best of our knowledge, there are no reports on the enhanced visible-light activities of CdS NRs for photocatalytic degradation of organic dyes by coupling with a perovskite-type mixed oxide such as LFO nanoparticles. On the basis of the calculated energy band positions and the active species during photocatalytic process, a mechanism of the photocatalysis was proposed and discussed.
2. Experimental
2.1. Materials
All reagents were purchased from Merck chemical company and used without further purification: cadmium nitrate (Cd(NO3)2·4H2O, 97%), thiourea (CH4N2S, 98.5%), ethylenediamine (C2H8N2, 100%), potassium hexacyanoferrate(III) (K3[Fe(CN)6]·5H2O, 99%), lanthanum(III) nitrate hexahydrate (La(NO3)3·6H2O, 98%), methylene blue (MB, C16H18ClN3S, 98%), rhodamine B (RhB, C28H31ClN2O3, 98%), methyl orang (C14H14N3NaO3S, MO, 98%). All other reagents used in this study were analytically pure and used without further purification.2.2. Characterization techniques
X-ray powder diffraction (XRD) patterns were obtained at room temperature by a XPertPro Panalytical diffractometer using Ni-filtered Cu Kα radiation (l = 1.5406 Å). Infrared spectra were obtained using a Shimadzu 160 Fourier-transform infrared spectroscopy (FTIR) instrument in the range of 4000–500 cm−1. UV-Vis diffuse reflectance spectra (DRS) of photocatalyst samples were measured on Scinco S4100 spectrophotometer using BaSO4 as the reference. The morphological observation and the elemental mappings were carried out with a field emission scanning electron microscopy (FESEM, Mira3 Tescan, Czech) equipped with a link energy-dispersive X-ray analyzer. Transmission electron microscopy (TEM) and high-resolution-TEM (HRTEM) images were taken on EM10C electron microscope operating at a voltage of 100 kV. The Brunauer–Emmett–Teller (BET) analysis was performed to obtain the specific surface area and porosity of samples by a PHS-1020 PHSCHINA nitrogen adsorption apparatus at 77 K. All the samples were degassed at 180 °C prior to nitrogen adsorption measurements. An adsorption isotherm was used to determine the pore size distribution by the Barrett–Joyner–Halenda (BJH) method. Magnetic measurements were employed using a vibrating sample magnetometer (VSM, Daneshpajoh Kashan Co, Iran) with a maximum magnetic field of ±10 kOe at room temperature. X-Ray photoelectron spectroscopy (XPS) measurements were obtained using the Bestec XPS system with an Mg-Kα source and photon energy of 1486.6 eV. All the binding energies were referenced to the C 1s peak at 284.6 eV of the surface adventitious carbon. The photoluminescence (PL) spectra of photocatalysts were measured using a fluorescence spectrophotometer (F-4500, Hitachi) at an excitation wavelength of 330 nm. Ultraviolet-visible (UV-Vis) spectra of dye solutions during photocatalytic degradations were recorded at room temperature on a Varian Cary 100 spectrophotometer. The content of LFO in the nanocomposite was determined by inductively coupled plasma atomic emission spectroscopy (ICP-AES, model OEC-730).2.3. Synthesis of CdS nanorods (CdS NRs)
Cd(NO3)2·4H2O (1.92 g) and thiourea (1.42 g) were added to 40 mL of ethylenediamine solvent and stirred for 15 min at room temperature. Then, the mixture was transferred into a 50 mL Teflon-lined autoclave and maintained at 180 °C for 24 h. The yellow colored precipitate was separated, washed several times with ethanol and distilled water and then dried at 80 °C for 12 h.2.4. Synthesis of LaFeO3 nanoparticles (LFO NPs)
Initially, La[Fe(CN)6]·5H2O complex was synthesized as a reddish-brown precipitate via mixing aqueous solutions of equimolar amounts of La(NO3)3·6H2O (2.16 g, 5 mmol) and K3[Fe (CN)6] (1.64 g, 5 mmol) with continuous stirring, according to the literature method.47 The resulting precipitate was washed with water, ethanol and diethyl ether, before drying in air at 50 °C. In order to prepare LFO nanoparticles, an appropriate amount (5 g) of the La[Fe(CN)6]·5H2O complex was placed in a porcelain crucible and then heated in a furnace electric at 700 °C under air atmosphere for 2 h.2.5. Synthesis of CdS nanorods/LaFeO3 (CdS NRs/LFO)
The synthetic route to CdS NRs/LFO composite is described as follows: LFO NPs (0.1 g) were dispersed in ethylenediamine (40 mL) and sonication for 1 h. Then, Cd(NO3)2·4H2O (0.32 g) and thiourea (0.16 g) were added, and the mixture was sonicated for 30 min. Then, the above mixture was transferred into a 50 mL Teflon-lined autoclave and maintained at 200 °C for 24 h. The pale green precipitate was filtered and washed several times with ethanol and distilled water and then dried at 80 °C for 12 h. For comparison, pure CdS nanorods sample was also prepared in ethylenediamine solvent under the same conditions without adding LaFeO3. The ICP-AES results indicated that the loading amount of LaFeO3 in the as-prepared CdS nanorods/LaFeO3 (CdS NRs/LFO) nanocomposite was estimated to be 38.85 wt%.2.6. Photocatalytic degradation of organic dyes
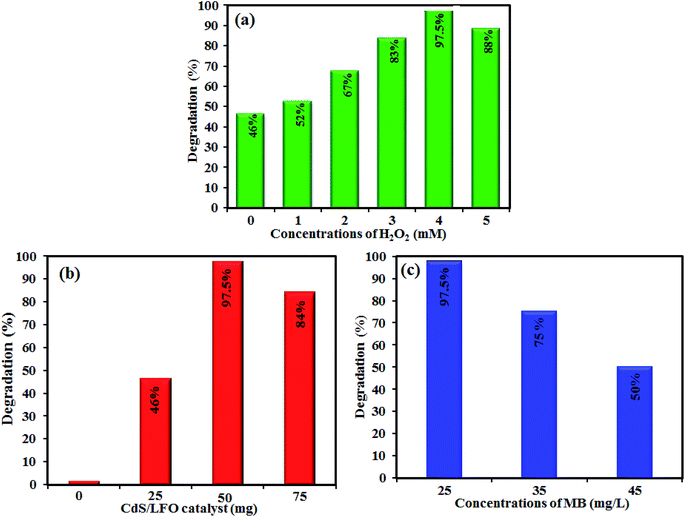
Visible light photocatalytic activity of the CdS NRs/LFO nanocomposite was evaluated for the degradation of MB, RhB and MO dyes in aqueous solutions. A 400 W Hg lamp with a UV cutoff filter (λ > 420 nm) was used as the visible light source. The reactions were conducted in an open Pyrex cylindrical glass vessel containing dye solution (100 mL, 25 mg L−1), H2O2 (4 mM) and CdS NRs/LFO photocatalyst (50 mg). The suspension was magnetically stirred in the dark for 3 h to attain adsorption–desorption equilibrium prior to irradiation by visible light. At a defined time interval, 2 mL aliquots of the reaction solution were sampled, the samples were centrifuged to remove the suspended CdS NRs/LFO. The residual MB, RhB, and MO concentrations were determined on a UV-Vis spectrometer at maximum absorbance wavelengths of 664, 554, and 463 nm, respectively. The degradation percentage was calculated using: [(C0 − Ct)/C0] × 100%, where C0 is the dye concentration after adsorption equilibrium and before irradiation and C is the dye concentration after irradiation.The effects of various parameters, such as the concentration of H2O2 (0–5 mM), photocatalyst dosage (0–75 mg) and initial dye concentration (25–45 mg L−1) were studied on the photocatalytic activity of the CdS NRs/LFO nanocomposite by a similar process described above. Photocatalytic activities of pure CdS NRs and pristine LFO were also evaluated by the degradation of MB aqueous solution in a same manner. To investigate the photocatalytic stability and reusability of the sample, the photocatalytic activity measurements mentioned above were repeated for five cycles using an aqueous MB solution (50 mL, 25 mg L−1). After each cycle, the spent photocatalyst was separated from the treated MB solution, washed with deionized water, dried in an oven, and used for the next cycle.
3. Results and discussion
3.1. Characterization of the photocatalyst
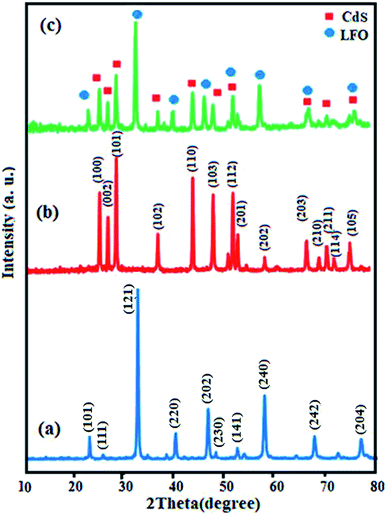
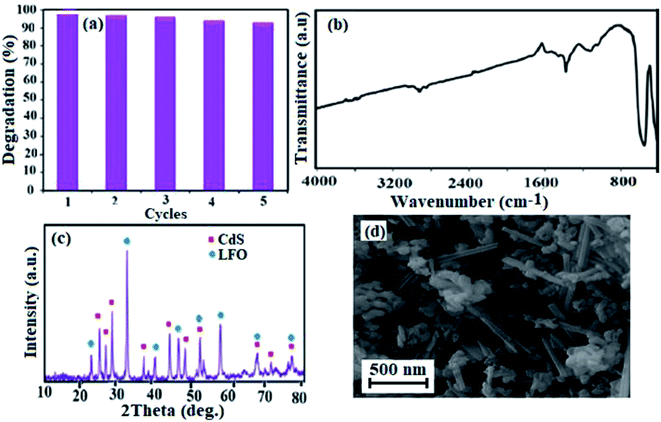
Crystal structure and phase composition of the samples were first characterized by XRD and the results are shown in Fig. 1. Fig. 1(a) illustrates the XRD pattern of pure LFO nanoparticles and all peaks can be well-indexed to the perovskite-type LFO phase according to the JCPDS card no. 37-1493. The XRD pattern of pristine CdS NRs in Fig. 1(b) showed the presence of hexagonal phase as can be seen from the well-resolved diffraction peaks and the excellent matching of the diffraction pattern with the database pattern (JCPDS card no. 75-1545). The diffraction pattern of the nanocomposite in Fig. 1(c) exhibited diffraction peaks corresponding to both CdS NRs and LFO and no other impure peaks can be observed, indicating that the sample is composed of LFO and CdS NRs and the CdS NRs/LFO nanocomposite has been successfully prepared. The Debye–Scherrer formula (eqn (1)) was used to calculate the crystallite size of the LFO nanoparticles:48
Dp = 0.94λ/(β1/2![[thin space (1/6-em)]](https://www.rsc.org/images/entities/char_2009.gif) cos cos![[thin space (1/6-em)]](https://www.rsc.org/images/entities/char_2009.gif) θ) θ)
| (1) |
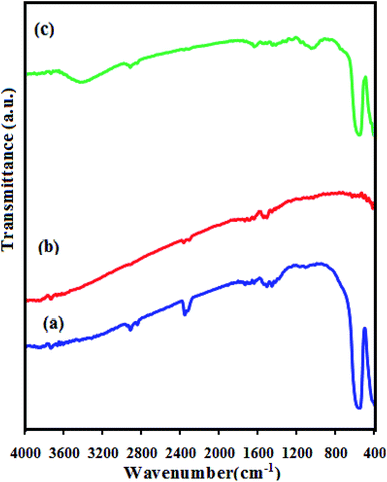
FT-IR spectra of the as-prepared CdS NRs, LFO, and CdS NRs/LFO nanocomposite are indicated in Fig. 2. In the spectrum of LFO in Fig. 2(a), the strong bands at about 557 and 430 cm−1 are assigned to the Fe–O stretching and bending vibrations of the octahedral FeO6 groups in the perovskite-type structure, respectively.49 The FT-IR spectrum of the CdS in Fig. 2(b) does not show any band due to the Cd–S vibration appears below 400 cm−1.50 Fig. 2(c) shows the FT-IR spectrum of the CdS NRs/LFO nanohybrid, which displayed two main absorption bands below 1000 cm−1. These bands could be related to the LFO nanoparticles in the nanocomposite. It is noted that in some spectra broad bands appeared at about 3550 and 1600 cm−1 which are related to the stretching and bending vibrations of the water molecules absorbed by the sample or KBr pellet. Also, in the FT-IR spectra of samples weak bands were observed in the 2400 cm−1 which are attributable to atmospheric CO2 gas chemisorbed on the surface of the samples particles during handling to record the spectra.
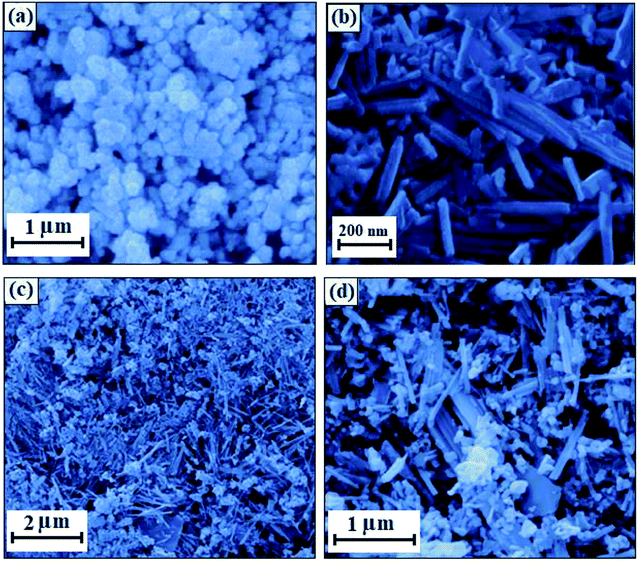
The morphology and microstructure of the CdS NRs/LFO nanocomposite were investigated by scanning electron microscopy (SEM). As shown in Fig. 3, the SEM images of LFO nanoparticle and CdS NRs nanohybrid reveal spherical and nanorod morphologies respectively. The image in Fig. 3(a) indicates that the synthesized LFO nanoparticles are about 80 nm in diameter size. SEM image in Fig. 3(b) show that the CdS NRs have a rough surface and porous structure, and are about 50–80 nm in diameter and 2–3 μm in length which could be used for further to make the LFO spheres on the surface. During the of CdS NRs/LFO hybrid formation, LFO spheres with an average size of 80 nm were formed on the surface of CdS NRs as shown in Fig. 3(c) and (d), confirming the decoration of LFO NPs on the surfaces of the CdS nanorods. Indeed, the CdS NRs in CdS NRs/LFO are rougher than those of pure CdS NRs, because the LFO nanoparticles cover the surface of CdS NRs.
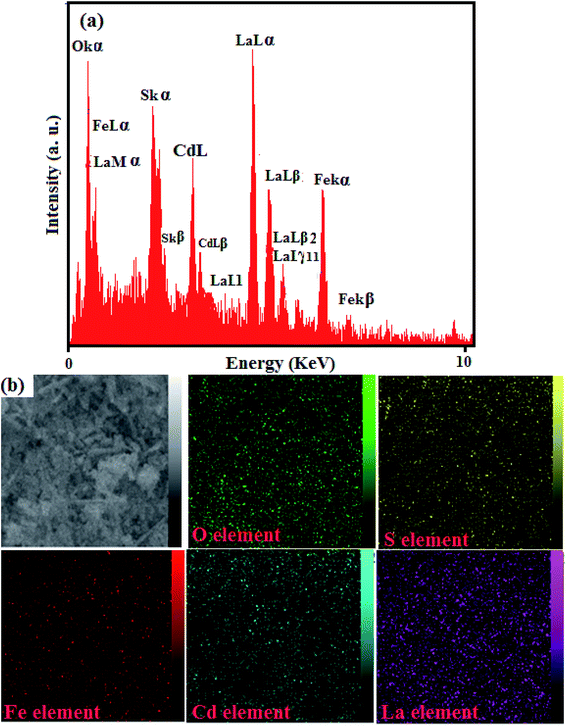
The existence of elements in the CdS NRs/LFO nanocomposite and its chemical composition was further confirmed by EDX spectroscopy and the results are shown in Fig. 4. The EDX spectrum of the nanocomposite in Fig. 4(a) shows the peaks of Cd, S, La, Fe, and O elements at their corresponding keV values. The distribution of elements present in the nanocomposite was studied using SEM-EDX mapping analysis as shown in Fig. 4(b). The elemental mappings show La, Fe, Cd, S and O elements were uniformly distributed over the nanocomposite, confirming the homogeneity of the sample.
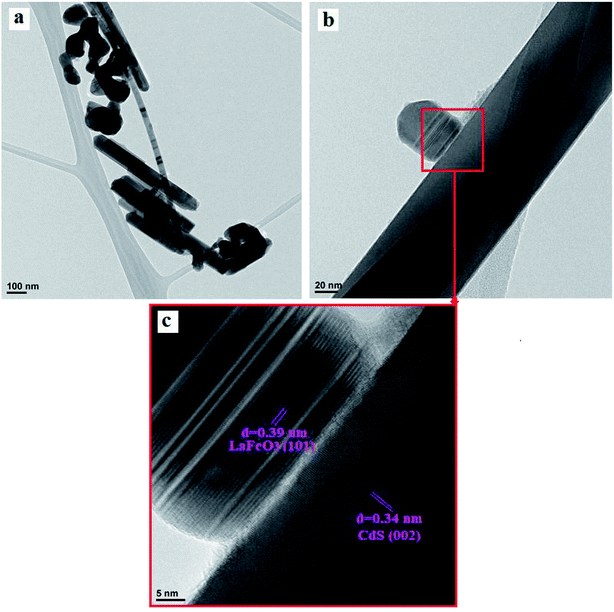
TEM and HRTEM images of the heterogeneous CdS nanoparticles/LFO sample are shown in Fig. 5. As shown in Fig. 5(a) and (b), sphere-like LFO nanoparticles with sizes of about 70–85 nm were evenly dispersed and embedded on the external surface of CdS NRs with diameters of 50–80 nm. It is clearly shown that the LFO nanoparticles partly cover the surface of CdS NRs, which is consistent with the SEM observation. The coexistence of CdS and LFO can be confirmed by high-resolution TEM (HRTEM) image. The local HRTEM image of the CdS NRs/LFO (marked in Fig. 5(b)) is shown in Fig. 5(c). The inter-layer distance of 0.34 nm estimated in the nanorod domain was in good agreement with the d-spacing of the (002) planes of the hexagonal CdS, whereas the inter-layer distance of 0.39 nm identified in the nanoparticle domain was in good agreement with the d-spacing of the (101) planes of the perovskite-type LFO, together indicating that LFO NPs were tightly attached to the CdS surface. These results confirm that a CdS NRs/LFO heterojunction is well-constructed between CdS NRs and LFO nanoparticles. This heterojunction between n-type CdS and p-type LFO can facilitate the charge transfer more readily to significantly reduce the recombination of electron–hole pairs as well as to enhance the visible-light-driven photocatalytic activity of CdS NRs/LFO nanocomposite.
The optical properties of as-synthesized CdS NRs, LFO and CdS NRs/LFO samples were investigated by UV-Vis DRS absorption spectroscopy as shown in Fig. 6. According to the spectrum in Fig. 6(a), the CdS sample exhibited strong absorption in the λ < 540 nm region.51 However, after coupling CdS with LFO, the obtained composite exhibited a wider absorption band in the visible region. The CdS NRs/LFO composite sample was red shifted compared with CdS. This was attributed to LFO particles assembled on the surface of CdS NRs acting as a visible light semiconductor to extend the optical response. Obviously, the visible light absorption of CdS NRs/LFO heterojunction is better than that of CdS, which possibly results good visible-light utilization. The band gap energy (Eg) of samples can be deducted from the formula:51,52 (αhν)2 = B(hν − Eg), where α, ν, and B are absorption coefficient, light frequency and proportionality constant, respectively. The (αhν)2 versus hν curves for CdS NRs, LFO and CdS NRs/LFO nanocomposite are shown in Fig. 6(b)–(d). The value of hν extrapolated to α = 0 gives the absorption band gap energy. The band gap energies were estimated to be 2.4, 2.2 and 2.3 eV for CdS NRs, LFO and CdS NRs/LFO nanocomposite samples, respectively, indicating that the introduction of LFO decreased the Eg of CdS. Furthermore, the decrease of Eg upon composite formation confirms electronic coupling between CdS and LFO. The visible light photocatalytic activity of CdS NRs/LFO nanocomposite could be attributed to the existence of this broad band with the Eg of 2.3 eV.
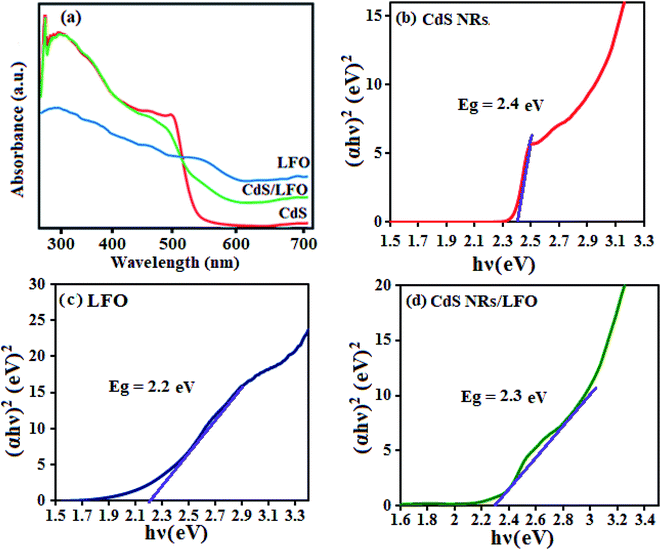 | ||
| Fig. 6 (a) UV-Vis diffuse reflectance spectra and (b–d) band gap energies of different photocatalyst samples. | ||
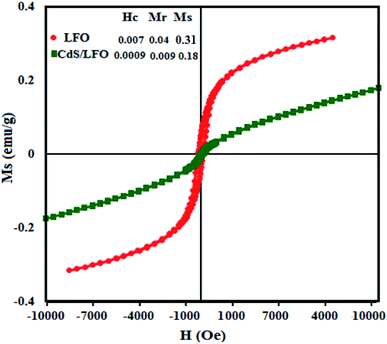
The magnetic behaviors of the pure LFO NPs and CdS NRs/LFO nanocomposite were analyzed by VSM at room temperature. The coercive force (Hc), saturation magnetisation (Ms), and remanent magnetisation (Mr) of CdS NRs/LFO were compared with those of LFO nanoparticles in the inset of Fig. 7. The LFO nanoparticle showed weak magnetic properties with saturation magnetization about 0.31 emu g−1. After decoration of LFO nanoparticles on the surfaces of the CdS NRs, the Ms decreases obviously. Because of the diamagnetic property of CdS, the saturation magnetization of CdS NRs/LFO composite is reduced to 0.18 emu g−1 as compared with that of pure LFO (0.31 emu g−1). This result further indicates that the LFO nanoparticles have been successfully loaded on the surface of CdS NRs.
The porosity and specific surface area of pristine CdS NRs, pure LFO and CdS NRs/LFO nanocomposite samples were investigated through nitrogen adsorption–desorption isotherms and the results are shown in Fig. 8. Based on the IUPAC definition, these isotherms can be classified to type-IV, suggesting the presence of porous structures. Nevertheless, the samples indicate different hysteresis loops. The pure CdS NRs exhibits a very small hysteresis loops. The hysteresis loops of the as-prepared LFO and CdS NRs/LFO samples are of type H3 in the range of p/p0 = 0.7–1.0 and the saturated adsorption state cannot be achieved till p/p0 = 1.0. This clearly suggests the formation of mesopores and macropores in the above materials and is in good agreement with their corresponding pore size distributions in the inset of Fig. 8. The Brunauer–Emmett–Teller (BET) surface area, the pore volume and average pore size for CdS NRs, LFO and CdS NRs/LFO were calculated and the results are presented Table 1. As given in Table 1, the pore volume and average pore size of the CdS NRs/LFO composite material were found to be higher than pure CdS NRs. Furthermore, the BET surface area of composite is relatively high (18.28 m2 g−1) compared to that of pure CdS NRs (5.02 m2 g−1). This could be related to decrease stacking and impeded aggregation of CdS NRs due to the presence of LFO nanoparticles. LFO nanoparticles could not only prevent agglomeration of the CdS NRs and enable a good dispersion of these rod-like particles, but also substantially enhance the porosity and specific surface area of the composite. It can be concluded that introduction of LFO nanoparticles has a good effect on the structure of CdS NRs and increases the surface area and porosity of CdS NRs which are all useful factors for improving the adsorption and photocatalytic performance (indicated later).
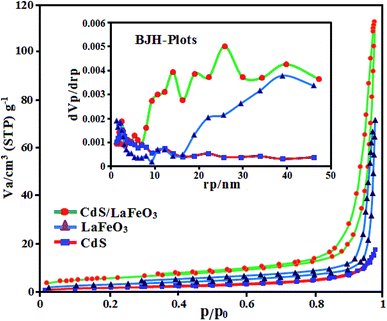 | ||
| Fig. 8 N2 adsorption–desorption isotherms of CdS NRs, LFO and CdS NRs/LFO samples. The inset show the corresponding BJH pore size distribution curves. | ||
| Sample | BET surface area (SBET, m2 g−1) | Total pore volume (Vp, cm3 g−1) | Average pore diameter (rp, nm) |
|---|---|---|---|
| CdS | 5.02 | 0.0262 | 21.46 |
| LaFeO3 | 10.23 | 0.1111 | 43.44 |
| CdS/LaFeO3 | 18.28 | 0.1719 | 38.25 |
The surface composition and chemical state of atoms in the CdS NRs/LFO composite were further analyzed by X-ray photoelectron spectroscopy (XPS). The survey spectrum in Fig. 9(a) indicates the coexistence of Cd, S, La, Fe, and O elements in the composite and no other element signals can be detected, suggesting the high purity of the composite. Fig. 9(b) displays the XPS spectrum of S 2p region, which contains two peaks at 161.95 eV and 162.71 eV assigned to S 2p3/2 and S 2p1/2, respectively, implying that the sulfur occurred as S2− ions.53 The high resolution XPS spectrum of Cd 3d in Fig. 9(c) shows two peaks at 405.58 eV and 412.32 eV which were belong to Cd 3d5/2 and Cd 3d3/2 energy levels respectively.54 The spin orbit separation of the 3d orbital is 6.74 eV, demonstrating that the Cd element in samples exists in the state of Cd2+ ions.55 For pure CdS (XPS not shown here), the Cd 3d5/2 and 3d3/2 peaks are located at 403.70 eV and 410.50 eV, respectively. After coupling with LFO, a positive shift of 2 eV is obviously seen in comparison with pure CdS. The result is attributed to the electron transfer from CdS to LFO. Such a transfer is very favorable to improve the performance of catalyst. In Fig. 9(c), the peaks of Fe 2p3/2 and Fe 2p1/2 at 711.35 and 725.69 eV, respectively, were assigned to the core level spectra of Fe3+ in its oxide form.56 Two La 3d peaks at 836.06 and 852.30 eV in Fig. 9(d) were identified as spin–orbit splitting of 3d5/2 and 3d3/2 of La3+, respectively, in the oxide.57 The O 1s peaks (not shown here) can be deconvoluted into three peaks, corresponding to the surface adsorbed oxygen species, the oxygen of surface hydroxyl and the perovskite lattice oxygen of LFO. The XPS results further confirm the formation of CdS NRs/LFO composite, especially, the presence of strong interaction between CdS and LFO, consistent with the XRD and HR-TEM. In particular, compared with the Cd 3d and S 2p peaks in the spectrum of pure CdS (XPS not shown here), those in the spectrum of CdS NRs/LFO composite are shifted to higher binding energies. Such a shift reflects the decrease in electron density around both Cd2+ and S2− due to electron transfer from CdS to LFO in the CdS NRs/LFO structure, which is very favorable to improve the performance of photocatalyst.
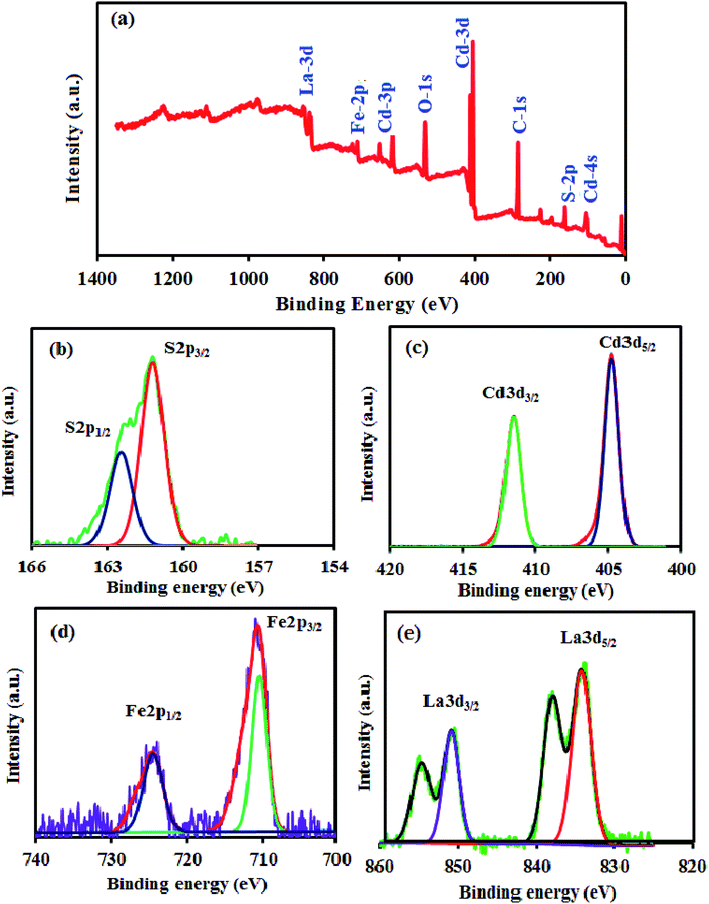 | ||
| Fig. 9 XPS of the CdS NRs/LFO nanocomposite: (a) survey spectrum, (b) S 2p spectrum, (c) Cd 3d spectrum, (d) Fe 2p spectrum and (e) La 3d spectrum. | ||
3.2. Photocatalytic degradation of dyes
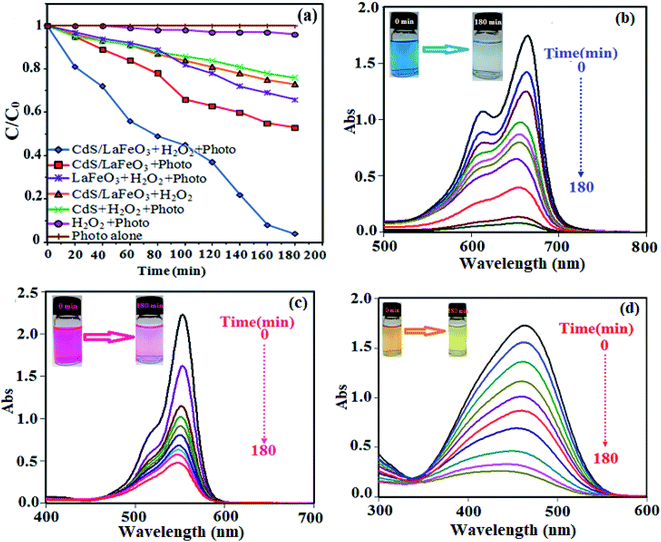
The photocatalytic performance of CdS NRs/LFO nanocomposite was investigated for degradation of organic dyes irradiated with visible light. A series of experiments were carried out to investigate the MB dye degradation under different conditions, and the results are presented in Fig. 10(a). As can be seen, the ability of photo alone or H2O2/photo for degrading MB was negligible. In the control experiments, no degradation of MB was observed in the absence of photocatalyst, indicating that MB was stable and did not undergo a photolytic process. The degradation efficiency of MB by H2O2 and in the absence of catalyst was about 4% within 180 min of irradiation, which can be attributed to slight production of hydroxyl radicals through direct photo decomposition of H2O2. Furthermore, the degradation efficiencies of MB with the CdS NRs/H2O2/photo, CdS NRs/LFO/H2O2/(in dark), LFO/H2O2/photo, and CdS NRs/LFO/photo systems were 23%, 26%, 33%, and 46%, respectively. It is noted that the MB dye is degraded by CdS NRs/LFO/H2O2 system in dark and the initial absorbance decreased about 26% under this condition. This weak degradation had occurred after maintaining the suspension in the dark for 3 h to establish an adsorption–desorption equilibrium when H2O2 was present. It is interesting to note that some perovskite-type Fe-based materials have been confirmed as heterogeneous Fenton-like catalysts.57–59 Then, perovskite-type LaFeO3 (LFO) in the CdS NRs/LFO is probably acting as heterogeneous Fenton-like catalyst. When H2O2 was introduced into the reaction suspension, the interfacial Fe atoms of LFO nanoparticles (denoted as FeIII) could react with H2O2 to form ·OH radicals through Fenton-like reaction, leading to the degradation of organic dyes in dark.60 The main Fenton-like process in dark could be depicted as below (eqn (2)–(4)):| FeIII + H2O2 → FeII + ·OOH + H+ | (2) |
| FeIII + ·OOH → FeII + O2 + H+ | (3) |
| FeII + H2O2 → FeIII + ·OH + OH− | (4) |
However, under visible-light illumination, an obvious enhancement in the efficiency of MB degradation by CdS NRs/LFO/H2O2 system was observed and 97.5% of dye is degraded after 3 h. The above results confirmed that visible light, H2O2, and CdS NRs/LFO binary nanocomposite are essential elements for efficient degradation of MB. Fig. 10(b) shows the change in the absorption spectrum of MB as a function of irradiation time. In the presence of photocatalyst and H2O2, the intensity of the characteristic absorption peak of MB at 664 nm decreased gradually with time and it approximately disappeared after 3 h. Similar behaviors were observed for the RhB and MO dyes. As shown in Fig. 10(c) and (d), the characteristic absorption peaks of RhB and MO at 554 nm and 463 nm, respectively, decrease as time increases.
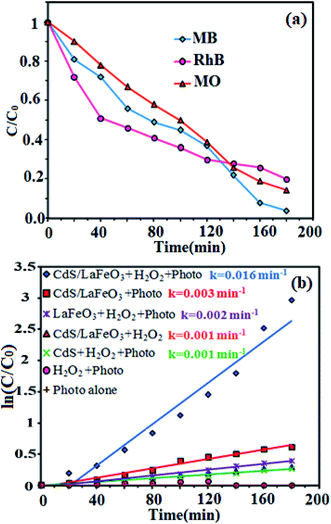
The degradation rates (C/C0) of dyes as a function of irradiation time are compared in Fig. 11(a). After irradiation for 180 min, the degradation percentages were 97.5% for MB, 80% for RhB, and 85% for MO. The degradation kinetics of MB dye was also investigated through the rate constant (k) for a better comparison of the photocatalytic efficiency of the samples. Then, to estimate the rate of the reaction in the photodegradation experiments, the pseudo-first-order equation was used:61 ln(C0/C) = kt, where C0 and C are the dye concentrations before and after irradiation, respectively, k is the pseudo-first-order rate constant, and t is the reaction time. The calculated photocatalytic reaction rate constants (k) in this work are displayed in Fig. 11(b). The rate constant k in different systems increased in the order of CdS NRs/H2O2/photo (0.001 min−1) < LFO/H2O2/photo (0.002 min−1) < CdS NRs/LFO/photo (0.003 min−1) < CdS NRs/LFO/H2O2/photo (0.016 min−1). Among them, CdS NRs/LFO/H2O2/photo system represents the best catalytic performance (97.5% within 3 h) with a rate constant of 0.016 min−1, which is improved by more than 16 and 8 times (k = 0.016 min−1) compared to pure CdS (k = 0.001 min−1) and pristine LFO (k = 0.002 min−1), respectively. Pristine CdS and pure LFO exhibit poor photocatalytic activities, and only 46% and 33% of MB are removed within 3 h of irradiation, respectively, which result from the rapid recombination of photoexcited charges. Once CdS particles are hybridized with LFO, the photodegradation rate for the composites prominently increases.
| EVB = χ − Ee + 0.5Eg | (5) |
| ECB = EVB − Eg | (6) |
| CdS NRs/LFO + visible light → CdS NRs (hVB+) + LFO (eCB−) | (7) |
| H2O2 + eCB− → ·OH + OH− | (8) |
| MB dye + ·OH or hVB+ → CO2 + SO42− + NO3− + NH4+ + Cl− + H2O | (9) |
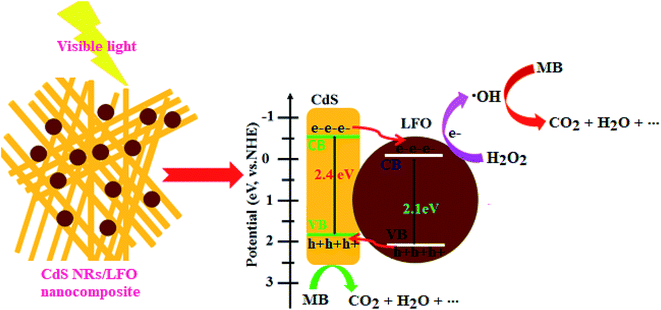 | ||
| Fig. 13 Schematic diagram of the charge separation and possible photocatalytic degradation mechanism for CdS NRs/LFO heterojunction under visible light irradiation. | ||
The overall degradation process of MB dye over the CdS NRs/LFO nanocomposite photocatalyst and under visible light irradiation can be written as follows (eqn (10)):
| MB dye (C16H18ClN3S) + H2O2 → CO2 + SO42− + NO3− + NH4+ + Cl− + H2O | (10) |
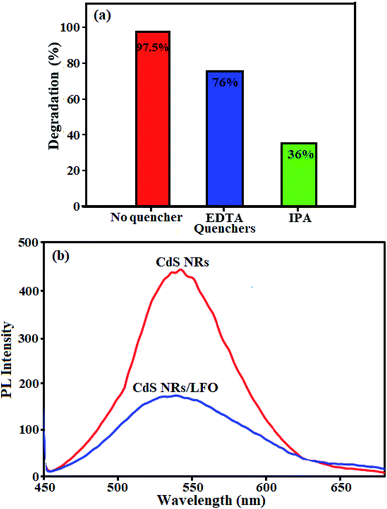 | ||
| Fig. 14 (a) Quenching tests with and without quenching agents, and (b) Photoluminescence (PL) spectra of pure CdS NRs and CdS NRs/LFO nanocomposite. | ||
The migration and separation efficiency of photo-generated charge carriers between the two semiconductors in the nanocomposite were extensively investigated by photoluminescence (PL) spectroscopy.70–79 PL spectroscopy is a useful technique to survey the separation efficiency of the photogenerated electron–hole pairs in semiconductors because the electron–hole recombination's in semiconductors are mainly responsible for PL emissions.80,81 Actually, the PL emission is a mainly consequence of the recombination of photoexcited electron–hole pairs, and a lower PL intensity indicates a lower recombination rate of photoexcited electron–hole pairs.82–85 PL spectra are presented in Fig. 14(b) for pure CdS and the CdS NRs/LFO composite. A main emission peak was observed at about 540 nm for the pure CdS which was attributed to fast recombination of electron–hole pairs in the CdS material.86,87 The intensity of this emission peak significantly decreased upon LFO loading, but the fluorescence emission peak position did not change. This indicated that the recombination of the photo-excited electrons and holes was greatly reduced by coupling the CdS and LFO. As we known, intensity of the PL spectrum of a semiconductor mainly results from the recombination of electrons–holes pairs. Hence, there is a strong correlation between PL emission intensity and separation of the photo-generated charge carriers.88 For this reason, the weakened emission intensity in CdS NRs/LFO nanocomposite indicates inhibition of electron–hole recombination due to the co-catalytic effect of LFO, which lengthens the lifetime of charge carriers and is beneficial for the improvement of photocatalytic activity.
4. Conclusions
In summary, a novel p–n CdS NRs/LFO heterojunction composite was successfully synthesized by coupling CdS with LFO and used as a visible light photocatalyst for the degradation of organic dyes. Compared with the pristine CdS and bare LFO, the CdS NRs/LFO sample demonstrated much higher photocatalytic activity. The superior photocatalytic activity and stability of this composite were attributed to the formation of the heterojunction structure, effectively promoting the separation of photogenerated electron–hole pairs in agreement with the results of PL. Furthermore, the cycling experiments revealed the good stability of CdS NRs/LFO composite. Besides, the study on the photocatalytic mechanism of the CdS NRs/LFO heterojunction shows that ·OH radicals and hVB+ are the participants for the degradation process of dyes. The synergistic interactions between the LFO and CdS provide a robust and novel method for combining two visible light photocatalysts to expand their visible light absorption. Meanwhile, this study provides some new insights into the design and fabrication of advanced catalysts with p–n heterojunction structures toward highly-efficient photocatalytic applications in organic pollution treatment under visible light irradiation.Conflicts of interest
There are no conflicts of interest to declare.Acknowledgements
The authors gratefully acknowledge the Lorestan University and Iran Nanotechnology Initiative Council (INIC) for their financial support.References
- A. Turki, C. Guillard, F. Dappozze, Z. Ksibi, G. Berhault and H. Kochkar, Appl. Catal., B, 2015, 163, 404–414 CrossRef CAS.
- R. Saraf, C. Shivakumara, S. Behera, H. Nagabhushana and N. Dhananjaya, Spectrochim. Acta, Part A, 2015, 136, 348–355 CrossRef CAS PubMed.
- F. Siadatnasab, S. Farhadi and A. Khataee, Ultrason. Sonochem., 2018, 44, 359–367 CrossRef CAS PubMed.
- J. Yan, K. Wang, H. Xu, J. Qian, W. Liu, X. Yang and H. Li, Chin. J. Catal., 2013, 34, 1876–1882 CrossRef CAS.
- M. Sheydaei and A. Khataee, Ultrason. Sonochem., 2015, 27, 616–622 CrossRef CAS PubMed.
- J. Fu, Z. Chen, M. Wang, S. Liu, J. Zhang, J. Zhang, R. Han and Q. Xu, Chem. Eng. J., 2015, 259, 53–61 CrossRef CAS.
- R. D. C. Soltani, A. Rezaee, A. Khataee and M. Safari, J. Colloid Interface Sci., 2014, 20, 1861–1868 CAS.
- S. Farhadi, F. Siadatnasab and A. Khataee, Ultrason. Sonochem., 2017, 37, 298–309 CrossRef CAS PubMed.
- S. Li, K. Yu, Y. Wang, Z. Zhang, C. Song, H. Yin, Q. Ren and Z. Zhu, CrystEngComm, 2013, 15, 1753–1761 RSC.
- S. Cao, J. Low, J. Yu and M. Jaroniec, Adv. Mater., 2015, 27, 2150–2176 CrossRef CAS PubMed.
- M. Carrier, N. Perol, J.-M. Herrmann, C. Bordes, S. Horikoshi, J. O. Paisse, R. Baudot and C. Guillard, Appl. Catal., B, 2006, 65, 11–20 CrossRef CAS.
- S. Ahmed, M. Rasul, W. N. Martens, R. Brown and M. Hashib, Desalination, 2010, 261, 3–18 CrossRef CAS.
- E. Abroshan, S. Farhadi and A. Zabardasti, Sol. Energy Mater. Sol. Cells, 2018, 178, 154–163 CrossRef CAS.
- W. Zhang, B. S. Naidu, J. Z. Ou, A. P. O'Mullane, A. F. Chrimes, B. J. Carey, Y. Wang, S. Y. Tang, V. Sivan, A. Mitchell, S. K. Bhargava and K. Kalantar-zadeh, ACS Appl. Mater. Interfaces, 2015, 7, 1943–1948 CrossRef CAS PubMed.
- B. S. Naidu, U. Gupta, U. Maitra and C. N. R. Rao, Chem. Phys. Lett., 2014, 591, 277–281 CrossRef CAS.
- J. Yu, J. Low, W. Xiao, P. Zhou and M. Jaroniec, J. Am. Chem. Soc., 2014, 136, 8839–8842 CrossRef CAS PubMed.
- X. Wang, M. Liao, Y. Zhong, J. Y. Zheng, W. Tian, T. Zhai, C. Zhi, Y. Ma, J. Yao and Y. Bando, Adv. Mater., 2012, 24, 3421–3425 CrossRef CAS PubMed.
- S. Farhadi and F. Siadatnasab, Chin. J. Catal., 2016, 37, 1487–1495 CrossRef CAS.
- P. Gao, J. Liu, D. D. Sun and W. Ng, J. Hazard. Mater., 2013, 250, 412–420 Search PubMed.
- R. K. Chava, J. Y. Do and M. Kang, Appl. Surf. Sci., 2018, 433, 240–248 CrossRef CAS.
- Q. Cai, Z. Hu, Q. Zhang, B. Li and Z. Shen, Appl. Surf. Sci., 2017, 403, 151–158 CrossRef CAS.
- W. Jiang, Y. Liu, R. Zong, Z. Li, W. Yao and Y. Zhu, J. Mater. Chem. A, 2015, 3, 18406–18412 RSC.
- Z. Y. Zhang, C. L. Shao, X. H. Li, C. H. Wang, M. Y. Zhang and Y. C. Liu, ACS. Appl. Mater. Interfaces, 2010, 2, 2915–2923 CrossRef CAS PubMed.
- J. Hu, Z. X. Zhong, F. Zhang, W. H. Xing, W. Q. Jin and N. P. Xu, Ind. Eng. Chem. Res., 2016, 55, 6661–6670 CrossRef CAS.
- Y. H. Ao, K. D. Wang, P. F. Wang, C. Wang and J. Hou, Appl. Catal., B, 2016, 157, 168–194 Search PubMed.
- M. Tyagi, M. Tomar and V. Gupta, J. Mater. Chem. C, 2014, 2, 2387–2393 RSC.
- F. Schuster, B. Laumer, R. R. Zamani, C. Magen, J. R. Morante, J. Arbiol and M. Stutzmann, ACS Nano, 2014, 8, 4376–4384 CrossRef CAS PubMed.
- Q. X. Zhang and J. M. Cao, RSC Adv., 2015, 5, 107957–107963 RSC.
- P. Gao, J. C. Liu and D. D. Sun, J. Hazard. Mater., 2013, 250, 412–420 CrossRef PubMed.
- Y. Feng, X. Yan and C. B. H. Liu, Appl. Surf. Sci., 2015, 353, 87–94 CrossRef CAS.
- L. Geand and J. E. Liu, Appl. Catal., B, 2011, 105, 289–297 CrossRef.
- Y. Cui, Chin. J. Catal., 2015, 36, 372–379 CrossRef CAS.
- Y. Ao, L. Xu, P. Wang, C. Wang, J. Hou and J. Qian, Dalton Trans., 2015, 44, 11321–11330 RSC.
- P. Xiong, J. Zhu and X. Wang, Ind. Eng. Chem. Res., 2013, 52, 17126–17133 CrossRef CAS.
- L. Zou, H. Wang, G. Yuan and X. Wang, ACS Appl. Nano Mater., 2018, 1, 831–838 CrossRef CAS.
- C. Singh, R. Malik, V. Kumar and S. Singhal, RSC Adv., 2015, 5, 89327–89337 RSC.
- R. K. Chava, J. Y. Do and M. Kang, Appl. Surf. Sci., 2018, 433, 240–248 CrossRef CAS.
- Q. Yu, X. Meng, T. Wang, P. Li, L. Liu, K. Chang, G. Liu and J. Ye, Chem. Commun., 2015, 51, 3630 RSC.
- K. Xu and J. Feng, RSC Adv., 2017, 7, 45369–45376 RSC.
- J. Yang, R. Hu, W. Meng and Y. Du, Chem. Commun., 2016, 52, 2620–2623 RSC.
- Q. Zhang, Y. Huanga, S. Peng, Y. Zhang, Z. Shen, J. J. Cao, W. Ho, S. C. Lee and D. Y. H. Puifakey, Appl. Catal., B, 2017, 204, 346–357 CrossRef CAS.
- R. D. Kumar, R. Thangappan and R. Jayavel, J. Phys. Chem. Solids, 2017, 101, 25–33 CrossRef.
- K. Xu, H. Xu, G. Feng and J. Feng, New J. Chem., 2017, 41, 14602–14609 RSC.
- X. Ren, H. Yang, S. Gen, J. Zhou, T. Yang, X. Zhang, Z. Cheng and S. Sun, Nanoscale, 2016, 8, 752–756 RSC.
- S. Farhadi, M. M. Amini and F. Mahmoudi, RSC Adv., 2016, 6, 102984–102996 RSC.
- B. M. Pirzada, P. Pushpendra, R. K. Kunchala and B. S. Naidu, ACS Omega, 2019, 4, 2618–2629 CrossRef CAS.
- S. Farhadi and F. Siadatnasab, J. Mol. Catal. A: Chem., 2011, 339, 108–116 CrossRef CAS.
- R. P. Bagwe and K. C. Khilar, Langmuir, 2000, 16, 905–910 CrossRef CAS.
- C. Zhao, G. Tan, J. Huang, W. Yang, H. Ren and A. Xia, ACS Appl. Mater. Interfaces, 2015, 7, 23949–23957 CrossRef CAS PubMed.
- K. K. Senapati, C. Borgohain and P. Phukan, Catal. Sci. Technol., 2012, 2, 2361–2366 RSC.
- S. Thirumalairajan, K. Girija, V. R. Mastelaro and N. Ponpandian, New J. Chem., 2014, 38, 5480–5490 RSC.
- N. Ertugay and F. N. Acar, Appl. Surf. Sci., 2014, 318, 121–126 CrossRef CAS.
- Y. Huang, Y. Chen, C. Hu, B. Zhang, T. Shen, X. Chen and M. Q. Zhang, J. Mater. Chem., 2012, 22, 10999–11002 RSC.
- J. He, L. Chen, F. Wang, Y. Liu, P. Chen, C. T. Au and S. F. Yin, ChemSusChem, 2016, 9, 624–630 CrossRef CAS PubMed.
- L. Ge, F. Zuo, J. Liu, Q. Ma, C. Wang, D. Sun, L. Bartels and P. Feng, J. Phys. Chem. C, 2012, 116, 13708–13714 CrossRef CAS.
- H. Su, L. Jing, K. Shi, C. Yao and H. Fu, J. Nanopart. Res., 2010, 12, 967–975 CrossRef CAS.
- L. L. Ju, Z. Y. Chen, L. Fang, W. Dong, F. G. Zheng and M. R. Shen, J. Am. Ceram. Soc., 2011, 10, 3418–3424 CrossRef.
- W. Luo, L. H. Zhu, N. Wang, H. Q. Tang, M. J. Cao and Y. B. She, Environ. Sci. Technol., 2010, 44, 1786–1791 CrossRef CAS PubMed.
- L. Li and X. Wang, J. Sol-Gel Sci. Technol., 2016, 79, 107–113 CrossRef CAS.
- H. C. Lan, A. M. Wang, R. P. Liu, H. J. Liu and J. H. Qu, J. Hazard. Mater., 2015, 285, 167–172 CrossRef CAS PubMed.
- S. Farhadi and F. Siadatnasab, Mater. Res. Bull., 2016, 83, 345–353 CrossRef CAS.
- R. Liang, S. Luo, F. Jing, L. Shen, N. Qin and L. Wu, Appl. Catal., B, 2015, 176, 240–248 CrossRef.
- N. Z. Bao, L. M. Shen, T. S. Takata and K. Domen, Chem. Mater., 2008, 20, 110–117 CrossRef CAS.
- F. Akbal, Environ. Prog., 2005, 24, 317–322 CrossRef CAS.
- N. Guettaï and H. Ait Amar, Desalination, 2005, 185, 427–437 CrossRef.
- M. R. Gholipour, C. T. Dhin and T. O. Do, Nanoscale, 2015, 7, 8187–8208 RSC.
- W. J. Li, D. Z. Li, J. X. Wang, Y. Shao, J. M. You and F. Teng, J. Mol. Catal. A: Chem., 2013, 380, 10–17 CrossRef CAS.
- Y. Chen, G. Tian, Y. Shi, Y. Xiao and H. Fu, Appl. Catal., B, 2015, 164, 40–47 CrossRef CAS.
- X. K. Li, N. Kikugawa and J. H. Ye, Adv. Mater., 2008, 20, 3816–3819 CrossRef CAS.
- H. Y. Ji, X. C. Jing, Y. G. Xu, J. Yan, H. P. Li, Y. P. Li, L. Y. Huang, Q. Zhang, H. Xu and H. M. Li, RSC Adv., 2015, 5, 57960–57967 RSC.
- J. Zeng, T. Song, M. X. Lv, T. T. Wang, J. Y. Qin and H. P. Zeng, RSC Adv., 2016, 6, 54964–54975 RSC.
- D. D. Lv, D. F. Zhang, X. Y. Liu, Z. G. Liu, L. Y. Hu, X. P. Pu, H. Y. Ma and D. C. Li, Sep. Purif. Technol., 2016, 158, 302–307 CrossRef CAS.
- P. Xiong, Y. S. Fu, L. J. Wang and X. Wang, J. Chem. Eng., 2012, 195–196, 149–157 CrossRef CAS.
- H. Y. Zhu, R. Jiang, Y. Q. Fu, R. R. Li, J. Yao and S. T. Jiang, Appl. Surf. Sci., 2016, 369, 1–10 CrossRef CAS.
- L. Zhang and W. L. Jiao, J. Alloys Compd., 2013, 581, 11–15 CrossRef CAS.
- J. Zhou, L. Yin, K. Zha, H. R. Li, Z. Y. Liu, J. X. Wang, K. Duan and B. Feng, Appl. Surf. Sci., 2016, 367, 118–125 CrossRef CAS.
- M. N. Ha, F. Zhu, Z. F. Liu, L. C. Wang, L. Y. Liu, G. Z. Lu and Z. Zhao, RSC Adv., 2016, 6, 21111–21118 RSC.
- D. Yang, Y. Y. Sun, Z. W. Tong, Y. H. Nan and Z. Y. Jiang, J. Hazard. Mater., 2016, 312, 45–54 CrossRef CAS PubMed.
- O. Ruzimuradov, M. Hojamberdiev, C. Fasel and R. Riedel, J. Alloys Compd., 2017, 699, 144–150 CrossRef CAS.
- D. Wang, G. Xue, Y. Zhen, F. Fub and D. Li, J. Mater. Chem., 2012, 22, 4751–4758 RSC.
- D. Wang, L. Guo, Y. Zhen, L. Yue, G. Xue and F. Fu, J. Mater. Chem. A, 2014, 2, 11716–11727 RSC.
- Y. J. Yuan, D. Q. Chen, Y. W. Huang, Z. T. Yu, J. S. Zhong, T. T. Chen, W. G. Tu, Z. J. Guan, D. P. Cao and Z. G. Zou, ChemSusChem, 2016, 9, 1003–1009 CrossRef CAS.
- T. H. Yu, W. Y. Cheng, K. J. Chao and S. Y. Lu, Nanoscale, 2013, 5, 7356–7360 RSC.
- Y. Xia, Z. He, Y. Lu, B. Tang, S. Sun, J. Su and X. Li, RSC Adv., 2018, 8, 5441–5450 RSC.
- Y. Jin, X. Shen, Z. Liu, Z. Wang, B. Zhu, P. Xu, L. Luo and L. Zhang, New J. Chem., 2018, 42, 411–419 RSC.
- S. W. Zhang, H. C. Yang, H. H. Gao, R. Cao, J. Z. Huang and X. J. Xu, ACS Appl. Mater. Interfaces, 2017, 9, 23635–23646 CrossRef CAS PubMed.
- W. Cui, W. An, L. Liu, J. Hu and Y. Liang, Appl. Surf. Sci., 2014, 319, 298–305 CrossRef CAS.
- Y. Xia, Z. He, J. Su, B. Tang, K. Hu, Y. Lu, S. Sun and X. Li, RSC Adv., 2018, 8, 4284–4294 RSC.
| This journal is © The Royal Society of Chemistry 2019 |

