
 Open Access Article
 This Open Access Article is licensed under a
 Creative Commons Attribution 3.0 Unported Licence
Pluronic F127 self-assembled MoS2 nanocomposites as an effective glutathione responsive anticancer drug delivery system
Adhisankar Vadivelmurugana,
Rajeshkumar Anbazhaganab,
Vinothini Arunagiria,
Juin-Yih Laiabc and
Hsieh-Chih Tsai *ab
*ab
aGraduate Institute of Applied Science and Technology, National Taiwan University of Science and Technology, Taipei 106, Taiwan. E-mail: h.c.tsai@mail.ntust.edu.tw; Tel: +886-2-27303625
bAdvanced Membrane Materials Center, National Taiwan University of Science and Technology, Taipei 106, Taiwan
cR&D Center for Membrane Technology, Chung Yuan Christian University, Chungli, Taoyuan 320, Taiwan
First published on 15th August 2019
Abstract
In this study, bio-responsive polymeric MoS2 nanocomposites were prepared for use as a drug carrier for cancer therapy. Herein, we report the synthesis and demonstrate the self-assembly of pluronic F127 (PF127) on a cystamine–glutathione–MoS2 (CYS–GSH–MoS2) system, which can be used for GSH-triggered drug release under biological reducing conditions. The reduction-sensitive disulfide bond containing CYS was incorporated between the amphiphilic copolymer PF127 and GSH–MoS2 to achieve feasible drug release. Percent drug loading capacity and encapsulation efficiency were 51.3% and 56%, respectively. In addition, when the MoS2–GSH–CYS–PF127 nanocomposite was incubated in a GSH environment, the morphology of the nanocomposite tended to change, ultimately leading to drug release. The drug-loaded PF127–CYS–GSH–MoS2 polymeric nanocomposites efficiently released 52% of their drug content after 72 h of incubation in a GSH reduction environment. The HeLa cells treated with DOX loaded MoS2–GSH–CYS–PF127 showed 38% toxicity at drug concentration of 40 μg, which indicated that the successfully released of drug from carrier and caused the cell death. Further, fluorescence microscopy images of HeLa cells revealed the potential behavior of the MoS2–GSH–CYS–PF12 nanocomposite during the 2- and 4 h incubation periods; the nanocomposite was only found in the cytoplasm of HeLa cells. Interestingly, after 6 h of incubation, the drug was slowly released from the nanocomposite and could enter the nucleus as confirmed by fluorescence imaging of HeLa cells. Altogether, our synthesized PF127-coated MoS2 nanocomposite could be effectively adopted in the near future as a GSH-sensitive drug carrier.
1. Introduction
In the past decade, there has been a growing interest for the construction of a remarkable reduction-responsive drug delivery system (DDS).1 Recently, various biomolecules and DDSs have been synthesized as stimuli-responsive nanocarriers toward light, pH, magnetic field, ultrasound, and redox potential by changing their surrounding environment. For example, Kim et al. reported that by changing the physicochemical properties of their delivery systems to cleave the disulphide linkage in the carrier to deliver the gene, the systems could be utilized to perform effective delivery and control cargo release at the target site.2 In gene delivery systems, stimuli-responsive carriers have shown great potential by overcoming many obstacles in cellular gene delivery such as cellular uptake, escape from endosomes, and cargo release of biomolecules at the targeted intracellular location.3,4 Generally, researchers have focused on multifunctional stimuli-responsive nanocarriers that can release drugs in response to internal or external stimuli such as pH,5 redox,6 temperature,7 enzyme,8–10 magnetic, and light11–16 in the environment. Such nanocarriers have recently been engineered as smart DDS.17 Simultaneous exposure to inherent or external stimuli-sensitive DDS activates activities that regulate drug release or adequately facilitate intracellular uptake or diffusion.18 Moreover, drug release following administration may be achieved via structurally modifying the microcontroller class of DDS transporting the drug or breaking down the chemical components of the nanocarrier. The unique biochemistry of various engineered stimuli-sensitive DDS under specific conditions can result in specific temporal and spatial DDSs.19–21 Nanocarriers are commonly designed to respond to a single external stimuli that activates drug release.22,23 Usually, these include intracellular GSH,24–27 ROS,28,29 and lysosomal activity.30 For GSH-triggered drug release, GSH acts as a reducing agent in the intracellular region by cleaving the sensitive disulfide bond in the nanocarrier to initiate drug release. The intracellular concentration of GSH is approximately 0.5 to 10 mM.31 Hence, such concentration can be attained in an in vitro study without difficulty as a GSH-rich cancer cell environment triggers drug release.32,33Two-D nanomaterials have uniquely been considered for biomedical application due to their outstanding electronic, physical, and chemical properties.34 As the large surface area of 2D nanomaterials provides adequate area for loading responsive cargo biomolecules, they are favorable materials for stimuli-responsive biomedical applications.35 In particular, MoS2, WS2, MoSe2, and WSe2 have been studied as a replacement for graphene due to some limitations of graphene such as loss of its native properties when exfoliated using n-butyllithium (n-BuLi) method, zero band gap, structural defects and so on.36–40 As molybdenum (Mo) is an essential element for individual enzymes in cells and S is a universal biological element,41,42 MoS2 was recently examined to elucidate its potential biomedical applications. Functionalization of the MoS2 surface is simple and easy because of the readily available sulfur vacancy on MoS2.43 The biological applications of MoS2-based nanocarriers have also been studied in a variety of therapeutic and diagnostic applications such as bioimaging, drug delivery, gene delivery, phototherapy, combined therapy, theranostic, and biosensing. However, limitations and drawbacks were found in the reported study. An analysis of some future aspects for the long-term development of MoS2-based nanocomposites as a potential nanomedicine has highlighted its limits.44 Most of the recent studies on MoS2 focused on its therapeutic application to mainly target tumors via passive release of drug molecules. A stimuli-responsive nanocarrier system with MoS2 is therefore essential to achieve an on-demand DDS.45
In this study, a GSH-responsive MoS2–GSH–CYS–PF127 nanocomposite was prepared for effective drug delivery in a GSH-rich environment. To prepare these nanocomposites, MoS2 was first exfoliated using GSH as a surfactant via sonication and this was followed by the addition of a disulfide-containing CYS. Finally, PF127 was introduced to derive the GSH-responsive MoS2–GSH–CYS–PF127 nanocomposite. The tailored MoS2 nanocomposite system exhibited sensitivity in the GSH environment as confirmed by TEM and DLS. To further evaluate the GSH-sensitive property of the MoS2 nanocomposite, the anticancer drug, doxorubicin (DOX), was loaded onto the carrier and its release in a GSH environment was assessed. This GSH reduction-responsive drug release assessment was performed with phosphate buffer pH = 7.4 and GSH = 5 mM. We found that 52% of the drug was released after 72 h. Subsequently, fluorescence microscopic images revealed that a 6 h incubation of the MoS2 nanocomposite in HeLa cells effectively killed the cells relative to the 2 h and 4 h periods. To add, the images revealed that the nanocomposite was located in the cell membrane alone. Therefore, this MoS2 nanocarrier opens a window for its use as a stimuli-responsive nanocarrier for drug delivery (Fig. 1).
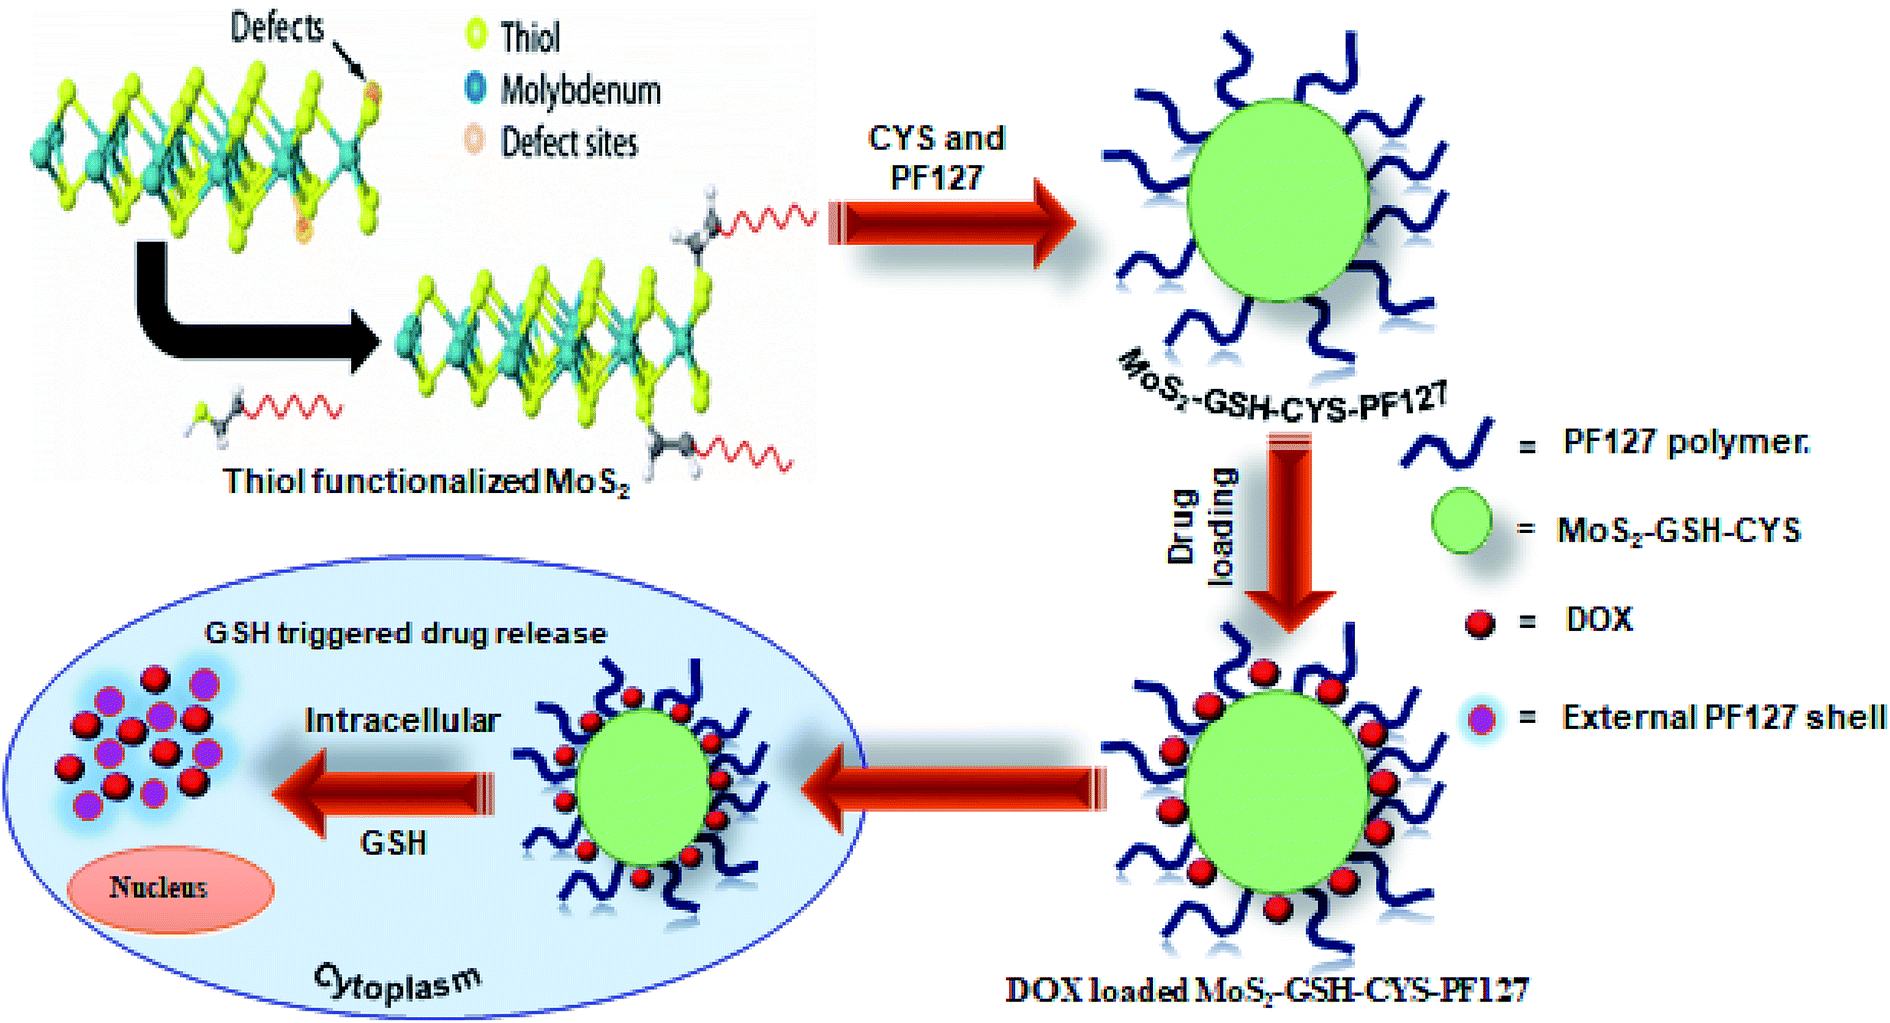 | ||
| Fig. 1 Schematic illustration of the preparation of DOX-loaded MoS2–GSH–CYS–PF127 nanocomposites for reduction-sensitive intracellular nucleus drug release. | ||
2. Experimental section
2.1. Materials
MoS2 (10–30 μm) was purchased from Rose Mill Company, reduced L-glutathione (GSH), cystamine dihydrochloride (CYS), 3-(4,5-dimethylthiazol-2-yl)-2,5-diphenyltetrazolium bromide (MTT), pluronic F127 (PF127) and biological water were acquired from Sigma-Aldrich. Phosphotungstic acid N-hydrate (PTA) were purchased from J.T. Baker, (India), doxorubicin hydrochloride (DOX) were purchased from Cayman Chemical Company (USA), anhydrous dimethyl sulfoxide was obtained from Macron Fine Chemicals. Dulbecco's Modified Eagle Medium (DMEM), penicillin, sodium pyruvate, trypsin and sterilized fetal bovine serum (FBS), were purchased from Gibco (Carlsbad, CA). Human cervical carcinoma (HeLa) cells were obtained from the Bio Resource Collection and Research Center (Hsinchu, Taiwan). Regenerated cellulose tubular membrane with a nominal value of 1000 and 6000–8000 Da was purchased from Orange Scientific. Unless otherwise noted, all other reagents and solvents were obtained from Sigma-Aldrich, Alfa-Aesar, and TCI chemicals. Other reagents, and buffer solution components were of analytical grade. Distilled and deionized water (DI) were used in all experiments. All solutions and reagents were used without further purification.2.2. Characterization of MoS2–GSH–CYS–PF127 and DOX-loaded MoS2–GSH–CYS–PF127
Transmission electron microscopy (HR-TEM) images were obtained with a Tecnai-F20 FEI-TEM system. Ten μL of the sample solution was placed on a 300 mesh carbon-stabilized, formvar-carbon-coated grid. Following a 2 min adsorption, the sample was washed with distilled water and air-dried. Each grid was then stained with 0.2% (w/v) PTA for 2 min. Excess staining solution was removed, and the sample was allowed to air-dry. After complete drying, grids were observed using HR-TEM and photographed with a CCD camera.UV-visible images were captured with a Jasco V-730 spectrofluorometer. Particle size and zeta potential of the prepared DOX-loaded nanocomposites were determined by dynamic light scattering (DLS) and their zeta potential was also measured using a zeta potential analyzer. Data are presented as the average of three measurements. The amount of DOX in DOX-loaded MoS2–GSH–CYS–PF127 composites was determined by UV-visible spectroscopy using Jasco V-730 spectrofluorometer.
2.3. Preparation of MoS2–GSH nanoparticles
Eight hundred mg of MoS2 and 800 mg of L-GSH (1–1 ratio) were added to 40 mL of dimethyl sulfoxide (DMSO) and probe sonicated for 8–10 h with power density of 650 W. After sonication, the resulting greenish-black solution was allowed to settle for 24 h. After 24 h, centrifugation was conducted to remove the unexfoliated MoS2 nanoparticles. The supernatant was collected and dialysis was performed using a 1000 Da-membrane for 4 h to remove excess ligand. Moreover, the anhydrous DMSO assisted MoS2 shows good exfoliation with long-term stability. In addition, many researchers revealed that anhydrous DMSO assisted exfoliation can provide effective method to obtained single and few-layer MoS2 sheets.46,47 After sonication, the resulting greenish-black solution was allowed to settle for 24 h. After 24 h, centrifugation was conducted to remove the unexfoliated MoS2 nanoparticles. The supernatant was collected and dialysis was performed using a 1000 Da-membrane for 4 h to remove excess ligand.2.4. Preparation of MoS2–GSH–CYS–PF127 nanocomposite
Twenty mg of CYS and PF127 were added to 5 mL of MoS2–GSH nanoparticle solution. The nanocomposite was formed during dialysis and this was allowed to proceed to remove excess CYS. Prior to the preparation of the MoS2–GSH–CYS–PF127 nanocomposite, MoS2–GSH–PF127 and MoS2–GSH–CYS were synthesized via simple procedures. Twenty milligrams of PF127 was then added to 10 mL of MoS2–GSH nanoparticle solution during dialysis to prepare MoS2–GSH–PF127. Meanwhile, 20 mg of CYS was added to 10 mL of MoS2–GSH nanoparticle solution during dialysis to prepare MoS2–GSH–CYS.2.5. Drug loading
The anticancer drug, DOX, was loaded into multifunctional nanocarriers. Briefly, 50 mg of MoS2–GSH–CYS–PF127 was added to 50 mL of PBS and 5 mL of DOX solution (5 mg dissolved in 5 mL of DMSO) via an ultrasonic bath. The mixture was sealed and stirred for 24 h in the dark at room temperature. Thereafter, the DOX-loaded nanocomposite was dialyzed against PBS to remove unbound DOX molecules.2.6. Drug release experiment in a reduction-sensitive environment
The in vitro reduction-sensitive release behavior of the drug was investigated by placing the DOX-loaded MoS2–GSH–CYS–PF127 nanocomposite (1.5 mL) in a dialysis bag. The dialysis bag was soaked in 15 mL of PBS with or without 5 mM GSH and placed on shaker set at 37 °C and 180 rpm. At predetermined time intervals, 3 mL of the sample solution was removed and replaced with fresh PBS solution. For reduction-sensitive drug release, an equivalent amount of fresh PBS containing 5 mM GSH was continuously supplemented for 3 days. The amount of cumulative drug release (DOX) was measured via absorption at a wavelength of 480 nm.2.7. GSH-responsiveness of DOX-loaded MoS2–GSH–CYS–PF127 nanocomposites
The GSH-responsive behavior of DOX-loaded MoS2–GSH–CYS–PF127 nanocomposites was investigated in the presence of 5 mM GSH and PBS buffer by DLS. Briefly, GSH (5 mM) was mixed with DOX-loaded MoS2–GSH–CYS–PF127 nanocomposites in different environments. The solution was then incubated on a shaking table at 37 °C and changes in size of the nanocomposites were investigated at different time intervals by DLS.2.8. MTT assay
HeLa cell line was cultured at density of 2 × 10⁴ in a 96-well plate and maintained in DMEM (Wisent Inc., USA) supplemented with 10% fetal bovine serum (Wisent Inc.) and 1% sodium pyruvate (Wisent Inc.) at 37 °C in a humidified atmosphere with 5% CO2. After a 24 h incubation, the cells were exposed to 200 μg mL−1 to 6.25 μg mL−1 of MoS2–GSH–CYS–PF127, and 40 μg mL−1 to 1.25 μg mL−1 of free DOX and DOX-loaded MoS2–GSH–CYS–PF127 nanocomposites. After a 24 h incubation in a humidified atmosphere, the old medium was removed and fresh medium with MTT (5 mg mL−1) was added followed by an additional incubation for 2–4 h for cytotoxic evaluation using an ELISA reader.2.9. Cellular uptake and intracellular localization of DOX
HeLa cells were seeded in a confocal dish (35 mm × 10 mm; Corning Inc., New York, USA) at a density of 1 × 10⁵ cells per well and incubated in DMEM for 24 h. Culture medium was removed and fresh DMEM containing free DOX and DOX-loaded MoS2–GSH–CYS–PF127 nanocomposites (5 μg mL−1) were added and incubated for 2 h, 4 h, and 6 h in a humidified atmosphere. The cells were washed three times with PBS to remove excess nanoparticles. DAPI in PBS (100 nanomolar) was added to cells prior to incubation at room temperature for 15 min followed by rinsing with PBS and observation by fluorescence microscopy.3. Results and discussion
3.1. Particle size and zeta potential
In the present study, we aimed to synthesize a GSH-responsive MoS2-based DDS. MoS2 was first exfoliated in DMSO via sonication and this was followed by the introduction of GSH as a surfactant. A disulfide-containing CYS was then introduced followed by PF127 via self-assembly using the dialysis method. The synthesized GSH-responsive nanocarrier system was then examined using a variety of techniques such as UV-visible spectroscopy, TEM, DLS, and zeta potential, and drug release was confirmed by UV-visible spectroscopy and fluorescence microscopy. For MoS2–GSH nanoparticles and MoS2–GSH–CYS, particle size was ∼61.6 nm and ∼110.2 nm, respectively. However, after the formation of the self-assembled PF127 on the surface of MoS2–GSH, the size of the nanocarrier increased to 71.7 nm. Notably, MoS2–GSH had a smaller size before CYS loading; however, after loading, particle size was ∼110.2 nm. The greater particle size might be due to the negative charge of MoS2–GSH which may have allowed a strong electrostatic interaction with the positive group of CYS.48,49 In contrast, PF127 polymer coating reduced the size of the nanocarrier from size of MoS2–GSH–CYS particle from 110.2 nm to 82.3 nm.50,51 Zeta potential values for MoS2–GSH and MoS2–GSH–PF127 were −12.2 mV, and −15.7 mV, respectively. As shown in Table 1, the zeta potential of MoS2–GSH–CYS and MoS2–GSH–CYS–PF127 increased toward positive values of 0.5 mV and 1.7 mV.| System | Size (nm) | Zeta (mV) |
|---|---|---|
| MoS2–GSH | 61.16 | −12.16 |
| MoS2–GSH–PF127 | 71.7 | −15.7 |
| MoS2–GSH–CYS | 110.2 | 0.5 |
| MoS2–GSH–CYS–PF127 | 82.3 | 1.7 |
3.2. UV-visible spectroscopy
The synthesized MoS2 nanocarrier was confirmed by UV-visible spectroscopy and the spectra for MoS2–GSH, MoS2–GSH–PF127, MoS2–GSH–CYS, and MoS2–GSH–CYS–PF127 are shown in Fig. 2. For MoS2–GSH, four characteristic peaks were observed at 669 nm (A), 606 nm (B), 445 nm (C), and 391 nm (D), which agree with the reported values.52 The absorption peaks, namely A and B, were due to direct excitonic transitions at the K-point with energy difference caused by valence band spin–orbital coupling. Peaks C and D were assigned to the direct excitonic transition of the M-points between higher densities of state and region of the band structure. This study confirms the presence of synthesized exfoliated MoS2 samples exhibits 2H MoS2.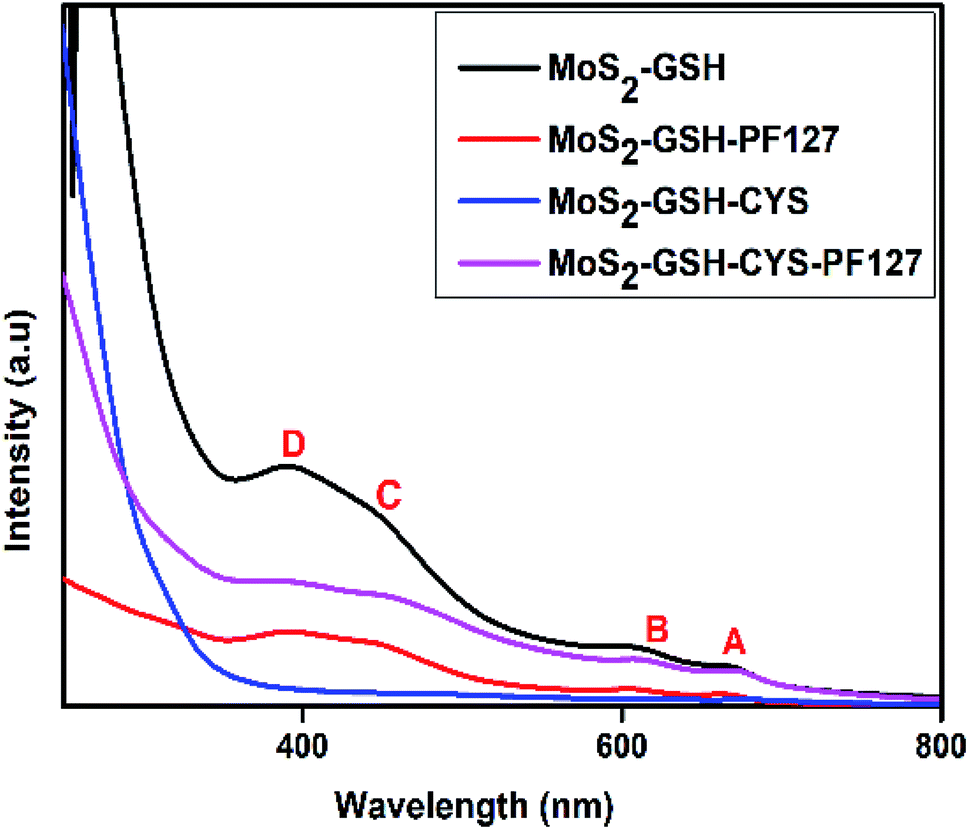 | ||
| Fig. 2 UV-visible spectra of MoS2–GSH, MoS2–GSH–PF127, MoS2–GSH–CYS, MoS2–GSH–CYS, and MoS2–GSH–CYS–PF127. | ||
After PF127 was coated onto the MoS2–GSH system, the wavelength decreased to 664 nm, 605 nm, 444 nm, and 390 nm. As the observed blue shift is usually caused by H-aggregates, this result suggests that the amphiphilic polymer results in dense parallel-aggregates of MoS2 in the core of PF127. The wavelengths depicting the characteristic maximum absorption peaks shifted from 669 nm (A), 606 nm (B), 445 nm (C), and 391 nm (D) to 675 nm, 617 nm, 457 nm, and 397 nm for MoS2–GSH–CYS, and 672 nm, 611 nm, 446 nm, and 395 nm for MoS2–GSH–CYS–PF127. As the observed red shift is usually caused by J aggregates, this result suggests that CYS induce the nanoparticle aggregation of MoS2–GSH and MoS2–GSH–PF127, which also proved in the DLS results (Table 2).49
| UV-excitonic peaks | A (nm) | B (nm) | C (nm) | D (nm) |
|---|---|---|---|---|
| MoS2–GSH | 669 | 606 | 445 | 391 |
| MoS2–GSH–PF127 | 664 | 605 | 444 | 390 |
| MoS2–GSH–CYS | 675 | 617 | 457 | 397 |
| MoS2–GSH–CYS–PF127 | 672 | 611 | 446 | 395 |
3.3. Transmission electron spectroscopy (TEM)
PTA was used as the negative staining agent, thereby allowing a contrast between background and the MoS2 core. Each sample was stained with 0.2% (w/v) PTA for 2 min and the morphology was investigated by TEM. As shown in Fig. 3a, MoS2–GSH nanoparticle had a spherical shape and a size of ∼80–90 nm; this result was similar to that achieved by DLS. As shown in Fig. 3b, MoS2–GSH–PF127 displayed a homogenous and core shell that had a spherical structure and size of ∼50–60 nm. However, when CYS was coated on the surface of MoS2–GSH, the morphology changed to a core shell structure and its size increased to ∼100–150 nm. These results also support the DLS results (Fig. 3c).48 MoS2–GSH–CYS–PF127 (Fig. 3d) had a core shell structure with additional small and larger-sized aggregate particles that resembled the nanocomposites.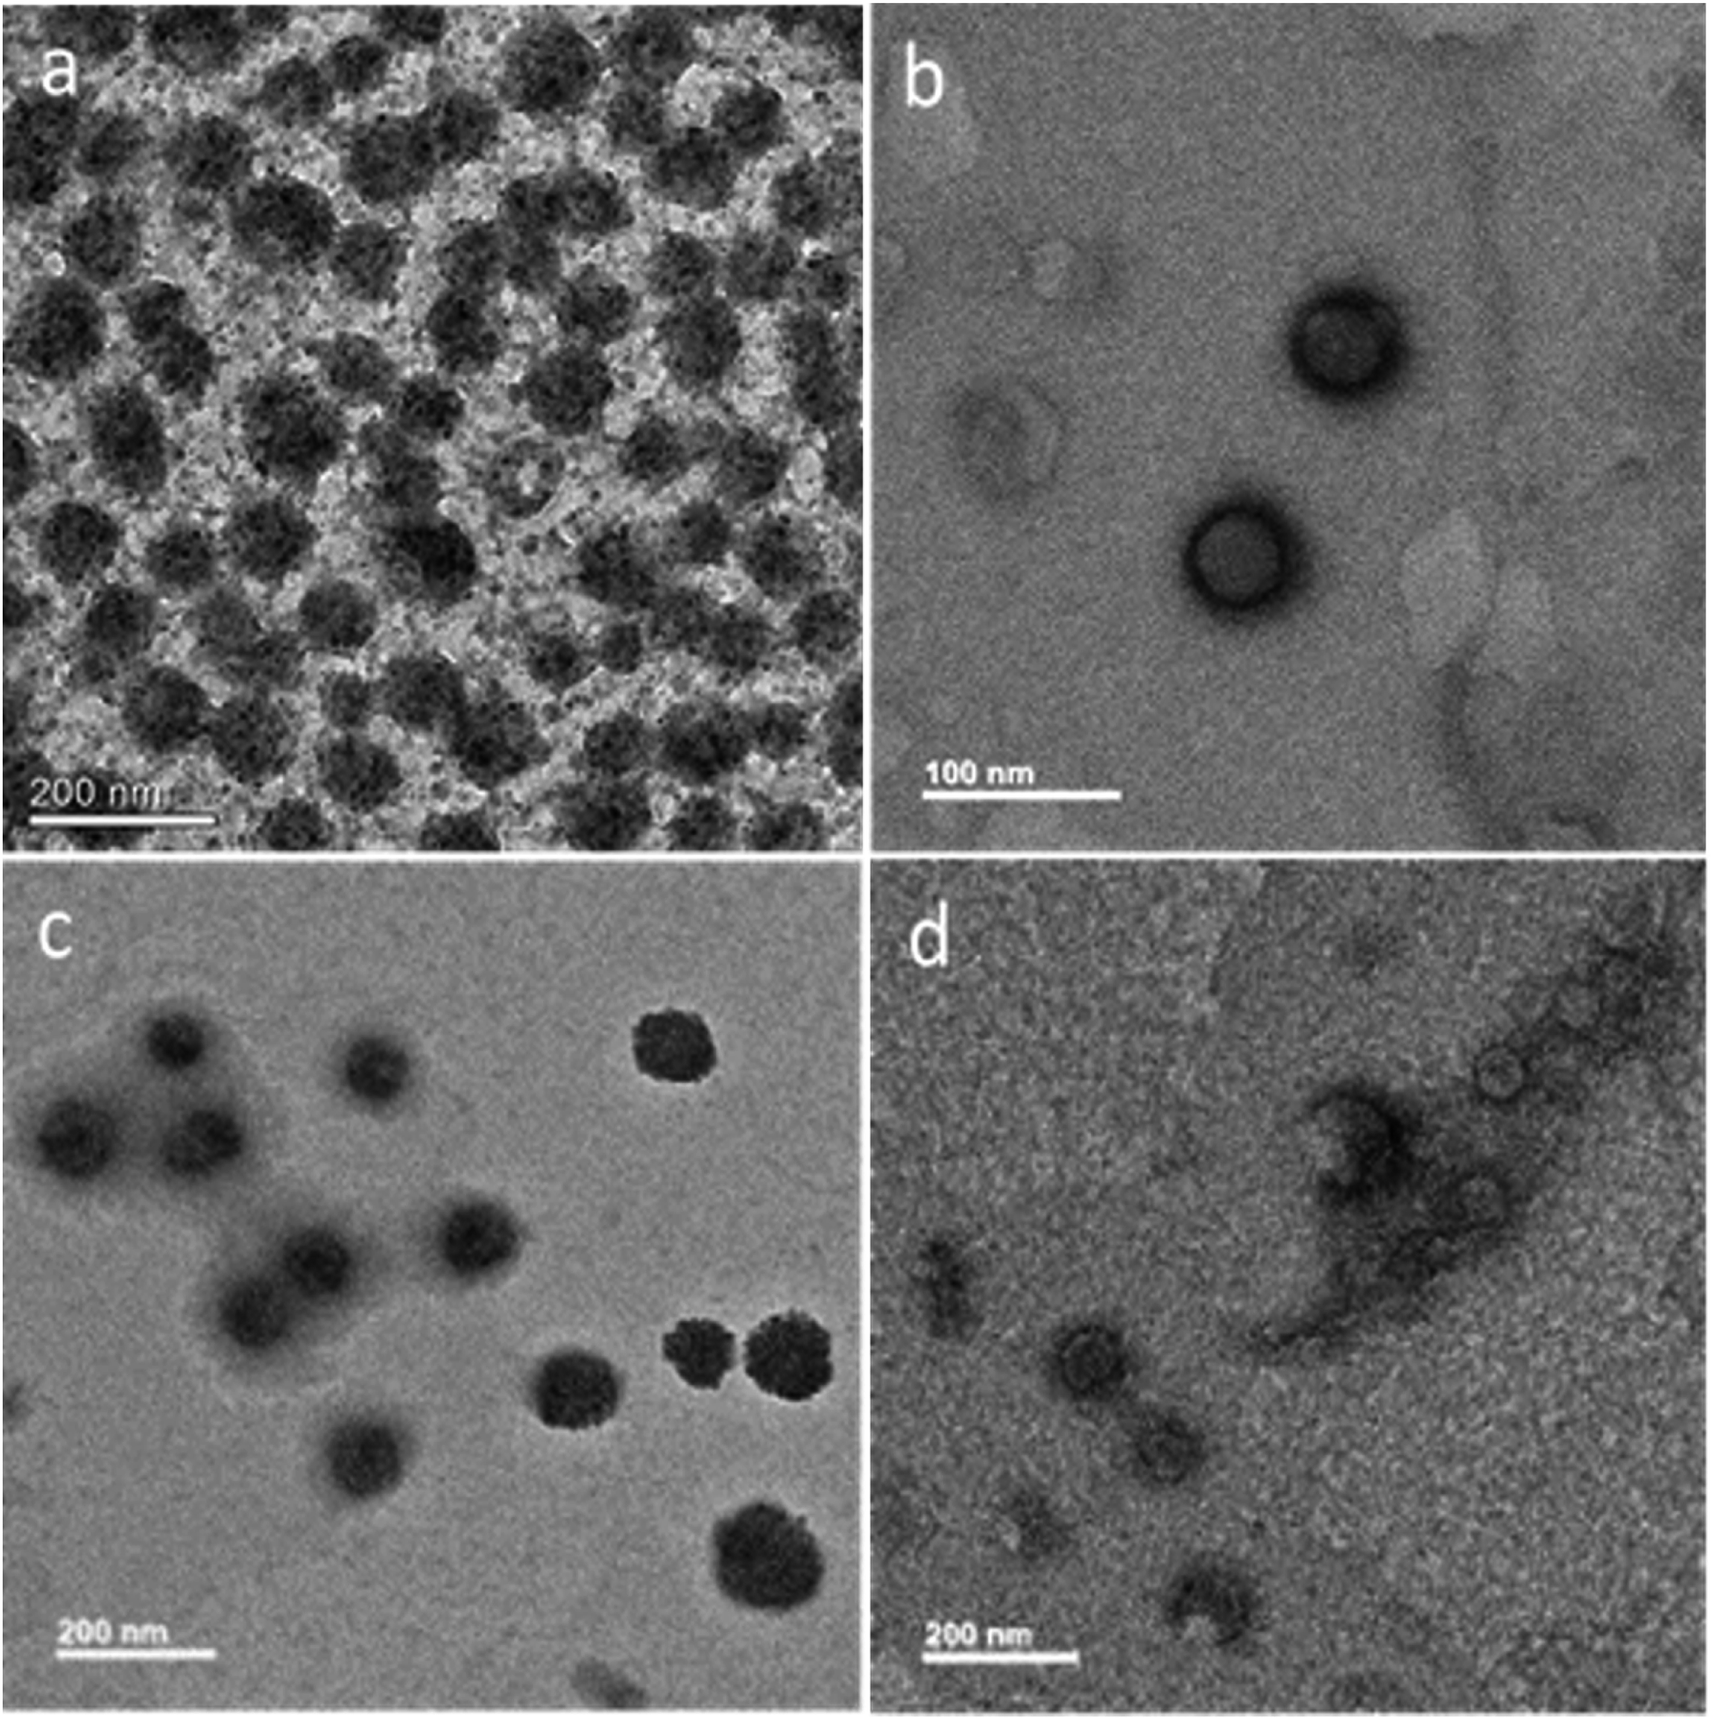 | ||
| Fig. 3 HR-TEM images of negative staining with phosphotungstic acid (PTA): (a) MoS2–GSH, (b) MoS2–GSH–PF127, (c) MoS2–GSH–CYS, and (d) MoS2–GSH–CYS–PF127. | ||
3.4. Determination of drug loading of MoS2–GSH–CYS–PF127 nanocomposites
To determine drug loading and encapsulation efficiency, 5 mg of the freeze-dried nanocomposites were dispersed in 5 mL of PBS. The loading capacity of the MoS2 nanocomposites were measured by UV-vis at an absorbance wavelength of 480 nm. Percent drug loading and encapsulation efficiency were calculated using the following equations:DOX concentration was calculated as:
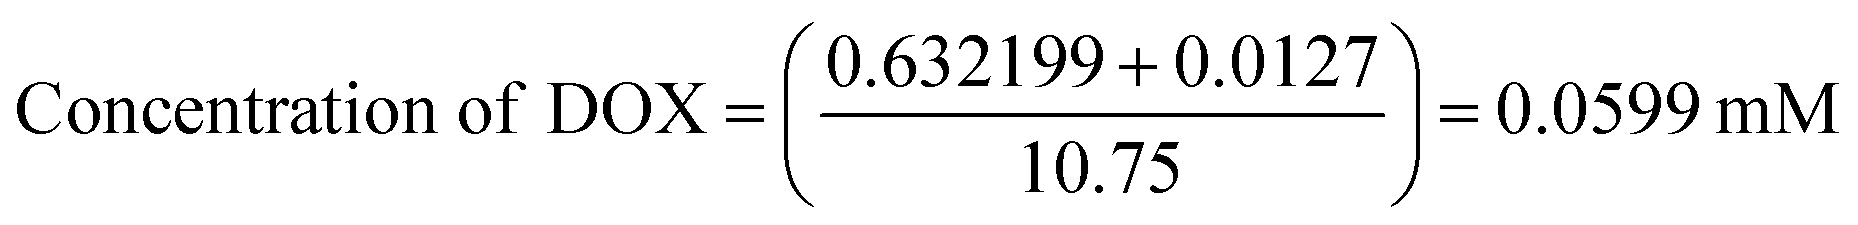


The calculated drug loading capacity and encapsulation efficiency were 51.36% and 56%, respectively.
3.5. UV-visible spectroscopy, particle size, zeta potential, GSH reduction sensitivity, and cumulative drug release studies of DOX-loaded MoS2–GSH–CYS–PF127
As shown in Fig. 4a, the characteristic maximum absorbance for DOX was ∼286 nm and 483 nm, which are values similar to previous reports.53,54 Furthermore, the DOX peak in the drug-loaded MoS2–GSH–CYS–PF127 was ∼302 and 524; these were observed to shift from the native DOX peaks of ∼286 and 483. This shifting might be due to the electron donor–acceptor interaction between DOX and MoS2 nanocomposites.55,56 The size and zeta potential of the drug-loaded MoS2 nanocomposites were significantly increased (Table 2). Before loading, the MoS2 nanocomposites had a size of ∼82.3 nm and zeta potential value of ∼1.7 mV. After DOX loading, the size of the MoS2 nanocomposites was ∼102 and zeta potential value was 9.4 mV. This result indicates that the nanoparticles were nearly electrically neutral which is beneficial for prolonged circulation in blood without the possibility of elimination.57 The stability of DOX-loaded MoS2–GSH–CYS–PF127 has been evaluated for one month, and the size of drug carrier showed around 99.7 nm (Table 3), which also proved that the PF127 has successfully covered on the surface of drug carrier. The GSH sensitivity of the drug-loaded MoS2 nanocomposites was explored in the presence and absence of 5 mM GSH in PBS buffer by measuring the changes in particle size at different time intervals. As shown in Table 3, the particle size of the DOX-loaded MoS2–GSH–CYS–PF27 increased from 102 to 261 nm in 24 h, 479 nm in 48 h, and 778 nm in 72 h in the presence of GSH. This is due to the cleavage of the disulfide linkage in the core of the MoS2 nanocomposites, thereby leading to larger particle sizes. In contrast, dramatic size changes were not found in drug-loaded MoS2 nanocomposites in the absence of GSH.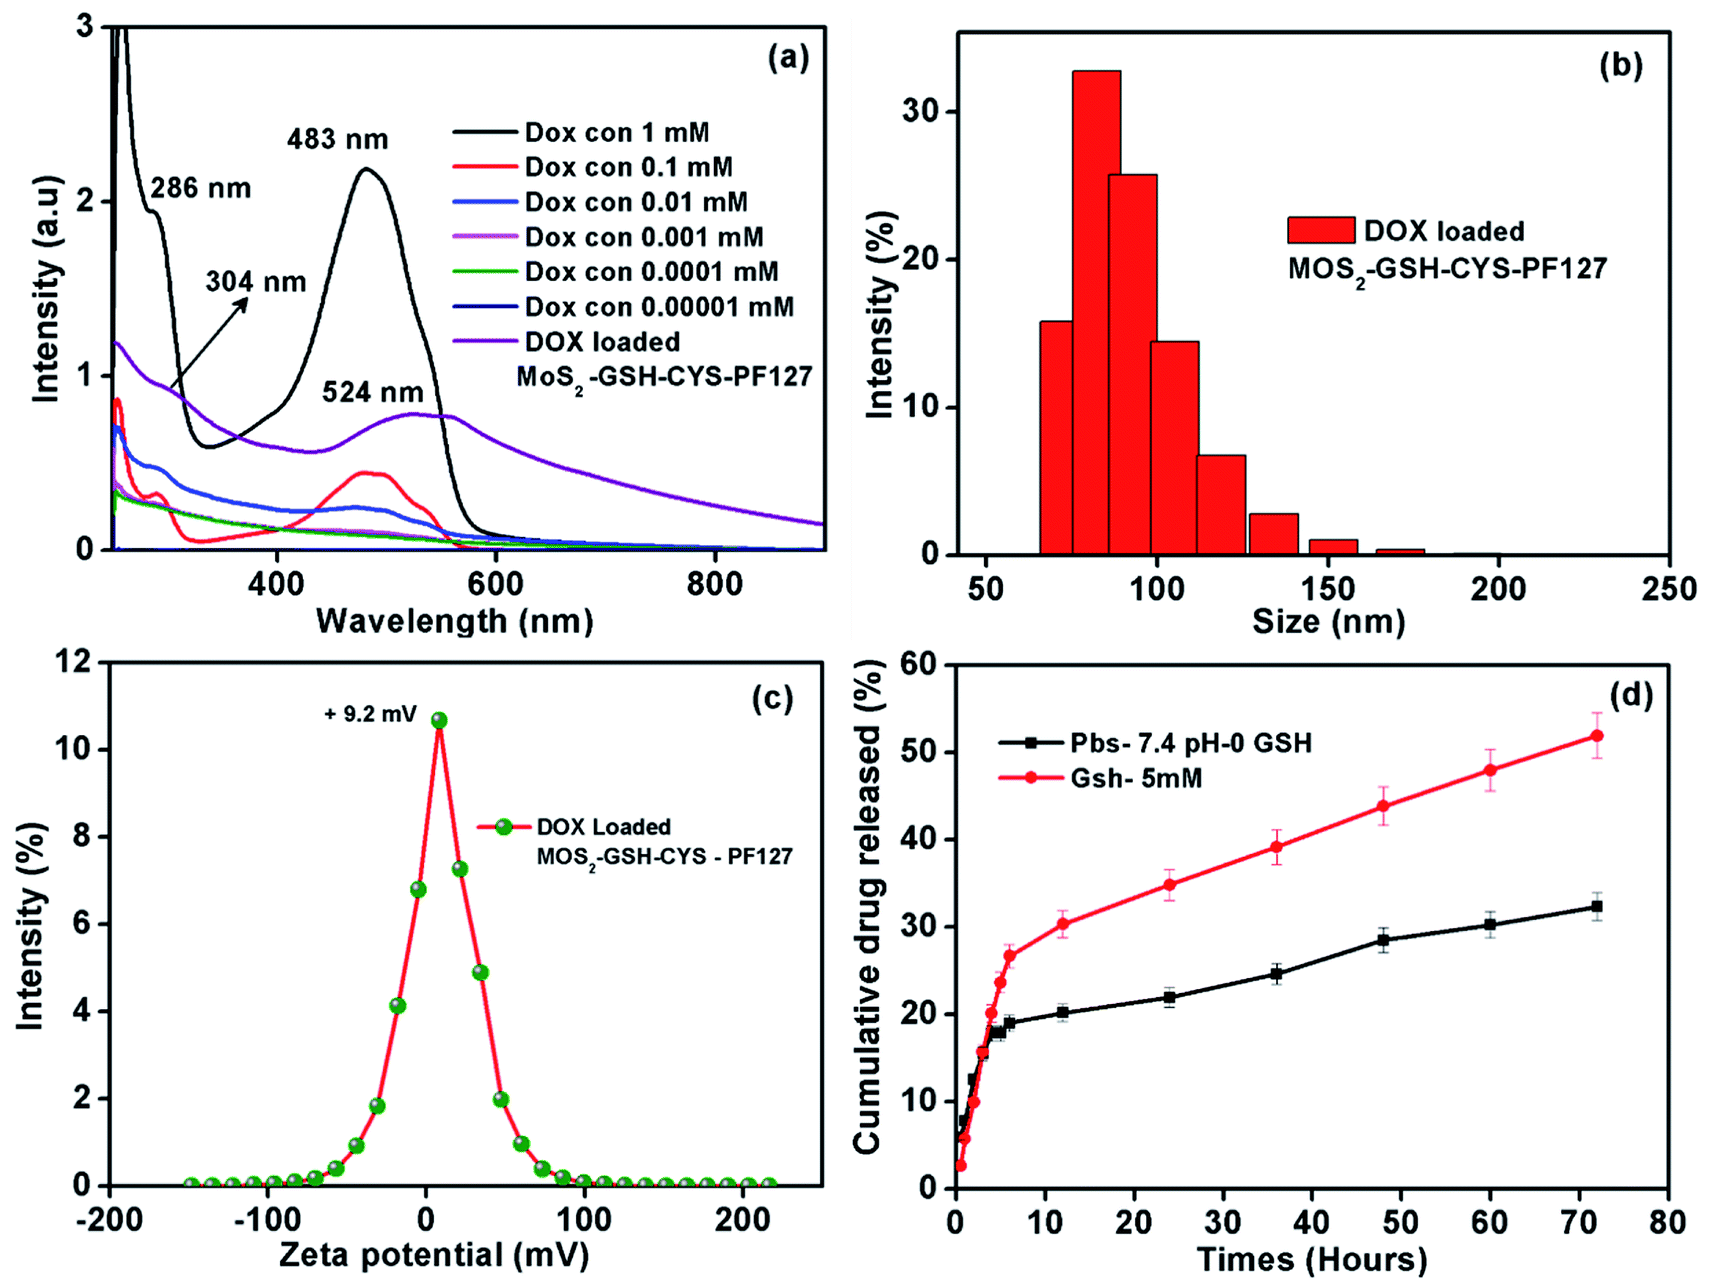 | ||
| Fig. 4 (a) UV-visible spectra of the different concentrations of DOX and DOX-loaded MoS2–GSH–CYS–PF127 composite used to construct the calibration curve. (b) Hydrodynamic size of MoS2–GSH–CYS–PF127. (c) Zeta potential values of DOX-loaded MoS2–GSH–CYS–PF127. (d) Cumulative drug release profile (%) of DOX from MoS2–GSH–CYS–PF127 at 37 °C with pH 7.4 PBS and 5 mM GSH. | ||
| System | Particles size (nm ± 2) | Zeta potential (mV ± 2) |
|---|---|---|
| MoS2–GSH–CYS–PF127 | 82.3 | 1.7 |
| DOX-loaded MoS2–GSH–CYS–PF127 | 102 | 9.4 |
| DOX-loaded MoS2–GSH–CYS–PF127 (I month) | 99.7 | 9.3 |
By using the dialysis method, we demonstrated the release of DOX from MoS2–GSH–CYS–PF127 nanocomposites at 37 °C in PBS buffer (pH 7.4) in the presence and absence of 5 mM GSH. The DOX solution was removed from the drug release setup and UV was measured at predetermined intervals for 72 h. As shown in Fig. 4d, the 5 mM GSH-containing MoS2 nanocomposites released more DOX (52%) relative to the nanocomposites without GSH (32%). Due to the disulfide reducing CYS present in the core of the MoS2 nanocomposites, introducing GSH breaks the disulfide bond, ultimately leading to drug release.58–60 The introduction of 5 mM GSH to drug loaded MoS2 system effectively reduce the disulphide bond of cystamine results the dissociation of ligands (GSH and CYS) and recombination of ligands (GSH and CYS) on the surface of MoS2. In addition, the disruption of cysteamine positive cystamine on the surface easily to make the aggregation of negative charge of MoS2 with surface positive charge cystamine and then finally leading to increase the size in DLS measurement (Table 4). However, the particle size of DOX-loaded MoS2–GSH–CYS–PF127 is increased while absence of GSH environment which may occurred due to instability of PF127 during drug release environment. The fresh phosphate buffer has been added and make dilution of DOX-loaded MoS2–GSH–CYS–PF127 solution and resulted the particle size slightly increased at 48 and 72 hours.61
| Time (h) | Particle size (nm ± 2) presence of 5 mM GSH | Particle size (nm ± 2) PBS buffer, absence of GSH |
|---|---|---|
| 24 | 261 | 104 |
| 48 | 479 | 139 |
| 72 | 778 | 284 |
3.6. In vitro cytotoxicity of MoS2–GSH–CYS–PF127, free DOX, and DOX-loaded MoS2–GSH–CYS–PF127 nanocomposites
The cytotoxicity of nanomaterials used in DDSs is the most important factor that can reduce their adverse side effects. Hence, the cytotoxicity of the synthesized MoS2–GSH–CYS–PF127 was evaluated by the MTT assay. Prior to drug loading, the MoS2 nanocomposite did not exhibit any significant toxicity and almost 95% of the cells were viable even when the concentration of the nanocarrier reached 200 μg mL−1; this result proved the biocompatibility of the nanocomposite. As demonstrating the sensitivity of drug release under reduced GSH environment is important, different concentrations of DOX-loaded MoS2–GSH–CYS–PF127 were incubated with HeLa cells for 24 h to evaluate drug release. The results were then assessed using the MTT assay. Concentration-dependent toxicity was observed in DOX-loaded MoS2–GSH–CYS–PF127. Moreover, a maximum cell death of almost 65% was observed at 40 μg mL−1. Interestingly, the cell death ratio of DOX-loaded MoS2–GSH–CYS–PF127 was almost equal to that of free DOX. These results proved the potential of GSH to induce drug release from the MoS2 nanocomposite system and the capability of this nanocomposite as a drug carrier. To differentiate between the toxicity of the nanocomposite and drug, the cytotoxicity of the leading MoS2–GSH–CYS–PF127 nanocomposites was initially resolved prior to the addition of free DOX and DOX-loaded nanoparticles. The cytotoxicity of free DOX and DOX-loaded MoS2–GSH–CYS–PF127 was assessed using HeLa cells at several concentrations after a 24 h treatment. This assured that MoS2–GSH–CYS–PF127 could be used as a drug carrier. Herein, 95% of HeLa cells were viable after a 24 h incubation, even at the high concentration of 200 μg mL−1. From 100 μg mL−1 to 12.5 μg mL−1, cell viability reached more than 100% as shown in Fig. 5a; (the free nanoparticle concentrations were 200, 100, 50, 25, 12.5, and 0 μg mL−1). We also found that DOX and DOX-loaded MoS2–GSH–CYS–PF127 displayed low toxicity at the concentrations tested (free DOX and DOX-loaded nanocomposites: 40, 20, 10, 5, 2.5, and 0 μg mL−1). As shown in Fig. 5b, HeLa cells were treated with free DOX and DOX-loaded MoS2–GSH–CYS–PF127 nanocomposites for 24 h. The HeLa cells incubated with DOX loaded MoS2–GSH–CYS–PF127 showed 38% toxicity at drug concentration of 40 μg, which indicated that the successfully released of drug from carrier and caused the cell death. Moreover, DOX-loaded MoS2–GSH–CYS–PF127 nanocomposites exhibited lower cytotoxicity than free DOX. As mentioned above, free DOX is slightly more cytotoxic than DOX-loaded MoS2–GSH–CYS–PF127 toward HeLa cells. This is because of the low molecular weight of DOX enables its easy diffusion into the cell without the drug release process.62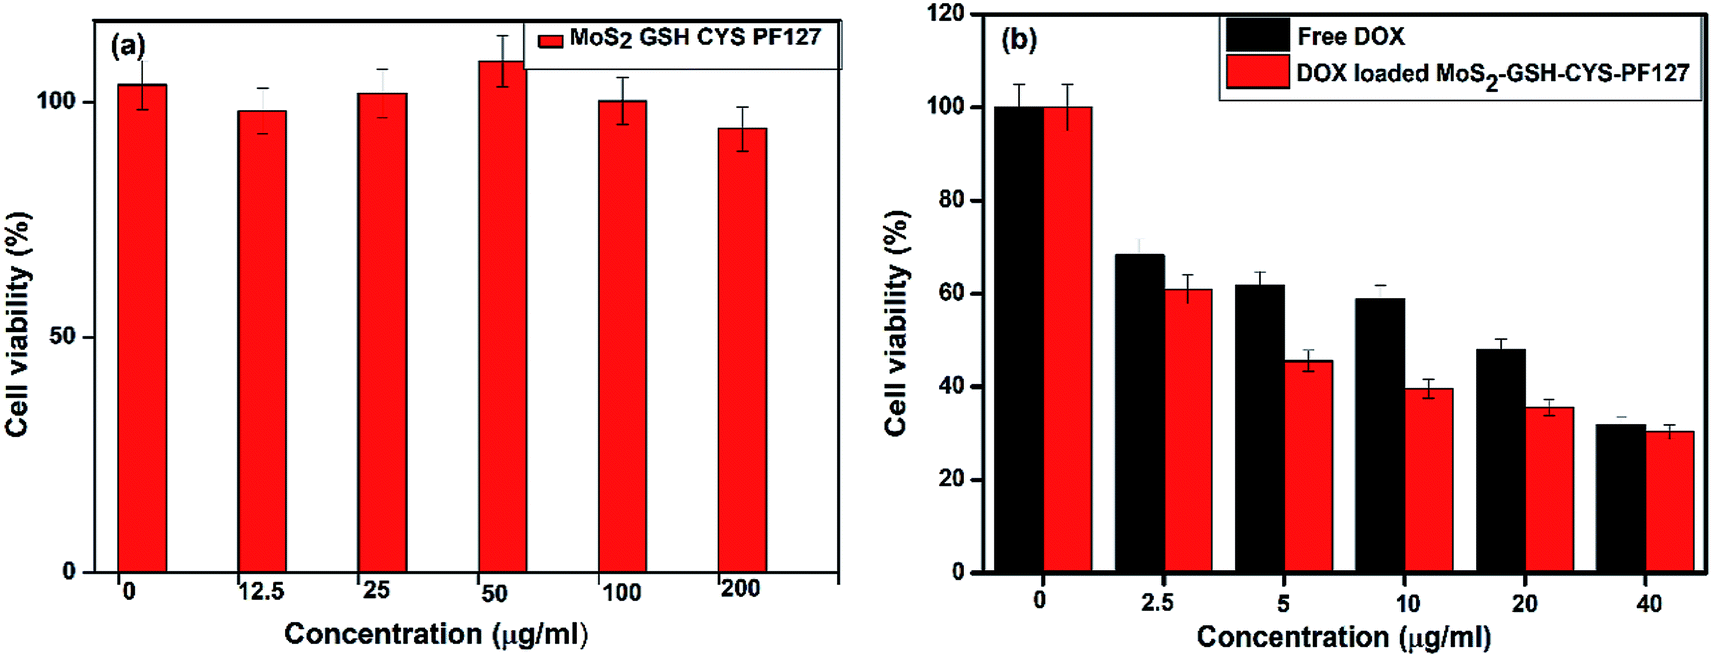 | ||
| Fig. 5 (a) MTT assay for MoS2–GSH–CYS–PF127, (b) DOX-loaded MoS2 nanocomposite, and free DOX at several concentrations. | ||
3.7. Cellular uptake and intracellular release of DOX-loaded MoS2–GSH–CYS–PF127 nanocomposites
The results of the in vitro drug release studies inspired us to investigate the cellular uptake and intracellular distribution of free DOX and DOX-loaded MoS2–GSH–CYS–PF127 nanocomposites. Hence, we employed HeLa cells for the evaluation and a fluorescence microscope for visualization. The concentration of free DOX and DOX in the MoS2 carrier was fixed to 5 μg mL−1. Fig. 6A shows the fluorescent microscopic images of HeLa cells incubated with DOX-loaded MoS2–GSH–CYS–PF127 nanocomposites. These cells displayed a faint red DOX fluorescence within the cell membrane or cytoplasm of cells at the beginning of incubation (i.e., 2–4 h). However, after 6 h of incubating the MoS2 carrier with HeLa cells, a strong red fluorescence was observed in the nucleus of HeLa cells depicting DOX release from the carrier, followed by internalization into the nucleus. Drug-loaded MoS2–GSH–CYS–PF127 nanocomposites efficiently released the drug under the intracellular GSH-rich condition and the released drug subsequently diffused into the nuclei of HeLa cells. The internalization of free DOX by HeLa cells also resulted in a strong red color and this was even evident at 2 h (Fig. 6B). However, a higher number of dead cells was observed with free DOX than DOX-loaded MoS2 nanocomposites.63,64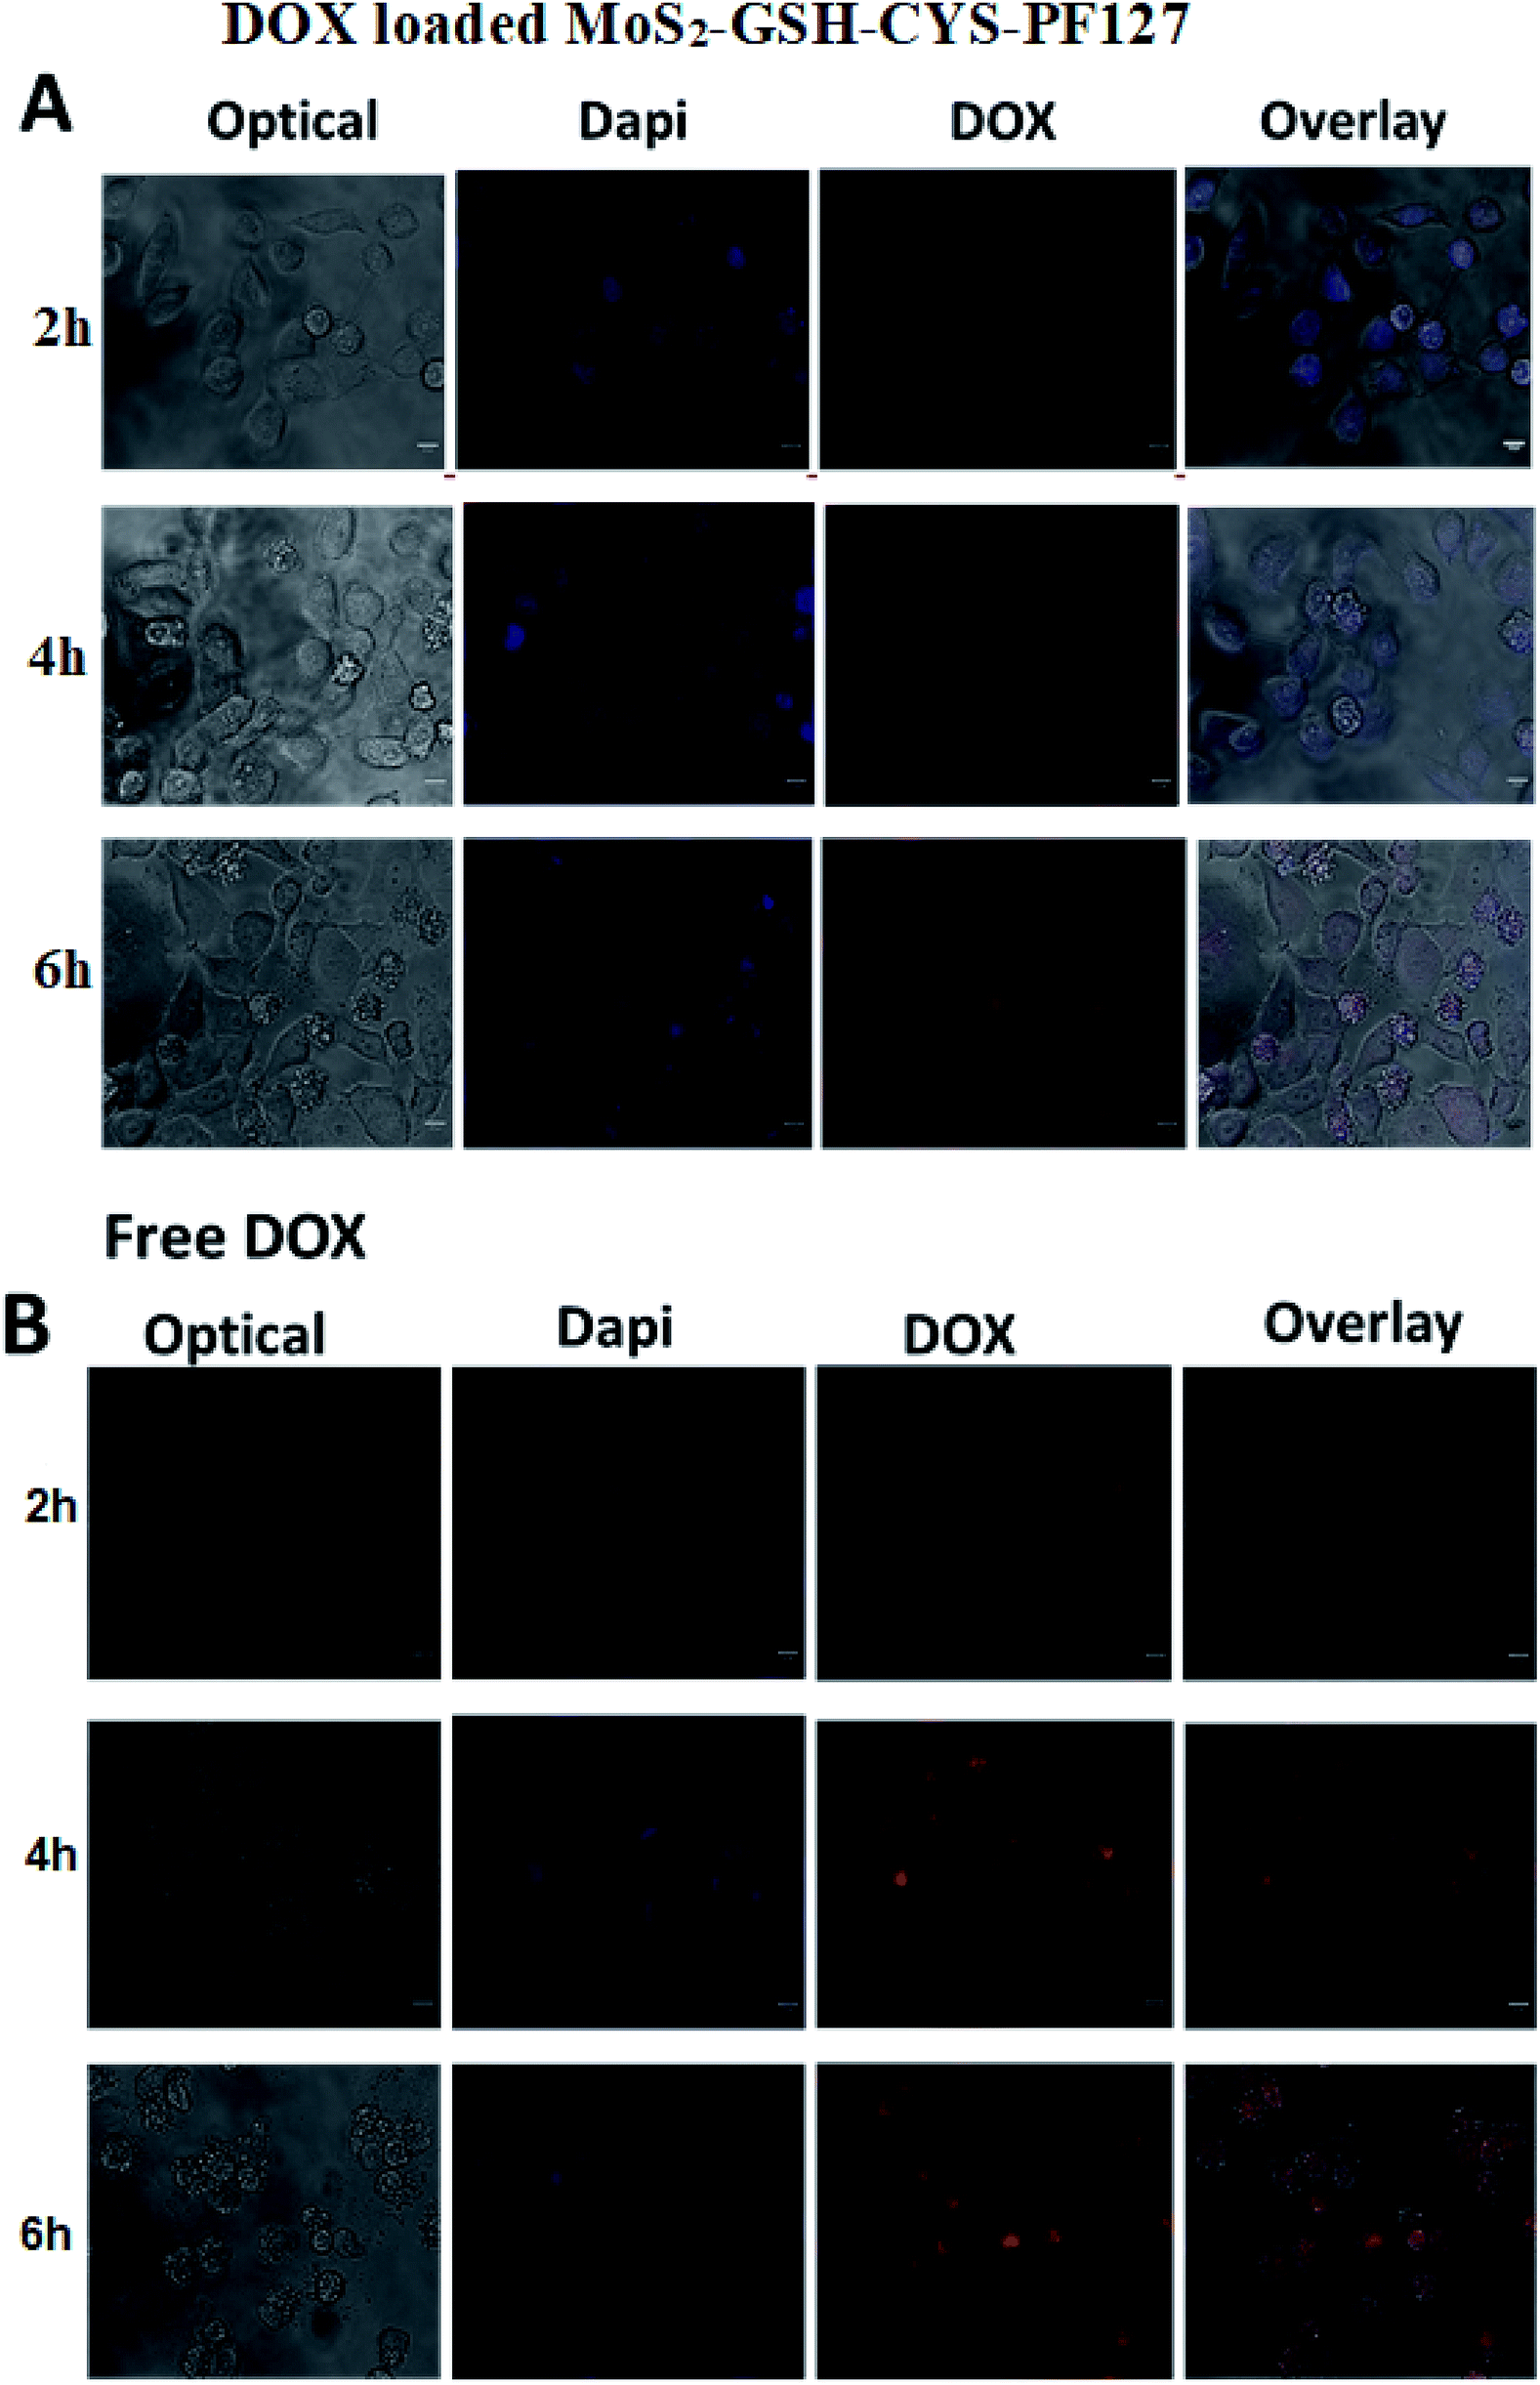 | ||
| Fig. 6 (A) Internalization and retention of DOX-loaded MoS2–GSH–CYS–PF127 in HeLa cells 2 h, 4 h, and 6 h following the removal of the DOX formulations as measured by confocal microscopy. (B) Internalization and retention of free DOX in HeLa cells 2 h, 4 h, and 6 h after the removal of DOX-loaded MoS2–GSH–CYS–PF127 nanocomposites as measured by confocal microscopy. Scale bar represents 10 μm. | ||
4. Conclusion
In this study, we prepared a DOX-loaded PF127 self-assembled MoS2 nanocomposite and demonstrated its ability to release the transported drug under reduced GSH conditions. To construct the GSH-sensitive MoS2 nanocomposite, we introduced a disulfide-containing CYS to the exfoliated MoS2 prior to introducing PF127. By TEM imaging, the synthesized MoS2 nanocomposite was found to have a spherical shape and size of ∼82.3 nm while the DOX-loaded MoS2 nanocomposite had a size of 102 nm. In 5 mM GSH, the MoS2 nanocomposite released 52% of the transported drug in 72 h. In addition, by performing an MTT assay, the biocompatibility of the nanocomposite was confirmed. The DOX-loaded nanocomposite was demonstrated to be highly toxic due to the release of DOX in the GSH-rich cancer cell environment. The DOX release behavior of the carrier was further supported by images obtained via fluorescence microscopy. Compared to 2 h, after 6 h of incubation, the DOX-loaded nanocomposite effectively released DOX which was internalized into the nucleus. After a 4 h incubation, DOX was only found in the cell membrane and cytoplasm.Conflicts of interest
There are no conflicts to declare.Acknowledgements
The authors would like to thank the Ministry of Science and Technology, Taiwan, for financial support (MOST 104-2221-E-011-154 and 108-2221-E-011-110-MY3).References
- J. F. Quinn, M. R. Whittakera and T. P. Davis, Polym. Chem., 2017, 8, 97–126 RSC.
- J. Kim, H. Kim and W. J. Kim, Small, 2016, 12(9), 1184–1192 CrossRef CAS PubMed.
- R. Kircheis, L. Wightman and E. Wagner, Adv. Drug Delivery Rev., 2001, 53, 34 CrossRef.
- M. S. Shim and Y. J. Kwon, Adv. Drug Delivery Rev., 2012, 64, 1046 CrossRef CAS PubMed.
- K. S. Kim, W. Park, J. Hu, Y. H. Bae and K. Na, Biomaterials, 2014, 35, 337–343 CrossRef CAS PubMed.
- M. Huo, J. Yuan, L. Tao and Y. Wei, Polym. Chem., 2014, 5, 1519–1528 RSC.
- J. Akimoto, M. Nakayama and T. J. Okano, J. Controlled Release, 2014, 193, 2–8 CrossRef CAS PubMed.
- C. E. Callmann, C. V. Barback, M. P. Thompson, D. J. Hall, R. F. Mattrey and N. C. Gianneschi, Adv. Mater., 2015, 27, 4611–4615 CrossRef CAS PubMed.
- J. Wang, J. Liu, Y. Liu, L. Wang, M. Cao, Y. Ji, X. Wu, Y. Xu, B. Bai, Q. Miao, C. Chen and Y. Zhao, Adv. Mater., 2016, 28, 8950–8958 CrossRef CAS PubMed.
- H. Zhang, J. Fei, X. Yan, A. Wang and J. Li, Adv. Funct. Mater., 2015, 25, 1193–1204 CrossRef CAS.
- H. Wang, A. J. Shen, Y. Li, Z. Wei, G. Cao, Z. Gai, K. Hong, P. Banerjeea and S. Zhou, Biomater. Sci., 2014, 2, 915–923 RSC.
- A. K. Silva, C. Menager and C. Wilhelm, Nanomedicine, 2015, 10, 2797–2799 CrossRef CAS PubMed.
- V. Shanmugam, S. Selvakumar and C. S. Yeh, Chem. Soc. Rev., 2014, 43, 6254–6287 RSC.
- H. Li, L. LTan, P. Jia, Q. L. Li, Y. L. Sun, J. Zhang, Y. Q. Ning, J. Yu and Y. W. Yang, Chem. Sci., 2014, 5, 2804–2808 RSC.
- J. Yu, W. Yin, X. Zheng, G. Tian, X. Zhang, T. Bao, X. Dong, Z. Wang, Z. Gu, X. Ma and Y. Zhao, Theranostics, 2015, 5(9), 931–945 CrossRef CAS PubMed.
- R. Cheng, F. Meng, C. Deng, H. A. Klok and Z. Zhong, Biomaterials, 2013, 34, 3647–3657 CrossRef CAS PubMed.
- J. Zhuang, M. R. Gordon, J. Ventura, L. Li and S. Thayumanavan, Chem. Soc. Rev., 2013, 42, 7421–7435 RSC.
- D. Peer, J. M. Karp, S. Hong, O. C. Farokhzad, R. Margalit and R. Langer, Nat. Nanotechnol., 2007, 2, 751–760 CrossRef CAS PubMed.
- E. Fleige, M. A. Quadir and R. Haag, Adv. Drug Delivery Rev., 2012, 64, 866–884 CrossRef CAS PubMed.
- R. Cheng, F. Meng, C. Deng, H. A. Klok and Z. Zhong, Biomaterials, 2013, 34, 3647–3657 CrossRef CAS PubMed.
- V. P. Torchilin, Nat. Rev. Drug Discovery, 2014, 13, 813–827 CrossRef CAS PubMed.
- M. A. C. Stuart, W. T. S. Huck, J. Genzer, M. Müller, C. Ober, M. Stamm, G. B. Sukhorukov, I. Szleifer, V. V. Tsukruk, M. Urban, F. Winnik, S. Zauscher, I. Luzino and S. Minko, Nat. Mater., 2010, 9, 101 CrossRef PubMed.
- X. Yang, X. Liu, Z. Liu, F. Pu, J. Ren and X. Qu, Adv. Mater., 2012, 24, 2890 CrossRef CAS PubMed.
- G. Saito, J. A. Swanson and K. D. Lee, Adv. Drug Delivery Rev., 2003, 55, 199 CrossRef CAS PubMed.
- Z. Luo, K. Cai, Y. Hu, J. Li, X. Ding, B. Zhang, D. Xu, W. Yang and P. Liu, Adv. Mater., 2012, 24, 431 CrossRef CAS PubMed.
- H. Kim, S. Kim, C. Park, H. Lee, H. J. Park and C. Kim, Adv. Mater., 2010, 22, 4280 CrossRef CAS PubMed.
- S. Cerritelli, D. Velluto and J. A. Hubbell, Biomacromolecules, 2007, 8, 196 CrossRef PubMed.
- J. C. Eloi, D. A. Rider, G. Cambridge, G. R. Whittell, M. A. Winnik and I. Manners, J. Am. Chem. Soc., 2011, 133, 8903 CrossRef CAS PubMed.
- A. Napoli, M. Valentini, N. Tirelli, M. Müller and J. A. Hubbell, Nat. Mater., 2004, 3, 183 CrossRef CAS PubMed.
- Y.-L. Zhao, Z. Li, S. Kabehie, Y. Y. Botros, J. F. Stoddart and J. I. Zink, J. Am. Chem. Soc., 2010, 132, 13016 CrossRef CAS PubMed.
- Y. Tu, F. Peng, P. B. White and D. A. Wilson, Angew. Chem., Int. Ed., 2017, 56, 7620–7624 CrossRef CAS PubMed.
- X. Wu, Y. Li, C. Lin, X. Y. Hu and L. Wang, Chem. Commun., 2015, 51, 6832–6835 RSC.
- S. C. Chen, C. Y. Lin, T. L. Cheng and W. L. Tsen, Adv. Funct. Mater., 2017, 27, 1702452 CrossRef.
- S. Z. Butler, S. M. Hollen, L. Cao, Y. Cui, J. A. Gupta, H. R. Gutierrez, T. F. Heinz, S. S. Hong, J. Huang, A. F. Ismach, E. JohnstonHalperin, M. Kuno, V. V. Plashnitsa, R. D. Robinson, R. S. Ruoff, S. Salahuddin, J. Shan, L. Shi, M. G. Spencer, M. Terrones, W. Windl and J. E. Goldberger, ACS Nano, 2013, 7, 2898 CrossRef CAS PubMed.
- Y. Guo, K. Xu, C. Wu, J. Zhao and Y. Xie, Chem. Soc. Rev., 2015, 44, 637 RSC.
- V. B. Mohana, K. T. Lau, D. Huic and D. Bhattacharyyaa, Composites, Part B, 2018, 142, 200–220 CrossRef.
- D. Bitounis, H. A. Boucetta, B. H. Hong, D.-H. Min and K. Kostarelos, Adv. Mater., 2013, 25, 2258–2268 CrossRef CAS PubMed.
- S. Park and R. S. Ruoff, Nat. Nanotechnol., 2009, 4, 217–224 CrossRef CAS PubMed.
- M. Chhowalla, H. S. Shin, G. Eda, L. J. Li, K. P. Loh and H. Zhang, Nat. Chem., 2013, 5, 263 CrossRef PubMed.
- Q. H. Wang, K. Kalantar-Zadeh, A. Kis, J. N. Coleman and M. S. Strano, Nat. Nanotechnol., 2012, 7, 699 CrossRef CAS PubMed.
- S. S. Chou, M. De, J. Kim, S. Byun, C. Dykstra, J. Yu, J. Huang and V. P. Dravid, J. Am. Chem. Soc., 2013, 135, 4584 CrossRef CAS PubMed.
- W. Z. Teo, E. L. K. Chng, Z. Sofer and M. Pumera, Chem.–Eur. J., 2014, 20, 9627 CrossRef CAS PubMed.
- S. Son, R. Namgung, J. Kim, K. Singha and W. J. Kim, Acc. Chem. Res., 2012, 45, 1100 CrossRef CAS PubMed.
- V. Yadav, S. Roy, P. Singh, Z. Khan and A. Jaiswal, Small, 2019, 15, 1803706 CrossRef PubMed.
- X. Dong, W. Yin, X. Zhang, S. Zhu, X. He, J. Yu, J. Xie, Z. Guo, L. Yan, X. Liu, Q. Wang, Z. Gu and Y. Zhao, ACS Appl. Mater. Interfaces, 2018, 10, 4271–4284 CrossRef CAS PubMed.
- X. Zhang, J. Wu, G. R. Williams, S. Niu, Q. Qian and L. M. Zhu, Colloids and Surfaces, B: Biointerfaces, 2019, 173, 101–108 CrossRef CAS PubMed.
- X. Zhu, X. Ji, N. Kong, Y. Chen, M. Mahmoudi, X. L. Ding, W. Tao, T. Cai, Y. Li, T. Gan, A. Barret, Z. Bharwani, H. Chen and O. C. Farokhzad, ACS Nano, 2018, 12(3), 2922–2938 CrossRef CAS PubMed.
- R. Anbazhagan, Y. A. Su, H. C. Tsai and R. Jeng, ACS Appl. Mater. Interfaces, 2016, 8, 1827–1835 CrossRef CAS PubMed.
- A. M. Mohammad, A. I. Abdelrahman, M. S. El-Deab, T. Okajima and T. Ohsaka, Colloids Surf., A., 2008, 31, 78–83 CrossRef.
- M. M. Yallapu, S. F. Othman, E. T. Curtis, B. K. Gupta, M. Jaggi and S. C. Chauhan, Biomaterials, 2011, 32, 1890–1905 CrossRef CAS PubMed.
- T. K. Jain, M. A. Morales, S. K. Sahoo, D. L. Leslie-Pelecky and V. Labhasetwar, Mol. Pharmaceutics, 2005, 2, 194–205 CrossRef CAS PubMed.
- O. Y. Posudievsky, O. A. Khazieieva, V. V. Cherepanov, G. I. Dovbeshko, A. G. Shkavro, V. G. Koshechkoa and V. D. Pokhodenkoa, J. Mater. Chem. C, 2013, 1, 6411–6415 RSC.
- H. Cai, T. S. A. M. Kirillov, Y. Zhang, C. Shan, X. L. W. Liu and Y. Tang, Inorg. Chem., 2017, 56, 5295–5304 CrossRef CAS PubMed.
- S. Li, D. Amat, Z. Peng, S. Vanni, S. Raskin, G. D. Angulo, A. M. Othman, R. M. Grahamb and R. M. Leblanc, Nanoscale, 2016, 8, 16662–16669 RSC.
- H. Hu, J. Yu, Y. Li, J. Zhao and H. Dong, J. Biomed. Mater. Res., Part A, 2012, 100, 141–148 CrossRef PubMed.
- W. Yin, L. Yan, J. Yu, G. Tian, L. Zhou, X. Zheng, X. Zhang, Y. Yong, J. Li, Z. Gu and Y. Zhao, ACS Nano, 2014, 8(7), 6922–6933 CrossRef CAS PubMed.
- M. Zhang, Q. Xiong, J. Chen, Y. Wang and Q. Zhang, Polym. Chem., 2013, 4, 5086–5095 RSC.
- C. Baek, T.-L. Ha, E. Kim, S. Jeong, S. Lee, S. Lee and H.-C. Kim, Polymer, 2015, 7, 1511 Search PubMed.
- H. S. Han, T. Thambi, K. Y. Choi, S. Son, H. Ko, M. C. Lee, D.-G. Jo, Y. S. Chae, Y. M. Kang, J. Y. Lee and J. H. Park, Biomacromolecules, 2015, 16, 447–456 CrossRef CAS PubMed.
- L. Yu, Y. Chen, H. Lin, W. Du, H. Chen and J. Shi, Biomaterials, 2018, 161, 292–305 CrossRef CAS PubMed.
- S. Lu, N. Gao, Z. Cao, C. Gao, X. Xu, X. Bai, C. Feng and M. Liu, RSC Adv., 2016, 6, 49263–49271 RSC.
- T. A. Debele, L.-Y. Yu, C.-S. Yang, Y.-A. Shen and C.-L. Lo, Biomacromolecules, 2018, 19, 3725–3737 CrossRef CAS PubMed.
- P. Kumara, K. M. Paknikara and V. Gajbhiye, Colloids and Surfaces, B: Biointerfaces, 2018, 171, 437–444 CrossRef PubMed.
- J. Li, S. Shen, F. Kong, T. Jiang, C. Tang and C. Yin, RSC Adv., 2018, 8, 24633–24640 RSC.
| This journal is © The Royal Society of Chemistry 2019 |