 Open Access Article
Effects of poplar addition on tar formation during the co-pyrolysis of fat coal and poplar at high temperature†
Shuxing Qiuabc,
Shengfu Zhang *ab,
Yunpeng Fangab,
Guibao Qiuab,
Cheng Yinab,
Ramana G. Reddyc,
Qingyun Zhangab and
Liangying Wenab
aCollege of Materials Science and Engineering, Chongqing University, Chongqing 400044, China. E-mail: zhangsf@cqu.edu.cn; Fax: +86-23-65112631
bChongqing Key Laboratory of Vanadium-Titanium Metallurgy and Advanced Materials, Chongqing University, Chongqing 400044, China
cDepartment of Metallurgical and Materials Engineering, College of Engineering, The University of Alabama, Tuscaloosa, 35487, USA
First published on 9th September 2019
Abstract
Three-stage absorption by butyl acetate was used to obtain tar components during the co-pyrolysis of fat coal and poplar at high temperature. The resulting tar yields were calculated relative to the fat coal and poplar blends. The tar components were characterized by gas chromatography-mass spectrometry, Fourier transform-infrared spectroscopy and 1H nuclear magnetic resonance spectroscopy. The effects of the added poplar on tar formation were then considered. The results show that the poplar–fat coal tar yield rose slightly when the poplar addition levels ranged from 4% to 12% and then increased much more at higher poplar addition levels. Oxygenated and aromatic compounds contributed greatly to the poplar–fat coal tar yield. The quantity of oxygenated components increased in the poplar blending ratio range from 4% to 12% and decreased as the ratio increased further, while the quantity of aromatic components showed the opposite trend. The influences of poplar addition levels on tar formation could be divided into two stages: (a) lighten the tar by stabilizing radicals at low poplar addition levels; (b) form heavier tar due to cross-linking reactions of the remaining radicals at high poplar addition levels. When the poplar addition levels ranged from 4% to 12%, due to synergistic effects, large amounts of free radicals and hydrogen from the co-pyrolysis of coal and poplar formed lighter stable compounds, which were then transported into the tar. Further, cross-linking reactions could be decreased because fewer free radicals and less hydrogen remained. As a result, the amount of PAHs declined, the tar yield rose slightly, the hydrocarbon-generating potential improved, the aliphatic chain length shortened, and the aromatic protons decreased. At higher blending ratios, excess radicals existed after stabilization due to the increasing poplar addition levels. These radicals underwent cross-linking reactions and produced PAHs, resulting in heavily increased tar yields, weakened hydrocarbon-generating potential, extended aliphatic chain lengths and increased aromatic protons.
1 Introduction
Tar, a significant by-product of the pyrolysis of coal, biomass or their blends, is a potential feedstock for value-added substances and materials, such as chemical products and liquid fuels.1–4 Tar is a complex mixture of condensable hydrocarbons comprising single-ring to 5-ring aromatic compounds plus other oxygen-containing hydrocarbons and complex polyaromatic hydrocarbons (PAHs).5–8 It should be noted that tar is different from bio-oil, which is also the pyrolysis product of biomass or biomass–coal blends and is usually defined as a dark brown, free-flowing organic liquid comprising highly oxygenated compounds, because they have different components and source conditions.9,10 Thus, there is no need to distinguish tar and bio-oil during pyrolysis at high temperature. As a by-product of the coking industry, coal tar mainly consists of phenols, aliphatic hydrocarbons and large amounts of PAHs.11 However, PAHs are among the most common organic components in highly carcinogenic substances; this results in challenging application of coal tar and environmental pollution.12 However, for biomass tar, the components are mainly oxygenated components and small amounts of low-aromatic PAHs;7 thus, biomass tar is much cleaner than coal tar. Furthermore, biomass is a renewable fuel, and its addition to coal during high temperature pyrolysis will not only decrease non-renewable carbon emissions but also has the potential to decrease the production of PAHs.11 Consequently, new insight into producing clean biomass–coal tar by adding biomass to coal during high temperature pyrolysis is extremely valuable.Understanding the structure of biomass–coal tar produced from co-pyrolysis of coal and biomass at high temperature is beneficial for improving the application of tar. Weiland et al.13 divided tar into light and heavy parts; the amount of light tar products increases while the heavy tar products decrease linearly with increasing quantity of biomass (switchgrass). Further, aromatic, aliphatic and oxygenated compounds are abundant in tar. Aromatic hydrocarbons show the highest concentration in biomass–coal tar with low percentages of biomass, while aliphatic and oxygenated hydrocarbons have the highest concentrations when the biomass addition is high.8 However, due to the complicated composition of tar and complex variations in the local composition of tar during pyrolysis processes, distinguishing tar components in a reasonable way is still an important topic. In contrast to previous work, this work divides tar components into four large categories containing several smaller categories to analyze the changes in tar components at different biomass addition levels in detail.
Tar formation is a complicated process in which many decomposition and recombination reactions occur. It is well known that the formation of coal tar is connected with a combination of radical stabilization and cross-linking reactions14,15 which follow the radical mechanism in coal pyrolysis at high temperature.16,17 Biomass tar is produced from cellulose, hemicellulose, and lignin during high temperature pyrolysis;18–20 its primary components, oxygenated compounds, mainly form at 400 °C to 600 °C.5 Further, some monocyclic aromatic compounds as well as less aromatic PAHs are produced at higher temperatures (600 °C to 1000 °C).8,21,22 Recent studies have paid more attention to the effects of biomass on biomass–coal tar at high temperature. The organic components in the biomass (cotton stalk) have a positive influence on the alkene formation of tar during high temperature co-pyrolysis (600 °C).23 In addition, added biomass (sawdust) can decrease the aromaticity of tar obtained from the pyrolysis of blends at 900 °C and increase the amounts of oxygenated groups, which contribute less to carcinogenicity.11 However, because previous studies have made many contributions to the tar formation of individual coals, biomasses or biomass–coal blends, systematic analysis of the tar formed from co-pyrolysis of coal and biomass at high temperature is still needed, especially for different biomass addition levels. This work studies the effects of biomass (poplar) on tar formation during co-pyrolysis of biomass and coal at high temperature; special attention is paid to the poplar addition levels to better optimize the production of biomass–coal tar.
This work involved three-stage absorption by butyl acetate to obtain poplar–fat coal tar during high temperature co-pyrolysis of fat coal and poplar. The resulting product yields were calculated relative to the fat coal and poplar blends. The structures of the tar samples were analyzed using gas chromatography-mass spectrometry (GC-MS), Fourier transform-infrared spectroscopy (FT-IR) and 1H nuclear magnetic resonance (1H NMR) spectroscopy. Afterwards, the influences of poplar addition on the tar formation were studied.
2 Experimental procedure
2.1 Sample preparation
A coal sample (fat coal, F, from An Steel, Northeast of China) and a biomass sample (poplar, P, from Gansu province, Northwest of China) were crushed to particles 74 to 150 μm in size. The basic properties of the samples, characterized by Chinese Standard Methods GB/T 212-2008 and GB/T 31391-2015, are described in Table 1. It should be noted that fat coal, a type of coal with high volatility, is suitable for cokemaking and tar production.24 However, the volatility of fat coal is still 50.19% less than that of poplar. The two samples were dried in a vacuum oven at 110 °C for 6 h to constant weight before the high temperature pyrolysis experiments.| Sample | F | P |
|---|---|---|
| Proximate analysis (wt%) | ||
| Moisture, air dry | 1.74 | 4.18 |
| Ash, dry | 9.61 | 5.76 |
| Volatile, dry | 28.67 | 78.86 |
| Fixed carbon, dry | 61.72 | 15.38 |
![[thin space (1/6-em)]](https://www.rsc.org/images/entities/char_2009.gif) |
||
| Ultimate analysis (dry, wt%) | ||
| Carbon | 77.27 | 45.95 |
| Hydrogen | 4.61 | 6.30 |
| Nitrogen | 1.36 | 0.18 |
| Sulphur | 1.47 | 0.13 |
| Oxygen | 5.68 | 41.92 |
| Others | 9.61 | 5.52 |
A laboratory mixer was used to homogenize blends of fat coal and poplar when poplar was introduced at 4%, 8%, 12%, 16% and 32% levels (coal basis, wt%); the blends were labeled FP4, FP8, FP12, FP16, and FP32, respectively. The individual fat coal, poplar and blend samples were subjected to a high temperature pyrolysis experiment to obtain the tar components in an electric furnace coupled with a self-made tar collecting device (described in Fig. S1†). Approximately 100 g of sample was initially placed in a corundum crucible, which was then placed into a stainless steel reaction tank in the electric furnace. Afterwards, the sample was heated from 25 °C to the target temperature of 1050 °C at a heating rate of 10 °C min−1 and maintained at 1050 °C for 30 min. Nitrogen at a flow speed of 50 mL min−1 was used to maintain the pyrolysis experiment in inert atmosphere and to remove the pyrolysis gas rapidly from the furnace to avoid interactions between the pyrolysis gas and char. The output of pyrolysis gas was determined by three-stage absorption as follows: stage I – bottle A filled with 400 mL butyl acetate, stage II – bottles B1 and B2 filled with 400 mL butyl acetate, and stage III – bottles C1 and C2 filled with 200 mL butyl acetate, to collect as much of the tar components as possible. After the sample pyrolysis and tar collection experiments, the tar components dissolved in butyl acetate in each bottle (A, B and C) were mixed homogenously and refrigerated until they were ready for analysis. The resulting tar samples were given the notations F tar, FP4 tar, FP8 tar, FP12 tar, FP16 tar, FP32 tar and P tar based on the labels of individual fat coal, the poplar–fat coal blend samples and individual poplar, respectively.
The tar, char and water yields were calculated relative to the fat coal and poplar blends. The weight of tar dissolved in butyl acetate was estimated by gravimetric analysis, as proposed by Tchapda.8 The gas yield was obtained by the difference. Furthermore, the high temperature pyrolysis and tar collection experiments were repeated three times in this work.
2.2 GC-MS analysis
GC-MS analysis was performed using a Shimadzu QP2010Ultra GC-MS system. 1 μL tar (with butyl acetate as solvent) was injected into the inlet in split injection mode at a split ratio of 30![[thin space (1/6-em)]](https://www.rsc.org/images/entities/char_2009.gif) :
:![[thin space (1/6-em)]](https://www.rsc.org/images/entities/char_2009.gif) 1 under a voltage of 70 eV. The temperature in the oven was maintained at 80 °C for 3 min, then raised to 300 °C at a heating rate of 10 °C min−1 and held at this temperature for 5 min. Helium (purity more than 99.999%) was used as a carrier gas at a current speed of 1 mL min−1 in the experiment. The chemical compounds in the tar were identified using NIST 11 library data, and their quantitative analysis was conducted using the area normalization method in GCMSsolution 4.11 (software developed by Shimadzu). Further, the peak of butyl acetate was removed after treatment.
1 under a voltage of 70 eV. The temperature in the oven was maintained at 80 °C for 3 min, then raised to 300 °C at a heating rate of 10 °C min−1 and held at this temperature for 5 min. Helium (purity more than 99.999%) was used as a carrier gas at a current speed of 1 mL min−1 in the experiment. The chemical compounds in the tar were identified using NIST 11 library data, and their quantitative analysis was conducted using the area normalization method in GCMSsolution 4.11 (software developed by Shimadzu). Further, the peak of butyl acetate was removed after treatment.
2.3 FT-IR analysis
FT-IR analysis was carried out using a Thermo Fisher Scientific Nicolet iS5 spectrometer with the KBr pellet technique. The KBr pellet was dried in a vacuum oven at 100 °C for 10 h before FT-IR analysis to avoid effects of moisture on the spectra. Approximately 1 mL of tar sample was pressed into the KBr pellets using a pipette and dried in vacuum atmosphere for 2 h. After that, the sample was measured at ambient temperature at the individual spectral segment 32 times at a resolution of 4 cm−1 with wavenumbers ranging from 4000 to 400 cm−1. The characteristic band assignments can be obtained from previous work.23,25–27 Furthermore, the detailed structure information can be obtained by the curve-fitting of two FT-IR regions (3000 to 2800 cm−1 and 1800 to 1490 cm−1). The structure parameters A-factor and CH2/CH3 can be calculated by the following equations:25–28| A-factor = (A3000–2800 cm−1)/(A3000–2800 cm−1 + A1650–1490 cm−1) | (1) |
| CH2/CH3 = (A2920 cm−1 + A2860 cm−1)/(A2950 cm−1 + A2890 cm−1) | (2) |
2.4 1H NMR analysis
1H NMR analysis was performed using a Bruker AV 500 MHz spectrometer operating at 400 HMz. 5 mL of tar samples were individually dried under vacuum atmosphere. The dried tar samples were then dissolved in 0.6 mL of the solvent tetrahydrofuran-d8 with TMS as an internal reference, i.e. THF, C4D8O, CAS no. 1693-74-9, 99.5 atom % D, contains 0.03% (v/v) TMS. To record the 1H NMR spectra of the tar samples, 64 scans were collected with a recycle delay time of 5 s. A standard one-dimensional (1D) 90° pulse sequence was used with the standard zg program from the Bruker pulse library. After that, the recorded data were imported into MestReNova 10.0 (software developed by Mestrelab Research) for data processing and analysis. The quantitative analysis of subdivisions within the regions of the tar spectra was performed using the area normalization method.3 Results and discussion
3.1 Product yields
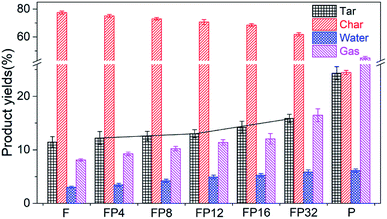
Fig. 1 shows the tar, char, water and gas yields from the co-pyrolysis of fat coal and poplar at high temperature. For the individual coal pyrolysis, the produced tar, char, water and gas yields are 11.45%, 77.44%, 3.01% and 8.10%, respectively. However, for the products of the individual poplar pyrolysis, these four yields are 24.31%, 24.46%, 6.12% and 45.11%, respectively. These product quantity differences may be due to the fact that fat coal has less volatile carbon and more fixed carbon than poplar. When the fat coal and poplar are blended, the tar yield of poplar–fat coal increases while the char yield decreases with increasing addition level of poplar. It is interesting that the increase of the tar yield is slight when the poplar addition level ranges from 4% to 12%, while it is much heavier at higher poplar addition levels. Furthermore, the water and gas yields maintain this ascending tendency as poplar is added.3.2 Tar structures of fat coal, poplar and their blends
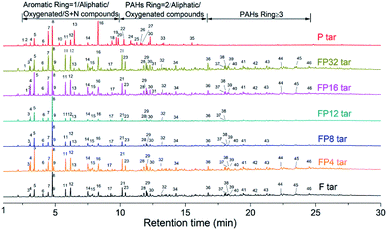
Fig. 2 shows the GC-MS spectra of the tar samples obtained from the pyrolysis of fat coal, poplar and their blends. The detailed chemical compounds obtained from GC-MS analysis are shown in Table S1.† The principal reaction pathways for the formation of the characteristic compounds are shown in Fig. 3.8,28–30 For fat coal tar, many PAHs with rings ≥ 2 can be detected, and the main reaction pathway to the formation of these PAHs is shown as route 2 in Fig. 3.8,28,29 Phenolic compounds are properly caused by the decomposition of polycyclic aromatic compounds, as shown by route 1 in Fig. 3.30 However, for the poplar tar, abundant oxygenated compounds exist. It is surprising that no low-molecular weight glucose, e.g. levoglucosan, exists in the poplar tar, which is consistent with the findings of Montiano.11 These compounds are absent because they are (a) deoxidized by other free radicals to form furan compounds7 or (b) absorbed by the water produced in the pyrolysis process and shifted further out of the range of GC-MS detection. When blended, a comparison of the tar profiles indicates that their compositions have slight differences. When the blending ratio of poplar increases from 4% to 12%, the amounts of tar compound species decrease. These lost compounds are mainly large PAHs (rings ≥ 3), which may transform into lighter components. However, the compounds in the tar have an increasing trend in the poplar blending ratio range from 12% to 32%.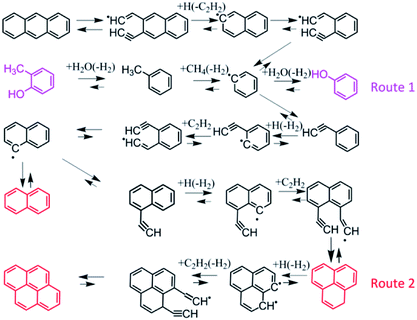 | ||
| Fig. 3 Main reaction pathways to the formation of characteristic compounds.8,28–30 | ||
In order to deeply analyze the differences between tar samples with different poplar blending ratios, the compounds obtained from GC-MS analysis were classified as (a) oxygenated compounds, including phenols, aldehydes, esters, ketones, ethers, alcohols, carboxylic acids, furan and their derivatives; (b) aromatic compounds, including naphthalene, anthracene, pyrene and their derivatives; (c) aliphatic compounds, mainly comprising all types of alkanes; (d) sulfur + nitrogenated compounds, including thiophene, indole and others. Fig. 4 shows the quantitative analysis of the four classes of compounds in the tar obtained from GC-MS analysis. The aromatic compounds made the largest contribution to fat coal tar, while the oxygenated compounds reached 96% of the poplar tar. These differences may result from the different compositions and structures of fat coal and poplar.31 From Table 1, the oxygen content in poplar can reach 41.92%, resulting in the existence of large amounts of oxygenated compounds in poplar tar. However, the chemical structure of fat coal is composed of highly substituted and condensed aromatic structures,32 resulting in large amounts of PAHs in fat coal tar during pyrolysis. When blending fat coal and poplar, oxygenated and aromatic compounds are the most abundant compounds in the tar samples. Combined with the tar yield analysis in Fig. 1, the amounts of oxygenated compounds in the tar samples improve up to a poplar addition of about 12% and then deteriorate slightly. In contrast, the aromatic compounds firstly decrease followed by a slight increase in the poplar blending ratio range from 4% to 32%.
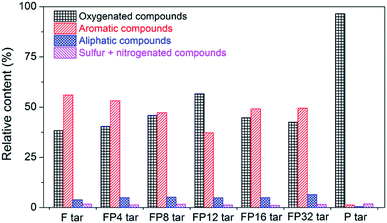 | ||
| Fig. 4 Quantitative analysis of four kinds of compounds in tar samples obtained from GC-MS analysis. | ||
Because the transformation of oxygenated and aromatic compounds in tar contributes greatly to the changes in the FP tar, more detailed statistical analysis and classification of these two kinds of compounds were conducted; this is described in Fig. 5. Fig. 5(a) shows the four kinds of oxygenated compounds in the tar samples. With increasing poplar blending ratio, the amounts of phenol and its derivatives firstly decrease and then increase, while the amounts of alcohols/ethers/esters and their derivatives show the opposite trend. Ketones/aldehydes, furan/pyran and their derivatives maintained low levels in all the tar samples. The aromatic compounds were classified based on the aromatic rings in the components, and the details are shown in Fig. 5(b). Benzene, naphthalene, anthracene/phenanthrene, pyrene and their derivatives make strong contributions to the fat coal and FP tar samples. With increasing poplar blending ratio, the amounts of these four kinds of compounds decline initially and then rise. Furthermore, these results are useful for understanding the changes in poplar–fat coal tar yields with different poplar addition levels. When the blending ratios range from 4% to 12%, the added poplar increases the quantity of light components and decreases the amount of PAHs; thus, the tar yields increase slightly even though the tar yield of poplar is much larger than that of fat coal, which was also proved by other work.11 However, due to the increasing quantity of PAHs at higher addition levels, the tar yields rise much more.
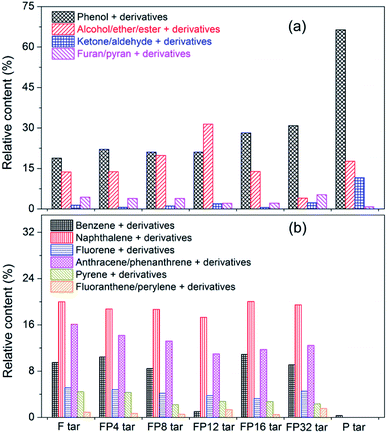 | ||
| Fig. 5 Quantitative analysis of the classification of compounds of oxygenated and aromatic compounds in tar obtained from GC-MS analysis: (a) oxygenated compounds, (b) aromatic compounds. | ||
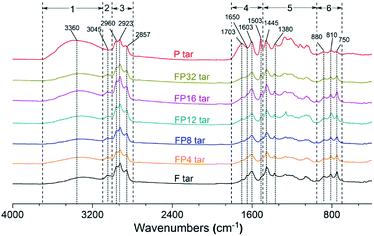
Fig. 6 shows the FT-IR spectra of tar samples obtained from fat coal, poplar and their blends. The characteristic band at 3700 to 3100 cm−1 is related to the –OH stretching in phenol and its derivatives. A small peak located at 3045 cm−1 is attributed to the aromatic C–H stretching vibration. The 3000 to 2800 cm−1 region corresponds to aliphatic C–H stretching vibrations, e.g. aliphatic CH2 and CH3 stretching vibrations. The region from 1800 to 1490 cm−1 is dominated by C![[double bond, length as m-dash]](https://www.rsc.org/images/entities/char_e001.gif) O, which is present in aldehydes, carboxylic acids, and ketones, and by aromatic C
O, which is present in aldehydes, carboxylic acids, and ketones, and by aromatic C![[double bond, length as m-dash]](https://www.rsc.org/images/entities/char_e001.gif) C. Several peaks in the 1490 to 950 cm−1 region in the tar samples, which result from aromatic ether C–O–C, phenol C–O, and ester C–O–O–C stretching vibrations and aliphatic ether C–O–C and alcohol C–O stretching vibrations, showed relatively low levels except in poplar tar, which agrees with the GC-MS analysis. Many low peaks from 950 to 700 cm−1 are related to aromatic C–H out-of-plane deformation vibrations.
C. Several peaks in the 1490 to 950 cm−1 region in the tar samples, which result from aromatic ether C–O–C, phenol C–O, and ester C–O–O–C stretching vibrations and aliphatic ether C–O–C and alcohol C–O stretching vibrations, showed relatively low levels except in poplar tar, which agrees with the GC-MS analysis. Many low peaks from 950 to 700 cm−1 are related to aromatic C–H out-of-plane deformation vibrations.
Two regions, from 3000 to 2800 cm−1 and 1800 to 1490 cm−1, were used to investigate the structure characteristics of the tar samples in this work. Detailed structural parameters, namely A-factor and CH2/CH3, can be obtained from curve-fitting of these regions and eqn (1) and (2), and the results are shown in Fig. 7. It can be seen that the A-factor of fat coal tar is smaller than that of poplar tar, while CH2/CH3 of fat coal tar is larger; this indicates that fat coal tar has lower hydrocarbon-generating potential and longer aliphatic chain lengths than poplar tar. For FP tar samples, the value of the A-factor rises firstly and then declines at higher poplar blending ratios. This indicates that the hydrocarbon-generating potential of the tar samples improves initially and then weakens at higher poplar blending ratios. Furthermore, the value of CH2/CH3 decreases initially and then increases later, implying that the aliphatic chain lengths of the tar samples shorten with poplar blending ratios ranging from 4% to 12% and then extend at higher blending ratios. Combined with the results from GC-MS and previous work, it can be concluded that when fat coal and poplar blends are heated during pyrolysis, depolymerization reactions cause the rupture of weaker branched chain bridges in the coal macromolecules and cellulose, hemicellulose, and lignin of poplar, and these release smaller aromatic, oxygenated, aliphatic and hydrogen radicals.8,33,34 These radicals can produce low molecular weight molecules such as m-xylene, phenol, and tetradecane in the tar and ethylene and acetylene in the released gas.33,35 Many studies have confirmed that synergistic effects occur in the co-pyrolysis of fat coal and poplar, which results in a higher depolymerization reaction rate and lower polymerization reaction rate during this process.36–38 This would improve the hydrocarbon-generating potential and shorten the aliphatic chain length at low poplar blending ratios. However, when the poplar blending ratio is over 12%, the synergistic effects may decrease because no more radicals are produced from fat coal pyrolysis. Consequently, large amounts of excess radicals resulting from poplar pyrolysis exist and undergo cross-linking reactions, which weakens the hydrocarbon-generating potential and extends the aliphatic chain lengths of the tar samples.
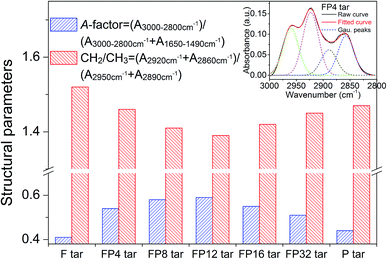 | ||
| Fig. 7 Structural parameters of tar samples obtained from curve-fitting of the 3000 to 2800 cm−1 and 1800 to 1490 cm−1 regions. | ||
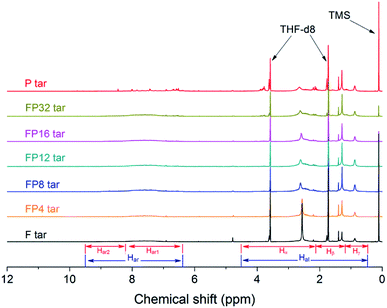
Fig. 8 shows the 1H-NMR spectra of tar samples obtained from the pyrolysis of fat coal, poplar and their blends. Two large sections of protons, namely aromatic and aliphatic protons, can be seen in the ranges of 9.5 to 6.3 ppm and 4.5 to 0.5 ppm, respectively. In this work, the aromatic and aliphatic protons are divided into several parts to provide detailed structure information,28,39 as shown in Table S2.† However, a few protons exist in the 6.3 to 4.5 ppm range, indicating traces of alkenes and their derivatives in the tar samples; this result can be confirmed by the GC-MS analysis.
Table 2 shows the percentages of the subdivisions within the regions of the tar spectra. The Har in fat coal tar is larger than that in poplar tar because the much more abundant aromatic hydrogens are sterically hindered in fat coal tar. As identified by GC-MS, these substances are mainly anthracene, phenanthrene, pyrene, chrysene and their derivatives. The relative content of Hal in fat coal tar is 12.40% less than that in poplar tar, which may be due to the differences in Hβ and Hγ. This indicates that the component in fat coal tar has longer aliphatic chain lengths than that in poplar tar, which is consistent with the results from the FT-IR analysis. Furthermore, the amounts of Hα in fat coal tar are greater than in poplar tar, implying that there are many more methyl-substituted compounds in fat coal tar. When blending fat coal and poplar, the quantity of Har containing Har1 and Har2 decreases firstly, followed by an increase; this indicates that the amounts of PAHs and other aromatic compounds decline initially and then rise later. The proton ratios of Hα decrease in the poplar blending ratio range from 4% to 12% and increase at higher blending ratios, while the ratios of Hγ show the opposite effect; this is in keeping with the change trends of the chemical compounds confirmed by GC-MS.
| H type | F tar | FP4 tar | FP8 tar | FP12 tar | FP16 tar | FP32 tar | P tar |
|---|---|---|---|---|---|---|---|
| Har | 26.65 | 33.51 | 31.45 | 26.85 | 29.70 | 32.46 | 14.25 |
| Har2 | 10.96 | 10.43 | 9.36 | 6.12 | 8.25 | 10.02 | 2.01 |
| Har1 | 15.69 | 23.08 | 22.09 | 20.73 | 21.45 | 22.44 | 12.24 |
| Hal | 73.35 | 66.49 | 68.55 | 73.15 | 70.30 | 67.54 | 85.75 |
| Hα | 44.11 | 37.43 | 35.93 | 33.15 | 36.63 | 37.47 | 36.10 |
| Hβ | 21.99 | 17.84 | 17.76 | 20.89 | 17.90 | 17.94 | 32.88 |
| Hγ | 7.25 | 11.22 | 14.86 | 19.11 | 15.77 | 12.13 | 16.77 |
3.3 Effects of poplar on tar formation during co-pyrolysis of fat coal and poplar at high temperature
Biomass–coal tar is a mixture produced from the individual pyrolysis of coal and biomass and the co-pyrolysis between them due to the synergistic effects. To understand the structure formation of biomass–coal tar, the tars from the individual coal and biomass should be analyzed initially. Coal is essentially a mixture of an organic coal matrix and mineral matter. Further, the organic matrix is well known to possess a macromolecular skeleton structure with embedded low molecular weight compounds. When heated, the bridges linked between these compounds and the macromolecular skeleton break and release smaller fragments of radicals and hydrogen. Further, these fragments are stabilized by each other and are transported into the coal tar by diffusion among the pores in the non-softening coal and fluid phase or bubble transport in the softening coal.11,33 From the results of GC-MS and FT-IR and 1H NMR spectroscopy, the components in fat coal tar are PAHs, phenolics and aliphatic compounds. Biomass is mainly composed of cellulose, hemicellulose, lignin and minerals. Cellulose can be regarded as a glucose polymer with β-1,4 linkages of D-glucopyranose monomers.40,41 Further, the side chains of cellulose possess abundant hydrogen bonds because the aliphatic hydrogen is in the axial position.42 When pyrolyzed, large numbers of radicals and hydrogen form and then combine with each other to produce light molecules. Hemicellulose is composed of various polymerized monosaccharides with abundant short side chains.42,43 The short side chains linked to the main polymeric chain may be broken and converted to light aliphatic radicals in the pyrolysis process, which makes a great contribution to the low molecular aliphatic compounds. Lignin is a highly branched aromatic substance with embedded hydroxyl and methoxyl compounds.42,44 It may be the source of the oxygenated compounds in the tar, e.g. monophenols.45 In addition, the tar components in the biomass are a combination of the products of individual and coupled pyrolysis of these three organic substances. From the GC-MS, FT-IR and 1H NMR analysis, the compounds in poplar tar are mainly furan aldehydes, furfuryl alcohol, esters, and phenolics, which agrees with previous work.17,42,45,46When blending fat coal and poplar, the tar components show an obvious change due to the synergistic effects during co-pyrolysis of fat coal and poplar. Fig. 9 shows the effects of poplar addition on the tar formation during the co-pyrolysis of fat coal and poplar.8,17,28–30,40–46 The coal macromolecular structure is based on the 3D Wiser model constructed by Materials Studio.28 Meanwhile, the poplar structure originates from the analysis in previous studies.17,40–46 During heating, the blends produce much greater amounts of free radicals (aromatic, oxygenated, aliphatic) and hydrogen than single fat coal and poplar because of synergistic effects. The tar formation can be divided into two stages based on the different poplar addition levels: (a) lighten the tar by stabilizing radicals at low poplar addition levels, (b) form heavier tar due to cross-linking reactions of the remaining radicals at high poplar addition levels.
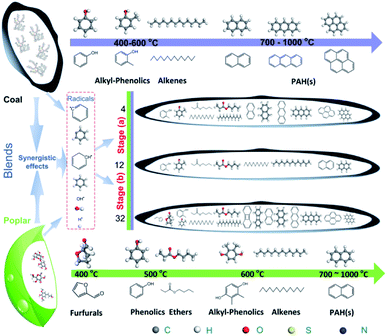 | ||
| Fig. 9 Effects of poplar addition on tar formation during co-pyrolysis of fat coal and poplar at high temperature.8,17,28–30,40–46 | ||
In stage (a), when the poplar blending ratio is at a low level, the free hydrogenous radicals resulting from the co-pyrolysis of fat coal and poplar will combine with each other and produce lighter stable compounds, mainly alcohols, ethers, esters and their derivatives, which are then transported into coal tar by vaporization and gas phase diffusion. The larger the addition of poplar, the stronger the synergistic effects between fat coal and poplar, and the greater the amount of lighter stable compounds formed. This result increases the amounts of alcohols/ethers/esters and their derivatives. During this stage, the cross-linking reactions decrease because the coal molecular fragments are stabilized by the free hydrogen produced from poplar, which causes the content of PAHs to decrease. Further, the tar yield rises slightly, although the tar yield of poplar is much larger than that of fat coal. Consequently, the hydrocarbon-generating potential improves, the aliphatic chain length shortens and the aromatic protons decrease.
In stage (b), as the poplar blending ratio increases from 12% to 32%, a large amount of excess free radicals exists after stabilizing the coal molecular fragments in the co-pyrolysis process. The higher the poplar blending ratio, the weaker the synergistic effects that occur, and the more free radicals remain. These radicals can undergo cross-linking reactions and produce larger molecules, such as naphthalene, anthracene/phenanthrene and their derivatives; this causes the relative content of PAHs to increase and the tar yield to greatly rise. These changes result in weakened hydrocarbon-generating potential, extended aliphatic chain lengths and increased aromatic protons.
4 Conclusions
This work involved the use of three-stage absorption by butyl acetate to collect tar during the pyrolysis of fat coal, poplar and their blends at high temperature. The tar yields were calculated relative to the fat coal and poplar blends. The structure information of the tar samples was analyzed by GC-MS and FT-IR and 1H NMR spectroscopy, and the influences of poplar on tar formation were then discussed. The poplar–fat coal tar was mainly composed of oxygenated and aromatic compounds. The quantity of oxygenated components increased with increasing poplar blending ratio from 4% to 12% and then decreased at higher blending ratios, while the quantity of aromatic components showed the opposite trend. These changes caused the tar yields to rise slightly and then much more heavily when the poplar addition levels ranged from 4% to 32%. The effects of added poplar on tar formation can be divided into two stages: (a) lighten the tar by stabilizing radicals at low poplar addition levels, (b) form heavier tar by cross-linking reactions of the remaining radicals at high poplar addition levels. As the poplar addition increased from 4% to 12%, lighter stable compounds generated from the free radicals and hydrogen were transported into the tar. Further, the cross-linking reactions were decreased because of fewer free radicals and less hydrogen in this system. This resulted in decreased PAHs, slightly increased tar yields, improved hydrocarbon-generating potential, shortened aliphatic chain lengths and decreased aromatic protons. At higher blending ratios, the large poplar addition levels caused some excess free radicals to remain in the blending system. These radicals could undergo cross-linking reactions and produce larger molecules, which resulted in increased PAHs, greatly increased tar yields, weakened hydrocarbon-generating potential, extended aliphatic chain lengths and increased aromatic protons.Conflicts of interest
There are no conflicts to declare.Acknowledgements
This work was supported by the National Natural Science Foundation of China (Grant No. 51474042 & 51774061), the Fundamental Research Funds for the Central Universities (Grant No. 106112017CDJQJ138801), the Fund of Chongqing Science and Technology (Project No. cstc2018jscx-msyb0988) and the China Scholarship Council. The authors also thank Chongqing University and The University of Alabama for providing the experimental and analytical facilities for this research work.Notes and references
- M. Sun, J. Chen, X. M. Dai, X. L. Zhao, K. Liu and X. X. Ma, Fuel Process. Technol., 2015, 136, 41–49 CrossRef CAS.
- T. P. Vispute, H. Zhang, A. Sanna, R. Xiao and G. W. Huber, Science, 2010, 330, 1222–1227 CrossRef CAS PubMed.
- H. A. Al-Ismaily and D. Probert, Appl. Energy, 1997, 58, 131–160 CrossRef CAS.
- S. Liu, D. Mei, L. Wang and X. Tu, Chem. Eng. J., 2017, 307, 793–802 CrossRef CAS.
- C. F. Palma, Appl. Energy, 2013, 111, 129–141 CrossRef.
- J. Han and H. Kim, Renewable Sustainable Energy Rev., 2008, 12, 397–416 CrossRef CAS.
- C. Gai, Y. Dong, S. Yang, Z. Zhang, J. Liang and J. Li, RSC Adv., 2016, 86, 83154–83162 RSC.
- A. H. Tchapda, V. Krishnamoorthy, Y. D. Yeboah and S. V. Pisupati, J. Anal. Appl. Pyrolysis, 2017, 128, 379–396 CrossRef CAS.
- D. Mohan, C. U. Pittman and P. H. Steele, Energy Fuels, 2006, 20, 848–889 CrossRef CAS.
- S. Xiu and A. Shahbazi, Renewable Sustainable Energy Rev., 2012, 16, 4406–4414 CrossRef CAS.
- M. G. Montiano, A. Fernández, E. Díaz-Faes and C. Barriocanal, Fuel, 2015, 15, 4261–4267 Search PubMed.
- S. A. Wise, B. A. Benner, G. D. Byrd, S. N. Chesler, R. E. Rebbert and M. M. Schantz, Anal. Chem., 1988, 60, 887–894 CrossRef CAS.
- N. T. Weiland, N. C. Means and B. D. Morreale, Fuel, 2012, 94, 563–570 CrossRef CAS.
- J. Hayashi, T. Kawakami, K. Kusakabe and S. Morooka, Energy Fuels, 1993, 7, 1118–1122 CrossRef CAS.
- P. Wang, L. Jin, J. Liu, S. Zhu and H. Hu, Fuel, 2013, 104, 14–21 CrossRef CAS.
- L. Petrakis and D. W. Grandy, Nature, 1981, 289, 476 CrossRef CAS.
- L. Liang, W. Huang, F. Gao, X. Hao, Z. Zhang, Q. Zhang and G. Guan, RSC Adv., 2015, 4, 2493–2503 RSC.
- P. Morf, P. Hasler and T. Nussbaumer, Fuel, 2002, 81, 843–853 CrossRef CAS.
- W. He, Q. Liu, L. Shi, Z. Liu, D. Ci, C. Lievens, X. Guo and M. Liu, Bioresour. Technol., 2014, 156, 372–375 CrossRef CAS PubMed.
- D. Shen, R. Xiao, S. Gu and K. Luo, RSC Adv., 2011, 9, 1641–1660 RSC.
- Y. Zhang, S. Kajitani, M. Ashizawa and Y. Oki, Fuel, 2010, 89, 302–309 CrossRef CAS.
- H. Zhou, C. Wu, J. A. Onwudili, A. Meng, Y. Zhang and P. A. Williams, RSC Adv., 2015, 5, 11371–11377 RSC.
- C. Tang, D. Zhang and X. Lu, BioResources, 2015, 4, 7667–7680 Search PubMed.
- H. Shui, W. Zhao, C. Shan, T. Shui, C. Pan, Z. Wang, Z. Lei, S. Ren and S. Kang, Fuel Process. Technol., 2014, 118, 64–68 CrossRef CAS.
- S. Dutta, C. Hartkopf-Fröder, K. Witte, R. Brocke and U. Mann, Int. J. Coal Geol., 2013, 115, 13–23 CrossRef CAS.
- W. Li and Y. Zhu, Energy Fuels, 2014, 28, 3645–3654 CrossRef CAS.
- H. H. Xin, D. M. Wang, X. Y. Qi, G. S. Qi and G. L. Dou, Fuel Process. Technol., 2014, 118, 287–295 CrossRef CAS.
- S. Qiu, S. Zhang, Y. Wu, G. Qiu, C. Sun, Q. Zhang, J. Dang, L. Wen, M. Hu, J. Xu, R. Zhu and C. Bai, Fuel, 2018, 232, 374–383 CrossRef CAS.
- R. J. Evans and T. A. Milne, Energy Fuels, 1987, 1, 123–137 CrossRef CAS.
- Y. He, R. Zhao, L. Yan, Y. Bai and F. Li, J. Anal. Appl. Pyrolysis, 2017, 123, 49–55 CrossRef CAS.
- K. Slopiecka, P. Bartocci and F. Fantozzi, Appl. Energy, 2012, 97, 491–497 CrossRef CAS.
- S. Qiu, S. Zhang, R. Zhu, Y. Wu, G. Qiu, J. Dang, L. Wen, M. Hu and C. Bai, Int. J. Coal Prep. Util., 2018 DOI:10.1080/19392699.2018.1496913.
- K. Miura, Fuel Process. Technol., 2000, 62, 119–135 CrossRef CAS.
- M. Liu, J. Yang, Z. Liu, W. He, Q. Liu, Y. Li and Y. Yang, Energy Fuels, 2015, 29, 5773–5780 CrossRef CAS.
- S. Qiu, S. Zhang, X. Zhou, Q. Zhang, G. Qiu, M. Hu, Z. You, L. Wen and C. Bai, Renewable Energy, 2019, 136, 308–316 CrossRef CAS.
- S. Matsuoka, H. Kawamoto and S. Saka, J. Anal. Appl. Pyrolysis, 2014, 106, 138–146 CrossRef CAS.
- H. Haykiri-Acma and S. Yaman, Renewable Energy, 2010, 35, 288–292 CrossRef CAS.
- Z. Wu, S. Wang, J. Zhao, L. Chen and H. Meng, Bioresour. Technol., 2014, 169, 220–228 CrossRef CAS PubMed.
- M. D. Guillén, C. Díaz and C. G. Blanco, Fuel Process. Technol., 1998, 58, 1–15 CrossRef.
- M. J. Climent, A. Corma and S. Iborra, Green Chem., 2014, 16, 516–547 RSC.
- G. W. Huber, S. Iborra and A. Corma, Chem. Rev., 2006, 106, 4044–4098 CrossRef CAS PubMed.
- D. Mohan, C. U. Pittman and P. H. Steele, Energy Fuels, 2006, 20, 848–889 CrossRef CAS.
- K. Dussan, S. Dooley and R. Monaghan, Chem. Eng. J., 2017, 328, 943–961 CrossRef CAS.
- D. M. Alonso, J. Q. Bond and J. A. Dumesic, Green Chem., 2010, 12, 1493–1513 RSC.
- Z. Jiang and C. Hu, J. Energy Chem., 2016, 6, 947–956 CrossRef.
- C. Amen-Chen, H. Pakdel and C. Roy, Biomass Bioenergy, 1997, 13, 25–37 CrossRef CAS.
Footnote |
| † Electronic supplementary information (ESI) available: Chemical compounds in tar from fat coal, poplar and their blends obtained from GC-MS analysis; schematic diagram of self-made tar collecting device; band assignments of proton types in 1H NMR spectra. See DOI: 10.1039/c9ra03938d |
| This journal is © The Royal Society of Chemistry 2019 |

