 Open Access Article
Synthesis of a high-surface area V2O5/TiO2–SiO2 catalyst and its application in the visible light photocatalytic degradation of methylene blue†
Ajay Kumar Adepu,
Srinath Goskula,
Suman Chirra,
Suresh Siliveri,
Sripal Reddy Gujjula and
Venkatathri Narayanan *
*
Department of Chemistry, National Institute of Technology, Warangal 506 004, Telangana, India. E-mail: venkatathrin@yahoo.com; Tel: +91-9491319976
First published on 6th August 2019
Abstract
In the present study, we synthesized several high-surface area V2O5/TiO2–SiO2 catalysts (vanado titanium silicate, VTS). The synthesized materials were characterized by PXRD, FE-SEM/EDAX, TEM, FTIR, UV-Vis, XPS, fluorescence and photocatalytic activity studies. The small-angle powder X-ray diffraction pattern shows that the 110 and 200 planes are merged to become a single broad peak. Field-emission scanning electron microscopy shows that the titanosilicate is spherical in shape and V2O5 has a hexagonal rod-shaped morphology. The presence of various metal ions, such as V, Ti, Si and O, was observed by energy dispersive X-ray analysis and X-ray photoelectron spectroscopy. The transmission electron microscopy image shows clear hexagonal mesoporous fringes with V2O5 distribution. The BET surface area analysis shows that the VTS catalysts have higher surface areas than pure V2O5. Fourier transform infrared spectroscopic analysis shows the presence of Ti4+ ions connected to the silanol groups. The bandwidths of pure titanosilicate, V2O5 and their composites were calculated from their diffuse reflectance ultraviolet-visible spectra. The bandwidth was tuned by heterojunctions in the studied catalysts. The photoluminescence spectra of the VTS catalysts show a distinct behaviour as compared to those of the pure components. The photocatalytic activity of methylene blue degradation was determined with pure constituents and catalysts. VTS-1 (TS and VO weight ratio 2![[thin space (1/6-em)]](https://www.rsc.org/images/entities/char_2009.gif) :
:![[thin space (1/6-em)]](https://www.rsc.org/images/entities/char_2009.gif) 1) shows higher conversion than other catalysts, pure titanosilicate and V2O5. This is probably due to the heterojunctions and higher surface area in VTS-1. Kinetic studies reveal that direct sunlight shows higher activity than pure visible light. A plausible physical and chemical mechanism for the photocatalytic activity is proposed.
1) shows higher conversion than other catalysts, pure titanosilicate and V2O5. This is probably due to the heterojunctions and higher surface area in VTS-1. Kinetic studies reveal that direct sunlight shows higher activity than pure visible light. A plausible physical and chemical mechanism for the photocatalytic activity is proposed.
1. Introduction
In recent years, the use of semiconductor-based materials as photocatalysts has become the most exciting multidisciplinary research area in the fields of materials, energy, and environmental technology because of the potential use of this technology in the degradation of organic pollutants, hydrogen production by the splitting of water, and the conversion of carbon dioxide into hydrocarbons using light energy.1–5 These applications play significant roles in addressing the current environmental problems and the energy crisis. In semiconductor-based photocatalysis, the photocatalyst absorbs light energy, which is equal to or greater than the bandgap of the photocatalyst. In this phenomenon, electron–hole pairs are generated and migrate to the surface of the photocatalyst, where the oxidation and reduction reactions occur.6–9 In general, most photocatalysts are still limited to electron–hole pair generation due to the absorption of only UV light, which is very inefficient for the absorption of photons and high recombination of electron–hole pairs. To overcome these problems, several efforts, such as metal doping, doping with another semiconductor and loading of a co-catalyst, have been made to improve the performance of photocatalysts.7,10–12 Therefore, the development of efficient and recyclable visible light-driven photocatalysts is a current need.13–16Vanadium pentoxide (VO) has unique characteristics; therefore, it is exploited for various applications such as in catalysts, actuators, sensors, photocatalysis, UV-driven reversible switches and lithium-ion electrode materials.17–21 Recently, Fei et al. synthesized VO hollow spheres via a solvothermal method, and the obtained hollow spheres were calcined.20 The results showed that VO hollow spheres enabled excellent photodegradation of Rh-B under UV-light irradiation. Liu et al. synthesized VO/titania photocatalysts via a binary sol–gel method and an in situ intercalation method; they confirmed that VO crystallites on the surface of titania could efficiently improve the photocatalytic performance of VO/titania in MB degradation in the UV light region.21 VO photocatalysts have been studied widely due to the strong oxidizing power of VO and its long-term stability against photochemical decay and chemical inertness.22–25 However, the experimental application of VO is limited, and the structure of well-defined g-C3N4/VO heterostructures has been shown to be useful for separating and carrying photogenerated carriers and, thus, for improvement of visible-light-driven photocatalysis.26
Porous titanosilicate (TS) and titanium dioxide are semiconductors that have similar energy bandgaps. Porous titanosilicate was successfully synthesized using a template by a hydrothermal method.27 Titanosilicate has been used to catalyze the oxidation of aromatic compounds, olefins and alcohols using hydrogen peroxide.28–31 Titanosilicate is also suitable for photodegradation experiments when it is combined with other materials, wherein titanosilicate shows diverse photochemical benefits.32–34 D. Ljubas et al. reported MB dye removal from water under UV light irradiation using titanosilicate/reduced graphene oxide composites.10 The synthesis of V2O5/TiO2–SiO2 composites was reported by two different authors. The reported materials have lower surface areas.35,36 It is known that pure VO, porous titanosilicate or their chemical mixture produce negligible catalytic activity at room temperature for C–H oxidation and C–C bond breakage. However, they demonstrate the above activity in the gas phase or at higher temperatures, which require special reaction setups. In this report, we have carried out photochemical methylene blue degradation using a new mesoporous and high surface area VO/TiO2–SiO2 catalyst at room temperature. Because the proposed composite materials are mesoporous, the adsorption/desorption of bulky organic dye molecules is more facile, which is expected to enhance the degradation rate. The synthesized catalysts are characterized by various advanced analytical techniques. A plausible physical and chemical mechanism of the catalytic activity is also proposed.
2. Experimental
2.1. Materials
Tetraethyl orthosilicate (TEOS, 98.0%, Sigma-Aldrich) and titanium isopropoxide (TTIP, 97.0%, Sigma-Aldrich), tetrahydrofuran (THF, 98.0%, SD fine), oxalic acid (OA, 99.0%, SD Fine Chemicals), ammonium vanadate (NH4VO3, 98.0%, SD Fine Chemicals), cetyltrimethylammonium bromide (CTAB, 98.0%, SD fine) and ammonia solution (25%, SD Fine Chemicals) were used as received without further purification.2.2. Preparation of V2O5/TiO2–SiO2 nanocomposite catalysts
Porous titanosilicate (TiO2–SiO2): an aqueous solution of CTAB and NH3 was stirred for 1 h at room temperature until the mixture became homogeneous. A calculated amount of tetraethyl orthosilicate (TEOS) was added dropwise to this mixture under vigorous stirring, followed by the addition of a predetermined amount of titanium tetraisopropoxide (TTIP); this mixture was stirred for 6 h. The final molar gel composition was CTAB![[thin space (1/6-em)]](https://www.rsc.org/images/entities/char_2009.gif) :
:![[thin space (1/6-em)]](https://www.rsc.org/images/entities/char_2009.gif) 3.32 TTIP
3.32 TTIP![[thin space (1/6-em)]](https://www.rsc.org/images/entities/char_2009.gif) :
:![[thin space (1/6-em)]](https://www.rsc.org/images/entities/char_2009.gif) 6.14 TEOS
6.14 TEOS![[thin space (1/6-em)]](https://www.rsc.org/images/entities/char_2009.gif) :
:![[thin space (1/6-em)]](https://www.rsc.org/images/entities/char_2009.gif) 28.55 NH3
28.55 NH3![[thin space (1/6-em)]](https://www.rsc.org/images/entities/char_2009.gif) :
:![[thin space (1/6-em)]](https://www.rsc.org/images/entities/char_2009.gif) 24.75 H2O. The suspension was transferred into a 100 mL Teflon-lined stainless steel autoclave and heated at 100 °C for 12 h. The product was collected by centrifugation, washed several times with deionized water and absolute methanol and dried at 80 °C overnight. The resulting powder was calcined at 550 °C for 6 h in a programmable tubular furnace in the presence of air. V2O5 (VO): to synthesize VO, 0.01 mol OA was added to a mixture of 25 mL deionized water and 5 mL tetrahydrofuran. Then, 0.005 mol NH4VO3 was added to the mixture under stirring for 2 h at RT. The reaction mixture was transferred to a 250 mL Teflon-lined autoclave and crystallized at 180 °C for 24 h. The solid product was centrifuged, washed with deionized water and ethanol, and dried at 60 °C for 12 h. The dried sample was calcined at 500 °C for 2 h. V2O5/TiO2–SiO2
24.75 H2O. The suspension was transferred into a 100 mL Teflon-lined stainless steel autoclave and heated at 100 °C for 12 h. The product was collected by centrifugation, washed several times with deionized water and absolute methanol and dried at 80 °C overnight. The resulting powder was calcined at 550 °C for 6 h in a programmable tubular furnace in the presence of air. V2O5 (VO): to synthesize VO, 0.01 mol OA was added to a mixture of 25 mL deionized water and 5 mL tetrahydrofuran. Then, 0.005 mol NH4VO3 was added to the mixture under stirring for 2 h at RT. The reaction mixture was transferred to a 250 mL Teflon-lined autoclave and crystallized at 180 °C for 24 h. The solid product was centrifuged, washed with deionized water and ethanol, and dried at 60 °C for 12 h. The dried sample was calcined at 500 °C for 2 h. V2O5/TiO2–SiO2![[thin space (1/6-em)]](https://www.rsc.org/images/entities/char_2009.gif) :
:![[thin space (1/6-em)]](https://www.rsc.org/images/entities/char_2009.gif) VO and TS were added to 50 mL of methanol in a glass beaker and ultrasonicated for 45 min. The products were dried at 80 °C.11 VTS hybrid catalysts with different weight ratios, namely VTS-1 (TS and VO weight ratio 2
VO and TS were added to 50 mL of methanol in a glass beaker and ultrasonicated for 45 min. The products were dried at 80 °C.11 VTS hybrid catalysts with different weight ratios, namely VTS-1 (TS and VO weight ratio 2![[thin space (1/6-em)]](https://www.rsc.org/images/entities/char_2009.gif) :
:![[thin space (1/6-em)]](https://www.rsc.org/images/entities/char_2009.gif) 1), VTS-2 (TS and VO weight ratio 1
1), VTS-2 (TS and VO weight ratio 1![[thin space (1/6-em)]](https://www.rsc.org/images/entities/char_2009.gif) :
:![[thin space (1/6-em)]](https://www.rsc.org/images/entities/char_2009.gif) 1) and VTS-3 (TS and VO weight ratio 1
1) and VTS-3 (TS and VO weight ratio 1![[thin space (1/6-em)]](https://www.rsc.org/images/entities/char_2009.gif) :
:![[thin space (1/6-em)]](https://www.rsc.org/images/entities/char_2009.gif) 2), were prepared.
2), were prepared.
2.3. Characterization
The X-ray diffraction (XRD) patterns were recorded on an X-ray diffractometer (Model: X'pert Powder, PANalytical B.V., Netherlands) using Ni-filtered Cu Kα, λ = 1.5406 Å radiation in the 2θ range between 1° and 80°. The particle sizes, shapes and compositions of the samples were investigated by field emission scanning electron microscopy-energy dispersive spectroscopy (INCAx-act, OXFORD Instruments, UK). The transmission electron microscopic analysis was carried out on a transmission electron microscope (FEI Tecnai G2 Spirit, Netherlands) with an acceleration voltage of 200 kV. The surface area measurements were recorded using a Quantachrome NOVA 1200e analyzer (USA) at liquid nitrogen temperature. Fourier transform infrared spectra were acquired with a Spectrum 100 (PerkinElmer, USA) using the KBr pellet technique in the 400 to 4000 cm−1 range. UV-Vis diffuse reflectance spectra were obtained using an Evolution 600 spectrophotometer (Thermo Scientific, USA), and BaSO4 was used as a reference. The photoluminescence spectra of the samples were obtained on a TSC Solutions fluorescence spectrophotometer (F96, China) at an excitation wavelength of 365 nm. The X-ray photoelectron spectroscopic analysis was carried out on a VG Microtech Multilab ESCA 3000 spectrometer (UK) using Mg-Kα 91![[thin space (1/6-em)]](https://www.rsc.org/images/entities/char_2009.gif) 253.6 eV radiation as the excitation source.
253.6 eV radiation as the excitation source.
2.4. Photocatalytic activity tests
The photocatalytic performance of the catalysts was evaluated by MB degradation under sunlight irradiation at pH 7 at varying temperatures from 25 °C to 35 °C.40 50 mg of VTS photocatalyst was added to 100 mL of MB solution (10−4 M). To reach the adsorption equilibrium, the experiment was carried out in dark conditions for 30 min. During the photocatalytic experiment, the solution was collected at various times, and the photocatalyst was separated from the solution by centrifugation. The absorbances of the collected samples were verified using a Thermo Fisher UV-Visible spectrophotometer.3. Results and discussion
3.1. Powder X-ray diffraction pattern
Fig. S1† shows the small angle PXRD pattern of TS and the wide-angle PXRD patterns of pure VO, pure titanosilicate, and the VTS-1, VTS-2 and VTS-3 hybrid catalysts. A single, highly intense peak at around 2.5° in the small angle XRD pattern is ascribed to the 100 plane of the mesoporous materials. However, the other two planes, 110 and 200, are probably merged in a broad peak. For VO, strong peaks were detected at 2θ values of 15.46, 20.36, 21.8, 25.56, 26.22, 31.10, 32.42, 33.40, 34.41, 36.16, 37.48 and 41.36°. According to the literature data of JCPDS-41-1426, the 2θ values resemble those of the orthorhombic crystal structure of VO with unit cell dimensions of 11.516 × 3.5656 × 4.3727. The high crystallinity and good arrangement of the crystal lattice of VO are indicated by the noise-free, sharp peaks.37 A broad peak centred at 23° was ascribed to the partially amorphous nature of mesoporous TS. No impurity peaks of any other phases were found.13 Due to the high-intensity peaks of VO at the same 2θ value of TS, the amorphous TS peak could not be found in the PXRD patterns of the VTS catalysts.383.2. Field-emission scanning electron microscopy/energy dispersive X-ray analysis
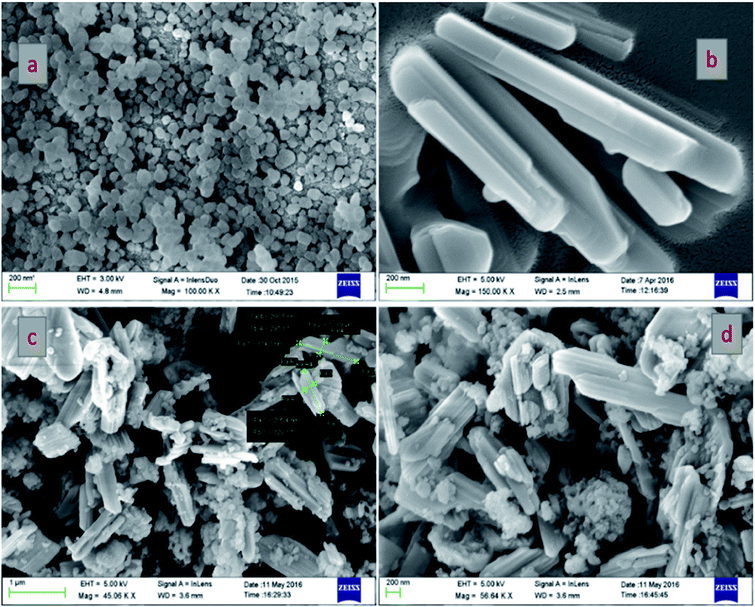
The morphological structures of pure TS, pure VO and the VTS catalysts were analyzed by FE-SEM analysis, as shown in Fig. 1. Fig. 1a shows the image of pure TS, with uniform distribution of spherical particles. Fig. 1b presents the nanorod-like structures of pure VO; the average grain size was found to be 318 nm. Fig. 1(c and d) show the VTS-1 catalyst, which clearly emphasises the successful distribution of TS particles on the VO nanorods. The tightly packed surface morphology of the composite particles is beneficial for efficient charge carrier separation. Fig. 2 shows the EDS analysis of VTS-1, which is composed of elements such as V, O, Ti, and Si; the elemental mapping of VTS-1 is shown in Fig. 2.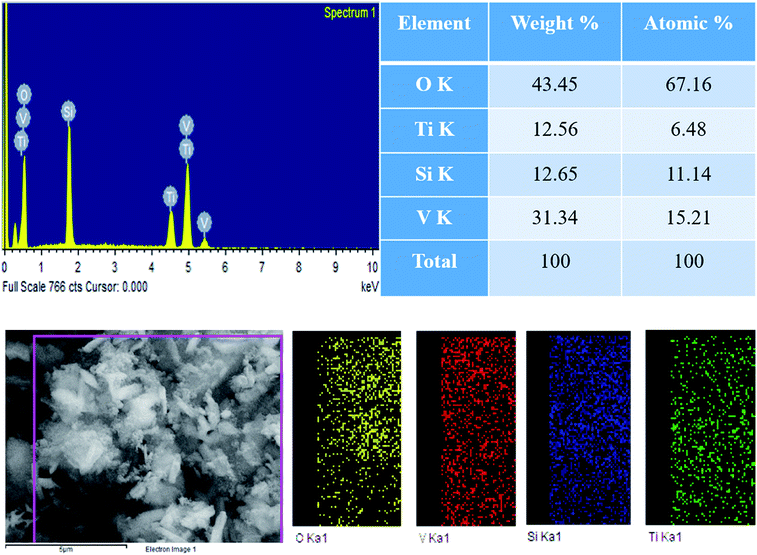 | ||
| Fig. 2 EDS analysis of the VTS-1 catalyst and elemental mapping of the respective elements of the VTS-1 catalyst. | ||
3.3. Transmission electron microscopy
Fig. 3 presents TEM images of pure TS and the VTS-1 hybrid catalyst. Fig. 3(a and b) shows the morphology of pure TS, which has a hexagonal porous structure. Fig. 3(c–e) presents TEM and HR-TEM images of the VTS-1 hybrid catalyst, which clearly reveals that good heterojunctions were formed between TS and the VO nanorods.32 Fig. 3f shows the selected area electron diffraction (SAED) pattern of the VTS-1 catalyst. From these results, it is evident that the TS particles are uniformly distributed (Fig. 3d) on the VO nanorods, which correlates with the SEM and PXRD results. Due to the formation of heterojunctions between these two semiconductor composites, the efficiency of the charge carrier separation is enhanced, which is responsible for the enhancement of the photocatalytic activity.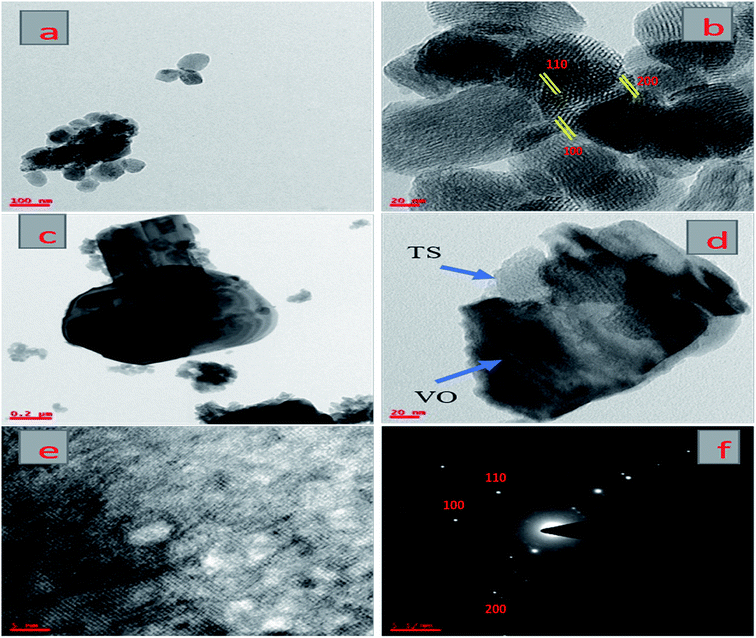 | ||
| Fig. 3 TEM images of pure TS (a and b) and the VTS-1 nanocomposite (c and d), HR-TEM image of the VTS-1 nanocomposite (e), and SAED pattern of the VTS-1 nanocomposite (f). | ||
3.4. BET-surface area
The N2 adsorption/desorption isotherms of TS, VTS-1, VTS-2 and VTS-3 are given in Fig. S2.† It was found that pure TS has a higher BET surface area of 452 m2 g−1. In the catalysts, because the TS![[thin space (1/6-em)]](https://www.rsc.org/images/entities/char_2009.gif) :
:![[thin space (1/6-em)]](https://www.rsc.org/images/entities/char_2009.gif) VO weight ratio of VTS-1 is greater (2
VO weight ratio of VTS-1 is greater (2![[thin space (1/6-em)]](https://www.rsc.org/images/entities/char_2009.gif) :
:![[thin space (1/6-em)]](https://www.rsc.org/images/entities/char_2009.gif) 1), its surface area is high (410 m2 g−1) compared to those of the other catalysts. At a 1
1), its surface area is high (410 m2 g−1) compared to those of the other catalysts. At a 1![[thin space (1/6-em)]](https://www.rsc.org/images/entities/char_2009.gif) :
:![[thin space (1/6-em)]](https://www.rsc.org/images/entities/char_2009.gif) 1 weight ratio, the surface area is further decreased (380 m2 g−1). When the weight ratio is 1
1 weight ratio, the surface area is further decreased (380 m2 g−1). When the weight ratio is 1![[thin space (1/6-em)]](https://www.rsc.org/images/entities/char_2009.gif) :
:![[thin space (1/6-em)]](https://www.rsc.org/images/entities/char_2009.gif) 2, the surface area is much lower (353 m2 g−1). From these results, VTS-1 has a higher surface area of 410 m2 g−1; this is the main reason for its enhanced photocatalytic activity because the higher surface area allows more visible light to generate more photo-generated charge carriers, which are responsible for the extent of photocatalytic activity. Note that pure TS has a greater surface area than the composite; however, due to its higher bandgap, it shows less photocatalytic activity.
2, the surface area is much lower (353 m2 g−1). From these results, VTS-1 has a higher surface area of 410 m2 g−1; this is the main reason for its enhanced photocatalytic activity because the higher surface area allows more visible light to generate more photo-generated charge carriers, which are responsible for the extent of photocatalytic activity. Note that pure TS has a greater surface area than the composite; however, due to its higher bandgap, it shows less photocatalytic activity.
3.5. Fourier transform infrared spectroscopic analysis
Fig. S3† shows the FT-IR spectra of the synthesized pure TS, pure VO, and the VTS-1, VTS-2 and VTS-3 catalysts. In the spectrum of TS, strong peaks of the Si–O–Si band at 1100, 802 and 467 cm−1 indicate the condensation of silicon alkoxide. It was shown that the peak at 960 cm−1 is due to the Ti–O band of TS. A. A. Kumar et al. verified that the bands at 960 cm−1 shown by TS zeolites can also be ascribed to the stretching mode of [SiO4] units bonded to Ti4+ ions [O3SiOTi]. In VO, the peaks at 829 cm−1 and 1018 cm−1 are its characteristic absorption bands.14 The V–O–V band at 829 cm−1 is ascribed to the asymmetric stretching vibration, and the other V–O band at 1018 cm−1 is ascribed to the stretching vibration.15 The spectra of the VTS catalysts present overlaps of TS and VO. All the FT-IR spectra of the composites exhibit the characteristic bands of both TS and VO, and no impurity peaks were detected.3.6. Diffuse reflectance ultraviolet-visible spectroscopy
Fig. S4† shows the UV-Visible diffuse reflectance spectra of pure TS, pure VO, and the VTS-1, VTS-2 and VTS-3 catalysts. It can be seen that the TS and VO absorption edges appear at around 390 nm and 530 nm, respectively. The absorption edges of the VTS catalysts moved to higher wavelengths in comparison with that of TS. This can be attributed to the inorganic hybrid structure between the TS and VO interfaces. No obvious difference was observed among the composites, indicating that the content of VO does not influence the light-harvesting properties of the prepared composites. It is notable that the VTS catalysts also exhibit broad background absorption in the visible light region, which can be attributed to the presence of VO nanoparticles. The results also show that all the VTS catalysts can function under visible light illumination. The band gaps of TS and VO are expected to be 3.1 and 2.3 eV, respectively.163.7. X-ray photoelectron spectroscopy
Fig. 4a presents the X-ray photoelectron survey spectrum of the VTS-1 nanocomposite; it shows the presence of Ti, C, O, Si and V elements, which provides clear evidence for the formation of heterojunctions between TS and the VO nanorods and corroborates the PXRD, SEM, HR-TEM, TEM and BET results. Fig. 4b–f presents the deconvolution spectra of C 1s, O 1s, Si 2p, Ti 2p and V 2p, respectively. From these deconvolution results, C 1s, O 1s, Si 2p and V 2p show sharp single peaks in their respective binding energy regions.39–41 However, Ti shows two different peaks in the deconvolution spectrum; one is 2p 1/2 and the other one is 2p 3/2.42 These may be due to the tetrahedrally co-ordinated V–O–Ti–O–Si and Ti–O–Si species, respectively. This difference is not observed in the V peak, which is probably due to the low abundance of V–O–Ti–O–Si species.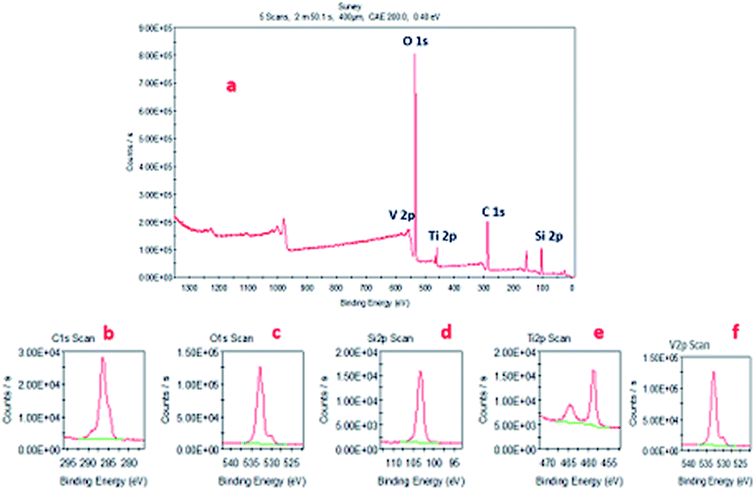 | ||
| Fig. 4 (a) X-ray photoelectron survey spectrum. (b) C 1s, (c) O 1s, (d) Si 2p, (e) Ti 2p, and (f) V 2p deconvolution spectra of the VTS-1 composite. | ||
3.8. Photoluminescence spectroscopy
To further confirm the separation mechanism of electron–hole pairs in the VTS-1 hybrid catalyst as discussed above, the room temperature PL properties of the as-prepared pure VO and VTS-1 hybrid catalyst were investigated, as shown in Fig. S5.† The PL spectra of pure VO and the VTS-1 hybrid catalyst were obtained at an excitation wavelength of 325 nm. As shown in Fig. S5,† an emission at about 546 nm was obviously detected in both pure VO and the VTS-1 hybrid catalyst. However, the fluorescence intensity of the VTS-1 hybrid catalyst (red line) was weaker than that of pure VO (black line), clearly demonstrating that the recombination of photogenerated electron–hole pairs was inhibited greatly in the VTS-1 hybrid catalyst. This result is in good agreement with the analysis of the energy band positions of VO and TS, as discussed above. Thus, the PL spectra offer direct evidence for the efficient separation of photogenerated electron–hole pairs in the VTS-1 hybrid catalyst, leading to enhanced photocatalytic degradation of MB compared to pure VO and pure TS.3.9. Photocatalytic activity
Fig. S5† shows that the photocatalytic performance of the synthesized VTS catalyst in MB dye degradation under direct sunlight and visible light irradiation, the effects of catalyst adsorption and the photolysis capacity of the catalyst. MB shows a maximum absorbance at 655 nm. Fig. S5a† shows the MB dye degradation rates upon irradiation with sunlight at different time intervals. The degradation of MB dye solution with VTS catalyst under irradiation of visible light for different time intervals is shown in Fig. S5b.† The results show that sunlight-irradiated MB dye with the VTS catalyst solution was degraded rapidly, i.e. within 60 min, compared to visible light-irradiated dye (120 min). Fig. S5c† shows the effects of catalyst adsorption on MB dye solution with the VTS catalyst under dark conditions at different time intervals. Fig. S5d† shows the degradation of MB dye under sunlight (30 min) without a catalyst. To demonstrate the influence of TS on the VO nanorods, the MB degradation was studied under sunlight.Fig. 5a shows the plots of C/C0 vs. irradiation time for the VTS catalysts, pure TS and pure VO, where the initial concentration of the MB solution is C0 and C is the MB solution concentration with respect to the degradation time ‘t’. It is observable from Fig. 5b that the degradation rate was noticeably faster for the composite compared to pure VO, which shows the beneficial impact of titanosilicate on the photocatalytic performance of the composite.
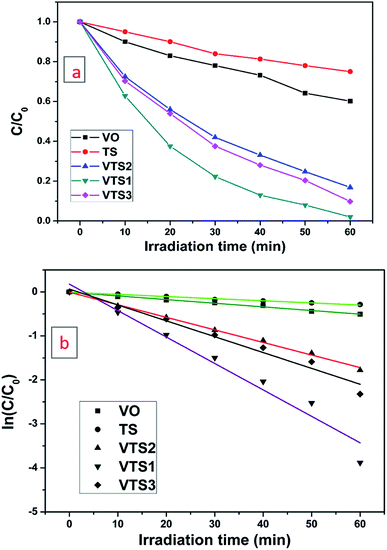 | ||
| Fig. 5 Photodegradation of MB dye under the irradiation of direct sunlight with pure TS, pure VO, and the VTS-1, VTS-2 and VTS-3 catalysts. | ||
The energy band diagram of the titanosilicate/VO heterostructure photocatalyst after thermodynamic equilibrium is presented in Fig. 6. The calculated conduction band (CB) and valence band (VB) of TS are −0.30 and 2.86 eV, whereas the CB and VB of VO are 0.44 and 2.64 eV, respectively. VO is considered to be an intrinsic semiconductor; therefore, the Fermi level in VO lies in the middle of the conduction band and valence band, which is approximately equal to 1.6 eV. According to a literature report of the band energy levels of VO, EC and EV increase from 0.4 eV to −1.2 eV and from 2.8 eV to 1.1 eV, respectively.43 Obviously, the difference in ECB between VO and TS allowed the transfer of an electron from the conduction band of VO to that of TS. When the system is irradiated with visible light, an electron (e−) is promoted from the valence band into the conduction band of VO, leaving a hole (h+) behind. Then, the excited-state electrons produced by VO can be injected into the conduction band of the coupled TS due to the joint electric fields between the two materials. Conduction electrons are good reductants which can capture the adsorbed O2 on the surface of the catalyst and reduce it to O2˙−. This can be further dissociated or reduced by photoinduced electrons; thus, there is a constant stream of surface ·OH groups. In the presence of hydroxyl radicals, the efficient photocatalytic degradation of MB can be carried out smoothly. Preliminary semiconductor-based photocatalyst test analysis with ammonium oxalate, tertiary butanol, and benzoquinone shows that ·OH− is active in photocatalytic dye degradation. In addition, the photogenerated holes in VO also may activate some unsaturated organic pollutants, resulting in decomposition. A plausible heteroatom environment and probable chemical reaction mechanism are given in Fig. 7. Because the concentration of methylene blue is in ×10−4 M, the products are difficult to separate from the mixture; also, because the products are small inorganic molecules, they are difficult to analyse by reverse phase LCMS on an Agilent instrument.
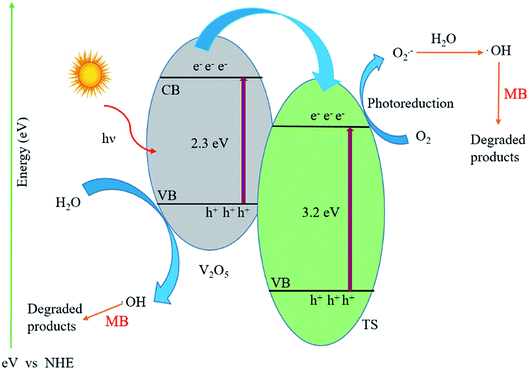 | ||
| Fig. 6 Schematic of the photocatalytic degradation mechanism of MB over the VTS hybrid catalyst under sunlight irradiation. | ||
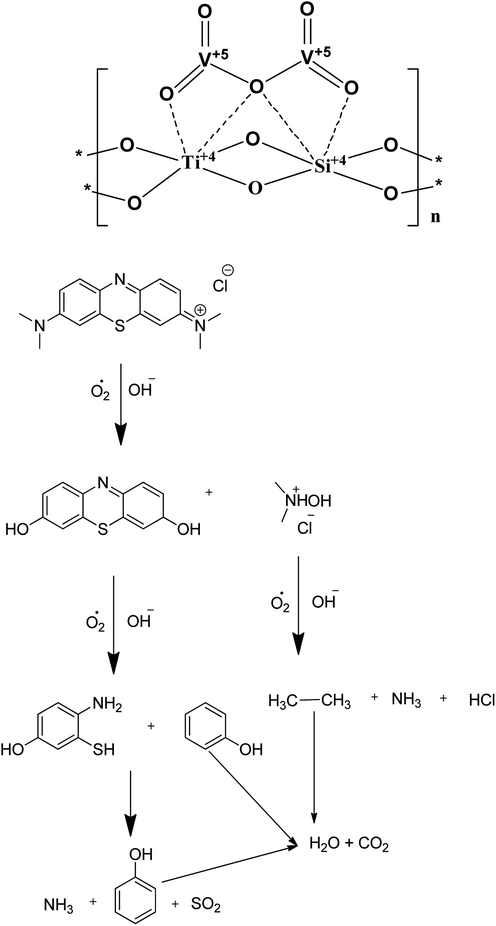 | ||
| Fig. 7 A plausible heteroatom environment of V and Ti in the VTS catalyst and a plausible mechanism of methylene blue degradation. | ||
In summary, the BET surface area studies show that the surface area of the VTS-1 composite is higher than that of pure V2O5 and slightly lower than that of porous titanosilicate. The pore widths follow the same trend. The heterojunctions were proved by powder X-ray diffraction, transmission electron microscopy, Fourier transform infrared spectroscopy, ultraviolet-visible spectroscopy, X-ray photoelectron spectroscopy and photoluminescence spectroscopy analysis. The photocatalytic results reveal that the composite has higher activity compared to its pure components. The correlation of these results shows that the former two important properties of the composites are the reason for the enhancement of its photocatalytic activity. This is also supported by earlier published results.13–16
4. Conclusions
We have synthesized several high surface area V2O5/TiO2–SiO2 catalysts (VTS). The synthesized materials were characterized by PXRD, FE-SEM/EDAX, TEM, FT-IR, UV-Vis, XPS, fluorescence and photocatalytic activity studies. The heterojunctions and high surface areas were proved by FT-IR, UV-Visible, XPS, fluorescence spectroscopy and BET surface area analysis. The photocatalytic activity of methylene blue degradation was studied with the pure constituents and catalysts. VTS-1 showed higher conversion than the other catalysts as well as pure titanosilicate and VO. This is probably due to the heterojunctions and higher surface area in VTS-1. Kinetic studies show that direct sunlight affords higher activity than pure visible light. Preliminary scavenger test analysis shows that OH− is active in dye degradation. A plausible physical and chemical mechanism for the photocatalytic activity is proposed. It is proved that the photocatalytic dye degradation produces benign small inorganic molecules, such as CO2, NH3, SO2 and H2O.Conflicts of interest
There are no conflicts to declare.Acknowledgements
The authors are thankful to MHRD, New Delhi and DST-SERB (EMR/2014/000629), New Delhi for partial financial assistance.References
- A. Mills and S. Le Hunte, J. Photochem. Photobiol., A, 1997, 108, 1–35 CrossRef CAS.
- Z. Yi, J. Ye, N. Kikugawa, T. Kako, S. Ouyang, H. Stuart-Williams, H. Yang, J. Cao, W. Luo, Z. Li, Y. Liu and R. L. Withers, Nat. Mater., 2010, 9, 559–564 CrossRef CAS PubMed.
- A. Fujishima, X. Zhang and D. Tryk, Int. J. Hydrogen Energy, 2007, 32, 2664–2672 CrossRef CAS.
- D. Bahnemann, Sol. Energy, 2004, 77, 445–459 CrossRef CAS.
- M. R. Hoffmann, S. T. Martin, W. Choi and D. W. Bahnemann, Chem. Rev., 1995, 95, 69–96 CrossRef CAS.
- D. Chatterjee and S. Dasgupta, J. Photochem. Photobiol., C, 2005, 6, 186–205 CrossRef CAS.
- Y. Li, J. Wang, H. Yao, L. Dang and Z. Li, J. Mol. Catal. A: Chem., 2011, 334, 116–122 CrossRef CAS.
- M. Litter, Appl. Catal., B, 1999, 23, 89–114 CrossRef CAS.
- K. Pirkanniemi and M. Sillanpää, Chemosphere, 2002, 48, 1047–1060 CrossRef CAS PubMed.
- D. Ljubas, Energy, 2005, 30, 1699–1710 CrossRef CAS.
- J. M. Herrmann, Top. Catal., 2005, 34, 49–65 CrossRef CAS.
- Y. Liang, H. Wang, H. Sanchez Casalongue, Z. Chen and H. Dai, Nano Res., 2010, 3, 701–705 CrossRef CAS.
- A. K. Adepu, V. Katta and V. Narayanan, New J. Chem., 2017, 41, 2498–2504 RSC.
- A. A. Kumar, A. Rajini and N. Venkatathri, Mater. Today: Proc., 2017, 4, 19–24 Search PubMed.
- A. K. Adepu, S. Goskula, S. Chirra, S. Siliveri, S. R. Gujjula and N. Venkatathri, J. Porous Mater. DOI:10.1007/s10934-019-00719-9.
- A. K. Adepu, R. Anumula and V. Narayanan, Microporous Mesoporous Mater., 2017, 247, 86–94 CrossRef CAS.
- R. T. Rajendra Kumar, B. Karunagaran, D. Mangalaraj, S. K. Narayandass, P. Manoravi, M. Joseph and V. Gopal, Sens. Actuators, A, 2003, 107, 62–67 CrossRef CAS.
- J. Liu, X. Wang, Q. Peng and Y. Li, Adv. Mater., 2005, 17, 764–767 CrossRef CAS.
- Y. Wang, K. Takahashi, K. H. Lee and G. Z. Cao, Adv. Funct. Mater., 2006, 16, 1133–1144 CrossRef CAS.
- H.-L. Fei, H.-J. Zhou, J.-G. Wang, P.-C. Sun, D.-T. Ding and T.-H. Chen, Solid State Sci., 2008, 10, 1276–1284 CrossRef CAS.
- J. Liu, R. Yang and S. Li, Rare Met., 2006, 25, 636–642 CrossRef CAS.
- J. Sun, X. Li, Q. Zhao, J. Ke and D. Zhang, J. Phys. Chem. C, 2014, 118, 10113–10121 CrossRef CAS.
- M. G. Kim, H. Kim and J. Cho, J. Electrochem. Soc., 2010, 157, A802 CrossRef CAS.
- Y. Li, S. Ji, Y. Gao, H. Luo and M. Kanehira, Sci. Rep., 2013, 3, 1370 CrossRef PubMed.
- Y. N. Ko, Y. C. Kang and S. Bin Park, Chem. Commun., 2013, 49, 3884 RSC.
- T. Jayaraman, S. Arumugam Raja, A. Priya, M. Jagannathan and M. Ashokkumar, New J. Chem., 2015, 39, 1367–1374 RSC.
- M. Taramasso, G. Perego and B. Notari, US Pat., 4410501, 1983, pp. 2–6.
- F. X. Llabrés i Xamena, P. Calza, C. Lamberti, C. Prestipino, A. Damin, S. Bordiga, E. Pelizzetti and A. Zecchina, J. Am. Chem. Soc., 2003, 125, 2264–2271 CrossRef PubMed.
- C. M. A. Parlett, K. Wilson and A. F. Lee, Chem. Soc. Rev., 2013, 42, 3876–3893 RSC.
- K.-M. Choi, T. Yokoi, T. Tatsumi and K. Kuroda, J. Mater. Chem. A, 2013, 1, 2485 RSC.
- M. Selvaraj, Catal. Sci. Technol., 2014, 4, 2674 RSC.
- Y.-H. Chiu and Y.-J. Hsu, Nano Energy, 2017, 31, 286–295 CrossRef CAS.
- T. H. Do, C. Nguyen Van, K.-A. Tsai, L. T. Quynh, J.-W. Chen, Y.-C. Lin, Y.-C. Chen, W.-C. Chou, C.-L. Wu, Y.-J. Hsu and Y.-H. Chu, Nano Energy, 2016, 23, 153–160 CrossRef CAS.
- P.-Y. Hsieh, Y.-H. Chiu, T.-H. Lai, M.-J. Fang, Y.-T. Wang and Y.-J. Hsu, ACS Appl. Mater. Interfaces, 2019, 11, 3006–3015 CrossRef CAS PubMed.
- N. Koivikko, T. Laitinen, A. Mouammine, S. Ojala and R. Keiski, Catalysts, 2018, 8, 56 CrossRef.
- M. Kobayashi, R. Kuma, S. Masaki and N. Sugishima, Appl. Catal., B, 2005, 60, 173–179 CrossRef CAS.
- K. S. Prasad, C. Shivamallu, G. Shruthi and M. Prasad, ChemistrySelect, 2018, 3, 3860–3865 CrossRef CAS.
- N. La-Salvia, J. J. Lovón-Quintana, A. S. P. Lovón and G. P. Valença, Mater. Res., 2017, 20, 1461–1469 CrossRef.
- M. C. Biesinger, L. W. M. Lau, A. R. Gerson and R. S. C. Smart, Appl. Surf. Sci., 2010, 257, 887–898 CrossRef CAS.
- F. Langerame, A. M. Salvi, M. Silletti and G. Moretti, Surf. Interface Anal., 2008, 40, 695–699 CrossRef CAS.
- T. L. Barr and M. A. Lishka, J. Am. Chem. Soc., 1986, 108, 3178–3186 CrossRef CAS.
- N. Roy, Y. Sohn and D. Pradhan, ACS Nano, 2013, 7, 2532–2540 CrossRef CAS PubMed.
- Y. Hu, D. Li, Y. Zheng, W. Chen, Y. He, Y. Shao, X. Fu and G. Xiao, Appl. Catal., B, 2011, 104, 30–36 CrossRef CAS.
Footnote |
| † Electronic supplementary information (ESI) available. See DOI: 10.1039/c9ra03866c |
| This journal is © The Royal Society of Chemistry 2019 |

