DOI:
10.1039/C9RA03858B
(Paper)
RSC Adv., 2019,
9, 24280-24290
Facile synthesis of few-layer MoS2 in MgAl-LDH layers for enhanced visible-light photocatalytic activity
Received
22nd May 2019
, Accepted 8th July 2019
First published on 5th August 2019
Abstract
A new photocatalyst, few-layer MoS2 grown in MgAl-LDH interlayers (MoS2/MgAl-LDH), was prepared by a facile two-step hydrothermal synthesis. The structural and photocatalytic properties of the obtained material were characterized by several techniques including powder X-ray diffraction (XRD), Raman spectroscopy, field emission scanning electron microscopy (FESEM), high-resolution transmission electron microscopy (HRTEM), Fourier transform infrared spectroscopy (FTIR), X-ray photoelectron spectroscopy (XPS), photoluminescence spectroscopy (PL) and UV-vis absorption spectroscopy. The MoS2/MgAl-LDH composite showed excellent photocatalytic performance for methyl orange (MO) degradation at low concentrations (50 mg L−1 and 100 mg L−1). Furthermore, even for a MO solution concentration as high as 200 mg L−1, this composite also presented high degradation efficiency (>84%) and mineralization efficiency (>73%) at 120 min. The results show that the MoS2/MgAl-LDH composite has great potential for application in wastewater treatment.
1. Introduction
Groundwater contamination due to dyes is still a serious environmental pollution problem, mainly because of the high toxicity and widespread use of dyes.1–4 Semiconductor photocatalytic degradation of organic pollutants in wastewater using inexhaustible and environmentally friendly solar energy has attracted much attention.5,6 TiO2 is a commercially available semiconductor photocatalyst.21,24 However, it shows poor utilization of sunlight, due to the wide band gap of 3.2 eV which only absorbs sunlight with a wavelength of less than 420 nm. Therefore, researchers have been looking for other semiconductor photocatalysts as replacements for TiO2.
As a typical graphene-like transition metal disulfide, MoS2 is a potential photocatalyst.7–9,25 Unlike other semiconductor materials, based on the quantum confinement effect, the band gap of MoS2 increases with the number of layers. Moreover, bulk MoS2 is an indirect bandgap semiconductor with a band gap of 1.2 eV, and single-layer MoS2 is a direct bandgap semiconductor with a band gap of 1.9 eV.10 It can be seen that single-layer or few-layer MoS2 is a potential photocatalytic semiconductor material. In addition, there are many unsaturated bonds and more active sites due to the complex edge structure of two-dimensional (2D) MoS2. Therefore, preparation of single-layer or few-layer MoS2 is particularly important for application in photocatalysis. For example, like for the preparation of graphene, single and few-layer MoS2 have been prepared using mechanical exfoliation, the so-called “Scotch Tape Method”.11 Obviously, the “Scotch Tape Method” is not a scalable process. Recently the Coleman group prepared a single-layer of MoS2 by a surfactant-assisted sonication pioneering method.12–15 However, even if a single-layer of MoS2 is prepared, the surface defects will lead to a high photoelectron–hole pair recombination efficiency, thus affecting the photocatalytic performance of MoS2. Therefore, how to prepare single or few-layers of MoS2 and inhibit the recombination of photoelectron–hole pairs is a challenging subject.
Based on the above reasons, we designed a single or few-layer MoS2-intercalated layered double hydroxide (MoS2/MgAl-LDH) composite as a novel photocatalyst. Few-layer MoS2 can be obtained by the “space-confining” effect of the LDH interlayer. On the one hand, 2D MoS2 can contribute more active sites. On the other hand, LDHs have excellent performance as carriers for photocatalyst composites. For example, Šárka et al. prepared ZnCr–CO3 LDHs and derived mixed oxides that exhibited excellent adsorption and photocatalytic properties for Orange II.35 Wu et al. prepared Cu2O/ZnAl calcined layered double hydroxide (Cu2O/ZnAl-CLDH) photocatalysts with superior photocatalytic activity.33 Here we prepared MoS2/MgAl-LDH composites by hydrothermal synthesis, evaluated the catalytic performance of the catalyst by degrading methyl orange organic dyes, and conducted in-depth research on the synergistic mechanism of MoS2 and MgAl-LDH.
2. Experimental
2.1. Synthesis of various materials
All reagents were analytical grade and used without further purification. MoS2/MgAl-LDH was prepared by a simple two-step hydrothermal process. First, MgAl-LDH with MoO42− intercalated in the interlayer (MoO42−/MgAl-LDH) was prepared by a hydrothermal method. During the synthesis process, Mg(NO3)2·6H2O (4.615 g) and Al(NO3)3·9H2O (3.376 g) with a M2+/M3+ molar ratio of 2.0/1.0 were dissolved in 50 mL degassed distilled water to form solution A. Then, NaOH (2.516 g) was dissolved in 25 mL degassed distilled water to produce solution B. Na2MoO4·2H2O (7.561 g) was dissolved in 25 mL degassed distilled water to form solution C. Solutions A and B were added dropwise to a reaction vessel containing solution C with vigorous, constant stirring at a constant pH of 10 and at 60 °C. After the addition, the resultant slurry was cooled to room temperature and aged for 10 h at 140 °C. MoO42−/MgAl-LDH was washed several times with large amounts of deionized water and lyophilized in a vacuum freeze dryer.
Then, MoO42−/MgAl-LDH (0.5 g) and thiourea (0.38 g) were added to 60 mL degassed distilled water and stirred. After stirring, the resultant slurry was subsequently aged for 24 h at 205 °C. MoS2/MgAl-LDH was washed several times with a large amount of deionized water and lyophilized in a vacuum freeze drier.
For comparison, MgAl-LDH with CO32− intercalated in the interlayer (MgAl-LDH) was also fabricated by the same procedure except that solutions A and B were mixed dropwise in a reaction vessel without solution C. Pure MoS2 was also prepared by hydrothermal processing. Na2MoO4·2H2O (0.3 g) and thiourea (0.8 g) were dissolved in 65 mL degassed distilled water. The clear solution was aged for 24 h at 205 °C. Then, MoS2 was washed several times with deionized water and lyophilized.
2.2. Characterization
The samples were characterized using X-ray diffraction (XRD, X’Pert PRO MRD), Raman spectroscopy (DXR Raman microscope), field emission scanning electron microscopy (FESEM, S-4800), high-resolution transmission electron microscopy (HRTEM, JEM-2100F), FTIR spectroscopy (Thermo Nicolet NEXUS 670), nitrogen adsorption–desorption experiments for surface and porosity quantification (NOVA-1200e) and X-ray photoelectron spectroscopy (XPS, ESCALAB 250Xi). The photoluminescence spectra of the materials were obtained with a fluorescence spectrophotometer (FluoroMax-4). The electrical behavior test was carried out using a semiconductor characterization system (4200-SCS). The degradation efficiency was determined by the concentration of MO studied by the spectrophotometer (UV-3600, Shimadzu). The mineralization efficiency was measured by a Total Organic Carbon analyzer (multi N/C 3100).
2.3. Photocatalytic activity
The photocatalytic efficiency was measured by the degradation of methyl orange (MO) as a model contaminant. In general, 50 mg catalyst (1 g L−1) was added to a 50 mL MO solution with a certain initial concentration (50, 100, 150 or 200 mg L−1), and the pH of the solution was adjusted by 0.1 mol L−1 HNO3 or 1 mol L−1 NaOH (pH = 3, 5, 7, 9 and 11). The mixture was stirred in the dark for 30 min to achieve adsorption/desorption equilibrium of MO with the catalyst. Then, the reaction system was exposed to light irradiation from a 500 W xenon lamp (λ > 420 nm) using a photochemical reaction apparatus (BL-GHX-V). During irradiation, 3 mL of the reaction solution was removed with a pipette at specific time intervals. The photocatalyst was removed from the solution via centrifugation. The MO concentration was measured by an ultraviolet-visible spectrophotometer at λ = 464 nm.
The degradation efficiency was calculated by the following formula:
| | |
Degradation efficiency (%) = 100 × (C0 − C)/C0
| (1) |
where
C0 is the initial concentration of MO (mg L
−1) and
C is the concentration of MO at another given irradiation time (mg L
−1). The mineralization efficiency was calculated by the following formula:
| | |
Mineralization efficiency (%) = 100 × (TOC0 − TOC)/TOC0
| (2) |
where TOC
0 is the initial total organic carbon of MO (mg L
−1) and TOC is the total organic carbon of MO at another given irradiation time (mg L
−1).
3. Results and discussion
3.1. Structural design of the composite
The design of the MoS2/MgAl-LDH composite is shown in Scheme 1. First, MoO42− ions were added to the precursor solution of MgAl hydrotalcite. Due to the exchangeability of anions in the MgAl-LDH layers, MoO42−/MgAl-LDH was prepared by a hydrothermal method. Subsequently, MoO42−/MgAl-LDH was vulcanized in a hydrothermal process in a mild liquid phase environment. In this process, thiourea not only acts as a source of sulfur, but also releases H2S as a protective atmosphere. In addition, in the liquid phase, it can improve the uniformity of the reaction sites of MoO42− as well as acting as a sulfur source, which is beneficial to form few-layer MoS2 in the MgAl-LDH layers.
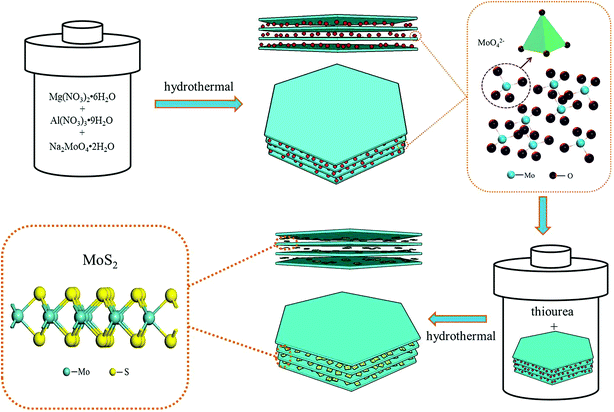 |
| | Scheme 1 Design of the MoS2/MgAl-LDH growth process. | |
3.2. Structural characterization of the composite
Fig. 1a shows the XRD patterns of MgAl-LDH, MoO42−/MgAl-LDH, MoS2 and MoS2/MgAl-LDH. The XRD pattern of MgAl-LDH has four diffraction peaks at 11.7°, 23.4°, 34.9° and 60.8°, which correspond to the (003), (006), (012) and (110) planes, respectively, of MgAl-LDH with the general formula (Mg0.667Al0.333)(OH)2(CO3)0.167(H2O)0.5 (JPCDS no. 89-0460). The pristine MgAl-LDH pattern shows typical Bragg reflections of hexagonal LDH phases with interlayer carbonate anions. The MoO42−/MgAl-LDH composite has major diffraction peaks at 8.2°, 16.5°, 24.7° and 60.8°, which correspond to the (003), (006), (012) and (110) planes, respectively, of MgAl-LDH. The MoS2/MgAl-LDH composite not only has major diffraction peaks at 10.65°, 23.4°, 34.9° and 60.8°, corresponding to the (003), (006), (012) and (110) planes of MgAl-LDH, but also has major diffraction peaks at 14.1° and 39.5°, which can be attributed to the (002) and (103) planes of MoS2, respectively. In addition, the “a” value of the unit cell parameter did not change (as shown in Table 1). The unit cell parameters of LDHs correspond to the cation–cation distance in the brucite layer, which can be calculated by a = 2 × d (110). When MoO42− and MoS2 were inserted into MgAl-LDH, the substrate spacing increased from 7.6 Å to 10.8 Å and 8.3 Å, respectively. As shown in Scheme 2, the length of the C–O bond in the CO32− anion is 1.179 Å in MgAl-LDH. When MoO42− replaced the CO32− anion in the MgAl-LDH layer, the spacing of the (003) plane increased from 7.6 Å to 10.8 Å. This is because the length of the Mo–O bond in the MoO42− anion is 1.787 Å, which is larger than that of the C–O bond in the CO32− ion. When MoS2 was inserted into the LDH interlayer, the spacing of the (003) plane decreased to 8.3 Å, even though the length of the Mo–S bond was 2.414 Å. This is attributed to the weakening of the hydrogen bonding force between the MoS2 compounds and the LDH layer. Fig. 1b shows the Raman spectra, which further reveal the microstructure of MoS2 and MoS2/MgAl-LDH. For MoS2, two different Raman peaks at 369.8 and 398.8 cm−1 are attributed to the typical E12g and A1g modes of hexagonal MoS2 crystals, respectively. In the case of MoS2/MgAl-LDH, the two MoS2 peaks are shifted to 371.4 and 396.5 cm−1. Obviously, the frequency difference between the E12g and A1g modes belonging to MoS2 was 29 cm−1, while for MoS2/MgAl-LDH this was reduced to 25.1 cm−1. This confirms that the thickness of the MoS2 nanosheets has been significantly reduced.36
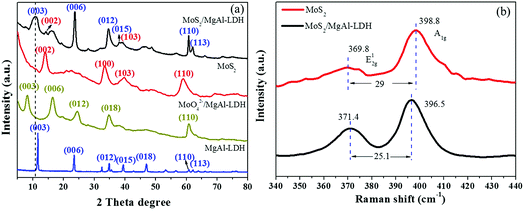 |
| | Fig. 1 XRD patterns of MgAl-LDH, MoO42−/MgAl-LDH, MoS2 and MoS2/MgAl-LDH (a), and Raman spectra of MoS2 and MoS2/MgAl-LDH (b). | |
Table 1 Structural characteristics of the samples obtained by hydrothermal synthesisa
| |
MgAl-LDH |
MoO42−/MgAl-LDH |
MoS2/MgAl-LDH |
MoS2 |
| a = 2d110, c = 3d003 and c = 3c′. The difference between c′ and 4.8 Å (the thickness of the brucite-like sheet).16 |
| a (Å) |
3.05 |
3.05 |
3.05 |
— |
| c (Å) |
22.8 |
32.4 |
24.9 |
— |
| c′ (Å) |
7.6 |
10.8 |
8.3 |
— |
| The thickness of the interlayer galleryb (Å) |
2.8 |
6.0 |
3.5 |
— |
| Band gap (eV) |
— |
— |
1.82 |
1.61 |
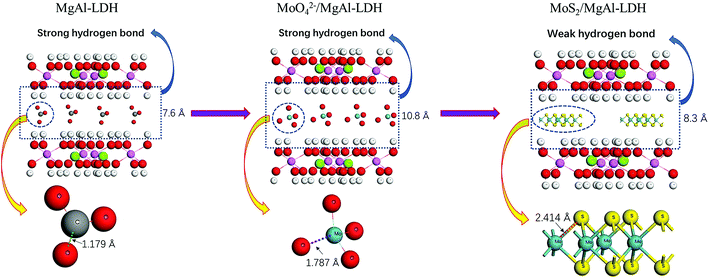 |
| | Scheme 2 Schematic of the spacing change of the (003) plane. | |
Fig. 2 shows the FTIR spectra of the various materials. As shown in Fig. 2a, strong and broad absorption bands at 3449, 3455 and 3449 cm−1 are observed for MgAl-LDH, MoO42−/MgAl-LDH and MoS2/MgAl-LDH, respectively. These can be attributed to the stretching vibration of the OH groups in the brucite-type layers and water molecules in the interlayer. The bands at 1618, 1635 and 1616 cm−1 can be attributed to the bending vibration of interlayer water. The absorption bands at 3422 and 1624 cm−1 for MoS2 can be assigned to the stretching vibration of the OH groups and the bending vibrations of water molecules adsorbed on the MoS2 surface, respectively. Between 1000 and 400 cm−1, the bands can be assigned to metal–oxygen (M–O) and metal–hydroxyl (M–OH) vibrations.17,18 The intense band characteristic of the ν3 vibrations (antisymmetric stretching) of CO32− ions located in the interlayer region can be observed at approximately 1360 cm−1. The CO32− peak intensities of MoS2/MgAl-LDH and MoO42−/MgAl-LDH are much weaker than those of MgAl-LDH in the FTIR spectra. For MoO42−/MgAl-LDH, the antisymmetric stretching vibration band of Mo–O–Mo is observed at 820 cm−1. The bands in the range of 400–1200 cm−1 for MoS2 and MoS2/MgAl-LDH are shown in Fig. 2b. In the spectrum of MoS2, the peak at 910 cm−1 can be attributed to the Mo![[double bond, length as m-dash]](https://www.rsc.org/images/entities/char_e001.gif) O stretching vibration, which may be caused by the formation of a small amount of oxide on the MoS2 surface. The peaks at 1113 and 1118 cm−1 for MoS2/MgAl-LDH and MoS2, respectively, can be attributed to the S
O stretching vibration, which may be caused by the formation of a small amount of oxide on the MoS2 surface. The peaks at 1113 and 1118 cm−1 for MoS2/MgAl-LDH and MoS2, respectively, can be attributed to the S![[double bond, length as m-dash]](https://www.rsc.org/images/entities/char_e001.gif) O asymmetric stretching vibration. In the spectra of MoS2/MgAl-LDH and MoS2, the peak at 624 cm−1 can be assigned to the Mo–S stretching vibration.
O asymmetric stretching vibration. In the spectra of MoS2/MgAl-LDH and MoS2, the peak at 624 cm−1 can be assigned to the Mo–S stretching vibration.
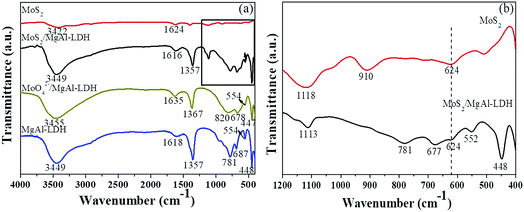 |
| | Fig. 2 FTIR spectra (a) of MgAl-LDH, MoS2/MgAl-LDH and MoS2 in the range of 400–4000 cm−1; and (b) of MoS2/MgAl-LDH and MoS2 in the range of 400–1200 cm−1. | |
Typical FESEM images of the samples are shown in Fig. 3a–d. As shown in Fig. 3a, the morphology of pure MoS2 is flower-like. Moreover, each MoS2 microsphere has an average diameter of approximately 1 μm. Fig. 3b–d show the morphology of MgAl-LDH, MoO42−/MgAl-LDH and MoS2/MgAl-LDH, respectively. It can be observed that all the samples maintain a hexagonal-like sheet structure. As shown in Fig. 3d, we didn’t find any particles with a similar morphology to pure MoS2 in the MoS2/MgAl-LDH composite. This indicates that the morphology of MgAl-LDH has not changed after ion exchange and vulcanization. The microstructures of the samples were investigated through TEM (Fig. 3e–g) and HRTRM (Fig. 3h). Fig. 3e shows MoS2 samples displaying flower-like spherical structures with diameters of 1–1.2 μm and Fig. 3f shows that MgAl-LDH is a highly dispersed flake. Interestingly, as shown in Fig. 3g, it is clearly shown that the MoS2 nanosheet exhibits an irregular sheet-like structure in the layers of MgAl-LDH, and MgAl-LDH is decorated by MoS2 and serves as a carrier. Moreover, the HRTEM image of MoS2/MgAl-LDH is shown in Fig. 3h. The interplanar spacings of 0.228 and 0.15 nm can be attributed to the (103) and (110) planes of MoS2 and MgAl-LDH, respectively. This also indicates that MoS2 was successfully grown between the MgAl-LDH layers.
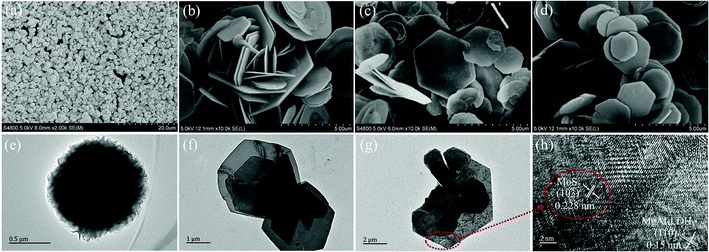 |
| | Fig. 3 FESEM images of MoS2 (a), MgAl-LDH (b), MoO42−/MgAl-LDH (c), and MoS2/MgAl-LDH (d). TEM images of MoS2 (e), MgAl-LDH (f), and MoS2/MgAl-LDH (g) and HRTEM image of MgAl-LDH (h). | |
To verify the interfacial nature of MoS2 and MgAl-LDH in the MoS2/MgAl-LDH sample, XPS measurements were carried out. As shown in Fig. 4a, the XPS spectra of MoS2/MgAl-LDH show Al 2p, S 2p, Mo 3d, C 1s, O 1s and Mg 1s binding energy peaks at 73.8 eV, 160.2 eV, 227.2 eV, 284.6 eV, 531.4 eV and 1303.7 eV, respectively. As shown in Fig. 4b, two peaks were observed at 228.3 and 231.6 eV, which could be attributed to Mo 3d5/2 and Mo 3d3/2 binding energies, respectively,19,20 and are the characteristic peaks of Mo4+ in MoS2. Two peaks at 232.5 and 235.7 eV are related to the Mo 3d5/2 and 3d3/2 binding energies of Mo6+, respectively.16 The small peak at 225.6 eV corresponds to the S 2s binding energy of MoS2.16 The S spectrum is shown in Fig. 4c. Two main peaks at 160.2 and 161.3 eV can be assigned to the S 2p3/2 and S 2p1/2 lines of MoS2, respectively. The small peak at 167.5 eV suggests the existence of bridging disulfides S4+.22 As illustrated in Fig. 4d, the C 1s spectrum can be decomposed into a dominant peak at 284.6 eV for C![[double bond, length as m-dash]](https://www.rsc.org/images/entities/char_e001.gif) C/C–C23 and a weak peak at 288.5 eV for C
C/C–C23 and a weak peak at 288.5 eV for C![[double bond, length as m-dash]](https://www.rsc.org/images/entities/char_e001.gif) O in oxygen-containing functional groups. The XPS results show that there is no chemical bond between MoS2 and MgAl-LDH in the MoS2/MgAl-LDH catalyst.
O in oxygen-containing functional groups. The XPS results show that there is no chemical bond between MoS2 and MgAl-LDH in the MoS2/MgAl-LDH catalyst.
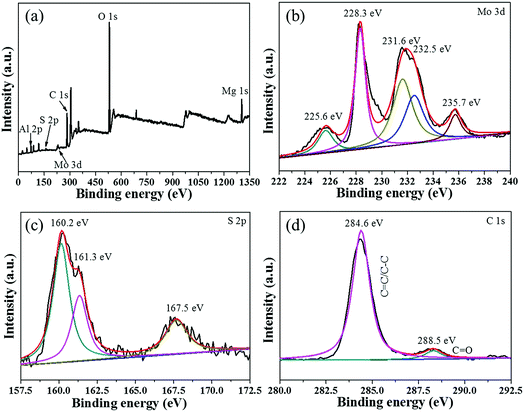 |
| | Fig. 4 XPS spectra of the MoS2/MgAl-LDH sample (a) and high-resolution XPS spectra of Mo 3d (b), S 2p (c), and C 1s (d). | |
The XRD, FTIR, FESEM, HRTEM and XPS analysis showed that few-layer MoS2 was successfully prepared in the MgAl-LDH layers by the hydrothermal method, which takes advantage of the “space-confining” effect of MgAl-LDH. Therefore, the synthetic design was reasonable via Scheme 1.
3.3. Photocatalytic performance
To better understand the photocatalytic performance of the MoS2/MgAl-LDH composite, different solution pH values were used for the photodegradation of MO, as shown in Fig. 5a. The degradation rate of MoS2/MgAl-LDH was the lowest at pH = 11, with only 19.23% of the MO degraded after 120 min. The photocatalytic ability of the sample increased as the pH decreased, and the degradation rate reached its highest at pH = 3, implying that the optimal photocatalytic capacity of MoS2/MgAl-LDH occurred under acidic conditions. Fig. 5b compares the degradation rate and mineralization rate of MO under different pH values under visible light irradiation for 2 h. The degradation efficiency and mineralization efficiency of MO without the catalyst were only 0.48% and 0.09% respectively, which indicates that the MO molecule and intermediate products were difficult to self-degrade. When the MO solution pH = 3, the degradation efficiency and mineralization efficiency achieved 84.88% and 73.25%, respectively. Therefore, the optimal condition in this study was pH = 3.
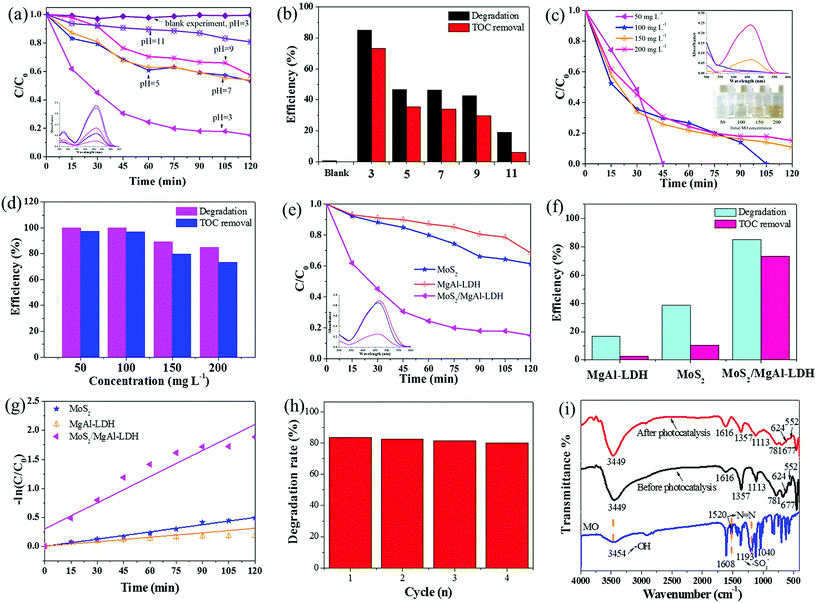 |
| | Fig. 5 Effect of initial solution pH values on the photodegradation (a) and mineralization (b) of MO (conditions: initial MO concentration 200 mg L−1, photocatalyst dosage 1 g L−1). Inset: UV-vis spectra of catalyzed solutions. Effect of initial MO concentration on the photodegradation (c) and mineralization (d) of MO (conditions: initial solution pH = 3, adsorbent dosage 1 g L−1). Inset: the UV-vis spectra of catalyzed solutions (top) and optical photographs of supernatants obtained by centrifugation (bottom). Photocatalytic degradation curves (e) and mineralization efficiency (f) of the samples. Inset: the UV-vis spectra of catalyzed solutions. The kinetic analysis of the samples (g). Cycles of photocatalytic degradation of MO using MoS2/MgAl-LDH (h) and FTIR spectra of MoS2/MgAl-LDH before and after photocatalysis (i). | |
The degradation rate using MoS2/MgAl-LDH for different concentrations of MO is shown in Fig. 5c. The MO solution concentrations were 50, 100, 150 and 200 mg L−1. As shown in Fig. 5c, the MO solutions with initial concentrations of 50 mg L−1 and 100 mg L−1 were completely degraded after reacting for 45 min and 105 min, respectively. In addition, the degradation efficiency was over 84% after 120 min when the initial concentrations of MO were 150 mg L−1 and 200 mg L−1. In addition, the mineralization efficiency of MO (Fig. 5d) at initial concentrations of 50 mg L−1, 100 mg L−1, 150 mg L−1 and 200 mg L−1 achieved 97.25%, 96.74%, 79.56% and 73.25%, respectively. Compared with other catalysts (in Table 2), MoS2/MgAl-LDH exhibited excellent catalytic performance at high concentrations of MO. To better verify the catalytic effect of the catalyst, a methyl orange concentration of 200 mg L−1 was selected for subsequent tests.
Table 2 The photocatalytic activity of several photocatalysts for MO
| Photocatalyst |
MO concentration |
Photocatalyst dosage |
Results |
References |
| TiO2/MoS2@zeolite |
20 mg L−1 |
0.5 g L−1 |
Removal of 100% in 60 min |
30 |
| Ag/TiO2 |
5 × 10⁻⁵ M (16.3 mg L−1) |
1 g L−1 |
Removal of 100% in 80 min |
31 |
| MoS2/YVO4 |
10 mg L−1 |
1 g L−1 |
Removal of 100% in 30 min |
32 |
| Cu2O/ZnAl-CLDH |
20 mg L−1 |
1 g L−1 |
Removal of approximately 90% in 420 min |
33 |
| TiO2/biochar |
20 mg L−1 |
0.25 g L−1 |
Removal of 100% in 150 min |
34 |
| MoS2/MgAl-LDH |
50 mg L−1 |
1 g L−1 |
Removal of 100% in 45 min |
This work |
| 100 mg L−1 |
1 g L−1 |
Removal of 100% in 105 min |
| 200 mg L−1 |
1 g L−1 |
Removal of approximately 84% in 120 min |
For comparison, pure MoS2 and MgAl-LDH were also tested under the same conditions. The photocatalytic performances of the samples under visible-light irradiation are shown in Fig. 5e and f. The degradation efficiency and mineralization efficiency were 38.66% and 10.25% for MoS2, 16.57% and 2.73% for MgAl-LDH, respectively. These are lower than the values (84.88% and 73.25%) for MoS2/MgAl-LDH, indicating that the synergistic effect between MoS2 and MgAl-LDH enhanced the catalytic activity.
Fig. 5g shows the MO kinetic analysis with MoS2, MgAl-LDH and MoS2/MgAl-LDH. The kinetics of photocatalytic reactions of organic pollutants are usually described by the Langmuir–Hinshelwood model. The photocatalytic process of MO can be expressed by the following pseudo first-order kinetic equation:26
| |
 | (3) |
| |
 | (4) |
where
C0 and
Ct are the initial MO concentration and the concentration at time
t, respectively, and
Kapp is the photocatalytic reaction rate constant (min
−1). The
Kapp, linearization coefficient (
R2) and half-life (
t1/2) are given in
Table 3. The high value of the linear regression coefficient (
R2) indicates that the photocatalytic reaction is well matched to the pseudo first-order kinetic model. MoS
2/MgAl-LDH showed the best photocatalytic performance, which was indicated by the largest value of
Kapp. The catalytic cycling performance of MoS
2/MgAl-LDH was investigated by reusing it four consecutive times as shown in
Fig. 5h, and the degradation rate of MO was still above 80% after four cycles. This shows that the MoS
2/MgAl-LDH catalyst has excellent catalytic performance and reusability, even with a MO concentration as high as 200 mg L
−1.
Fig. 5i shows the FTIR spectra of MoS
2/MgAl-LDH before and after photocatalysis. After photocatalysis, no characteristic peak of MO appeared in the FTIR spectra, proving that MoS
2/MgAl-LDH acts on MO
via photocatalysis instead of adsorption.
Table 3 Parameters of the pseudo first-order kinetic model for photocatalytic degradation
| Photocatalysts |
Kapp (min−1) |
R2 |
t1/2 (min) |
| MoS2 |
0.00416 |
0.9832 |
166.59 |
| MgAl-LDH |
0.00259 |
0.89659 |
267.62 |
| MoS2/MgAl-LDH |
0.01505 |
0.90051 |
46.06 |
3.4. The mechanism of the improvement in photocatalytic performance for MoS2/MgAl-LDH
Fig. 6a and b show the nitrogen adsorption–desorption isotherms and corresponding BJH pore size distributions, respectively, of MoS2, MgAl-LDH and MoS2/MgAl-LDH. The isotherms are IV isotherms with H3 hysteresis loops, indicating porous flat agglomerates or lamellar particles.37 The calculated BET surface area was 14.06 m2 g−1 for MgAl-LDH, 13.18 m2 g−1 for MoS2, and 9.83 m2 g−1 for MoS2/MgAl-LDH. The results demonstrate that the excellent photocatalytic performance of MoS2/MgAl-LDH does not depend on the specific surface area. As shown in Fig. 6c, compared with that of pure MoS2 and MgAl-LDH, the absorbance of MoS2/MgAl-LDH in the visible region is enhanced. The enhanced absorption of MoS2/MgAl-LDH will yield more photons to produce more photogenerated carriers, which could enhance the photocatalytic activity. The optical band gaps of the prepared photocatalysts were determined by the following equation (α = A(hν − Eg)n/2/hν).38 As shown in Fig. 6d and e, the bandgap of MoS2 increases from 1.62 to 1.78 eV, which is due to the decreasing domain size of MoS2 grown in the MgAl-LDH layers. The recombination distance of electron–hole pairs is increased with the increased band gap of MoS2.
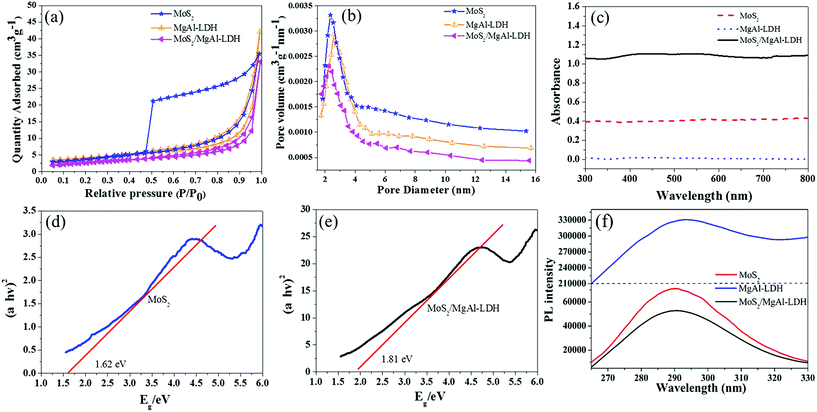 |
| | Fig. 6 N2 adsorption–desorption isotherm curves (a) and pore size distribution curves (b) of the samples. UV-vis spectra of MgAl-LDH, MoS2 and MoS2/MgAl-LDH (c) and the bandgap curves of MoS2 (d) and MoS2/MgAl-LDH (e). Fluorescence spectra of MgAl-LDH, MoS2 and MoS2/MgAl-LDH (f). | |
To verify the synergistic mechanism between MoS2 and MgAl-LDH in MoS2/MgAl-LDH, photoluminescence (PL) measurements of the samples were also carried out. The PL spectra of the samples in the range λ = 265–330 nm with an excitation wavelength of 250 nm are shown in Fig. 6f. These materials exhibited a strong PL emission peak at λ ≈ 290 nm due to charge carrier capture on the surface.27 Compared with that of pure MoS2 and MgAl-LDH, the PL signal of MoS2/MgAl-LDH was the weakest, which indicated the sample had the lowest photogenerated electron–hole pair recombination rate28 and the highest electron–hole pair separation efficiency. Obviously, the recombination efficiency of electron–hole pairs was inhibited in MgAl-LDH when MoS2 grew in the MgAl-LDH layers.
Usually, nano-sized noble metals are used to modify the surfaces of semiconductors to form metal–semiconductor junctions to enhance electron–hole separation.39 However, there is no metal–semiconductor junction found in MoS2/MgAl-LDH composites, which can be confirmed by the above XPS results. Semiconductor testing is used to investigate the electrical behavior of the sample, as shown in Fig. 7. The samples were prepared into wafers 10 mm in diameter and 0.2 mm in thickness. Fig. 7a–c show the resistance tests of MgAl-LDH (Fig. 7a), MoS2 (Fig. 7b) and MoS2/MgAl-LDH (Fig. 7c), respectively. It can be clearly observed that the resistance meter of MgAl-LDH showed “O.L”, indicating that the sample was nonconducting. Interestingly, the resistance of MoS2 varied from 1.52 to “O.L”, and the resistance of MoS2/MgAl-LDH varied from 8.74 to “O.L”. To better analyze the semiconductor characteristics of MoS2 and MoS2/MgAl-LDH, the samples were tested using a semiconductor characteristic system. Fig. 7d and e showed obvious semiconductor characteristic curves, indicating similar semiconductor properties between MoS2/MgAl-LDH and MoS2. It was likely that MgAl-LDH played the role of conductive layer in MoS2/MgAl-LDH.
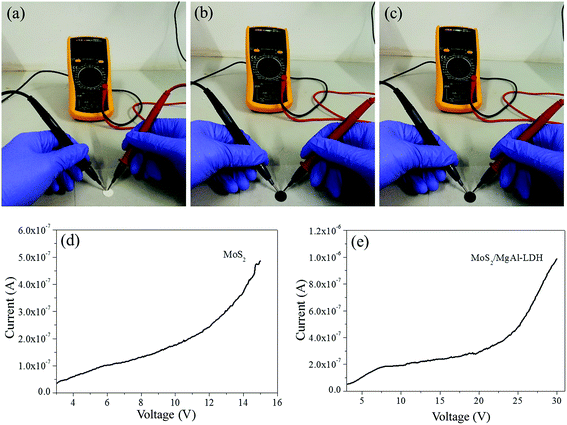 |
| | Fig. 7 Electrical characteristics of MgAl-LDH (a), MoS2 (b), and MoS2/MgAl-LDH (c). Semiconductor characteristic curves of MoS2 (d), and MoS2/MgAl-LDH (e). | |
In addition, the effect of different capture agents on the photocatalytic activity of MoS2/MgAl-LDH is shown in Fig. 8. The scavengers of O2−, h+ and OH˙ were benzoquinone (BQ), ethylenediaminetetraacetic acid (Na2–EDTA) and isopropanol (IPA), respectively. It is shown that adding IPA significantly inhibited MO degradation, indicating that OH˙ was one of the important active species in the photodegradation process. Likewise, the degradation ability of the composite is inhibited with the addition of Na2–EDTA and BQ. Therefore, h+ and O2−˙ are also major active species. In summary, OH˙, h+ and O2−˙ are the major active species for catalyzing MO in MoS2/MgAl-LDH.
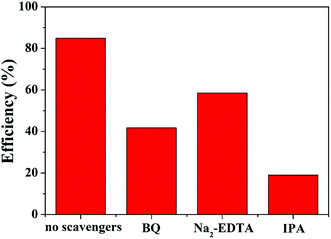 |
| | Fig. 8 Photocatalysis tests with different quenchers over MoS2/MgAl-LDH. | |
Based on the above discussion, the mechanism of the improvement in photocatalytic performance of MoS2/MgAl-LDH is revealed in Scheme 3. On the one hand, few-layer MoS2 nanosheets were prepared by the “space-confining” effect of MgAl-LDH. The bandgap of MoS2 is increased from 1.62 to 1.81 eV due to the quantum limitation effect, leading the photogenerated electron–hole pairs having a stronger redox ability. On the other hand, the MgAl-LDH layer acts as an inorganic conductive layer, which could rapidly transfer photogenerated electrons from MoS2, thus inhibiting the recombination of photogenerated electron–hole pairs. Moreover, a possible photocatalytic degradation mechanism can be proposed. First, the MO molecules are adsorbed in a layer on MoS2/MgAl-LDH due to the charge on the surface of MgAl-LDH. Meanwhile, under visible light, photoelectrons and holes are generated in the conduction and valence bands, respectively, of MoS2. Then, the photogenerated electrons transferred to the MgAl-LDH layer react with oxygen adsorbed on the surface or dissolved in water to produce superoxide. The excess holes on the valence band remain in MoS2 and react with H2O and OH− to form active substances such as OH˙.29 Then, photocatalysis proceeds by a known mechanism of visible-light-driven electron emission from the valence band to the conduction band, and the formation of oxidative intermediate species, O2−˙ and ˙OH, results in the degradation of MO.
| | |
MoS2 + hν → MoS2(e− + h+)
| (5) |
| | |
MoS2(e−) + H+ → MoS2 + H˙
| (6) |
| | |
MoS2(e−) + O2 → MoS2 + O2−˙
| (7) |
| | |
MoS2(h+) + H2O → MoS2 + H+ + OH˙
| (9) |
| |
 | (10) |
| |
 | (11) |
| | |
Dye + h+ → oxidation products
| (12) |
| | |
Dye + e− → reduction products
| (13) |
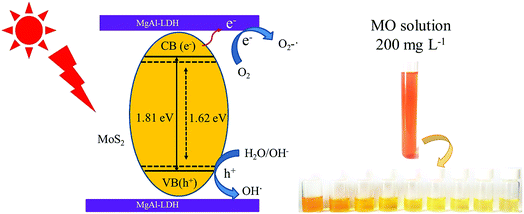 |
| | Scheme 3 Photocatalytic mechanism schematic of MO degradation by MoS2/MgAl-LDH. | |
4. Conclusions
In summary, few-layer MoS2 was successfully grown in MgAl-LDH layers. By decreasing the domain size of MoS2, the bandgap of MoS2 was increased from 1.62 eV (flower-like MoS2) to 1.81 eV (MoS2/MgAl-LDH), and the MoS2/MgAl-LDH composite exhibits a significantly enhanced full-spectrum response in the wavelength range of 300–800 nm. More importantly, the MgAl-LDH layer acts as an inorganic conductive layer to transport photogenerated electrons efficiently. As a result, there is a lower recombination efficiency of photogenerated electron–hole pairs in the MoS2/MgAl-LDH composite. Therefore, the MoS2/MgAl-LDH composite exhibited an outstanding catalytic capacity and a superior cycle performance. The composite completely degraded the MO in 50 mg L−1 and 100 mg L−1 MO solutions in 45 min and 105 min, respectively. Furthermore, the composite also shows a degradation rate over 84% in 120 min even for a MO solution concentration as high as 200 mg L−1, and retained 80% of the initial degradation rate after four cycles. The MoS2/MgAl-LDH composite can be considered as a promising photocatalyst for waste water treatment.
Conflicts of interest
There are no conflicts to declare.
Acknowledgements
We acknowledge the financial support from the National Natural Science Foundation of China (No. 51672052), Guangxi Distinguished Experts Special Fund (2015B017), Guangxi Graduate Education Innovation Program and Improving the Basic Ability of Young and Middle-aged University Teachers in Guangxi (No. KY2018KY0256).
References
- K. Iqbal, A. Iqbal, A. M. Kirillov, B. Wang, W. Liu and Y. Tang, J. Mater. Chem. A, 2017, 5, 6716–6724 RSC.
- J. S. Valentea, F. Tzompantzib and J. Princec, Appl. Catal., B, 2011, 102, 276–285 CrossRef.
- X. Liu, X. Zhao, Y. Zhu and F. Zhang, Appl. Catal., B, 2013, 140, 241–248 CrossRef.
- V. K. Gupta and T. A. Saleh, Environ. Sci. Pollut. Res. Int., 2013, 20, 2828–2843 CrossRef CAS PubMed.
- O. Legrini, E. Oliveros and A. M. Braun, Chem. Rev., 1993, 93, 671–698 CrossRef CAS.
- H. Li, J. Li, C. Xu, P. Yang, D. H. L. Ng, P. Song and M. Zuo, J. Alloys Compd., 2017, 698, 852–862 CrossRef CAS.
- J. Cha, K. Koski, K. Huang, K. Wang, W. Luo and D. Kong, Nano Lett., 2013, 13, 5913–5918 CrossRef CAS PubMed.
- K. Wang, J. Wang, J. Fan, M. Lotya, A. O’Neill, D. Fox, Y. Feng, X. Zhang, B. Jiang, Q. Zhao, H. Zhao, J. Coleman, L. Zhang and W. Blau, ACS Nano, 2013, 7, 9260–9267 CrossRef CAS PubMed.
- Y. Li, Y. Rao, K. F. Mak, Y. You, S. Wang, C. R. Dean and T. F. Heinz, Nano Lett., 2013, 13, 3329–3333 CrossRef CAS PubMed.
- T. Li and G. Galli, J. Phys. Chem. C, 2007, 111, 16192–16196 CrossRef CAS.
- A. Splendiani, L. Sun, Y. Zhang, T. Li, J. Kim, C. Y. Chim, G. Galli and F. Wang, Nano Lett., 2010, 10, 1271–1275 CrossRef CAS PubMed.
- M. Lotya, Y. Hernandez, P. J. King, R. J. Smith, V. Nicolosi, L. S. Karlsson, F. M. Blighe, S. De, Z. Wang, I. T. McGovern, G. S. Duesberg and J. N. Coleman, J. Am. Chem. Soc., 2009, 131, 3611–3620 CrossRef CAS PubMed.
- M. Lotya, P. J. King, U. Khan, S. De and J. N. Coleman, ACS Nano, 2010, 4, 3155–3162 CrossRef CAS PubMed.
- R. J. Smith, P. J. King, M. Lotya, C. Wirtz, U. Khan, S. De, A. O’Neill, G. S. Duesberg, J. C. Grunlan, G. Moriarty, J. Chen, J. Wang, A. I. Minett, V. Nicolosi and J. N. Coleman, Adv. Mater., 2011, 23, 3944–3948 CrossRef CAS PubMed.
- M. D. J. Quinn, N. H. Ho and S. M. Notley, ACS Appl. Mater. Interfaces, 2013, 5, 12751–12756 CrossRef CAS PubMed.
- M. Li, L. Zhang, X. Fan, M. Wu, Y. Du, M. Wang, Q. Kong, L. Zhang and J. Shi, Appl. Catal., B, 2016, 190, 36–43 CrossRef CAS.
- S. Mancipe, F. Tzompantzi and R. Gómez, Appl. Clay Sci., 2017, 136, 67–74 CrossRef CAS.
- P. Kuśtrowski, A. Rafalska-Łasocha, D. Majda, D. Tomaszewska and R. Dziembaj, Solid State Ionics, 2001, 141, 237–242 CrossRef.
- Y. Shi, Y. Wang, J. I. Wong, A. Y. S. Tan, C. L. Hsu, L. J. Li, Y. C. Lu and H. Y. Yang, Sci. Rep., 2013, 3, 2169 CrossRef PubMed.
- Y. Sun, X. Hu, W. Luo and Y. Huang, J. Mater. Chem., 2011, 22, 425–431 RSC.
- Y. Zhang, N. Afzal, L. Pan, X. Zhang and J. Zou, Adv. Sci., 2019, 6, 1900053–1900072 CrossRef PubMed.
- V. O. Koroteev, L. G. Bulusheva, I. P. Asanov, E. V. Shlyakhova, D. V. Vyalikh and A. V. Okotrub, J. Phys. Chem. C, 2011, 115, 21199–21204 CrossRef CAS.
- Y. Teng, H. Zhao, Z. Zhang, Z. Li, Q. Xia, Y. Zhang, L. Zhao, X. Du, Z. Du and P. Lv, ACS Nano, 2016, 10, 8526–8535 CrossRef CAS PubMed.
- G. Shen, L. Pan, Z. Lü, C. Wang, F. Aleem, X. Zhang and J. Zou, Chin. J. Catal., 2018, 39, 920–928 CrossRef CAS.
- Z. Lv, N. Mahmood, M. Tahir, L. Pan, X. Zhang and J. Zou, Nanoscale, 2016, 8, 18250–18269 RSC.
- Y. Zhou, L. Shuai, X. Jiang, F. Jiao and J. Yu, Adv. Powder Technol., 2015, 26, 439–447 CrossRef CAS.
- C. Y. Lin, Y. C. Wang, S. J. Hsu, C. F. Lo and W. G. Diau, J. Phys. Chem. C, 2010, 114, 176–184 Search PubMed.
- X. Liu, L. Pan, Q. Zhao, T. Lv, G. Zhu, T. Chen, T. Lu, Z. Sun and C. Sun, Chem. Eng. J., 2012, 183, 238–243 CrossRef CAS.
- M. O. Ansari, M. M. Khan, S. A. Ansari, I. Amal, J. Lee and M. H. Cho, Mater. Lett., 2014, 114, 159–162 CrossRef CAS.
- W. Zhang, X. Xiao, L. Zheng and C. Wan, Appl. Surf. Sci., 2015, 358, 468–478 CrossRef CAS.
- R. Saravanan, D. Manoj, J. Qin, M. Naushad, F. Gracia, A. F. Lee, M. M. Khan and M. A. G. Pinilla, Process Saf. Environ. Prot., 2018, 120, 339–347 CrossRef CAS.
- Q. Chen, C. Zhao, Y. Wang, Y. Chen, Y. Ma, Z. Chen, J. Yu, Y. Wu and Y. He, Sol. Energy, 2018, 171, 426–434 CrossRef CAS.
- X. Wu, D. Zhang, F. Jiao and S. Wang, Colloids Surf., A, 2016, 508, 110–116 CrossRef CAS.
- L. Lu, R. Shan, Y. Shi, S. Wang and H. Yuan, Chemosphere, 2019, 222, 391–398 CrossRef CAS PubMed.
- P. Šárka, J. Krýsa, J. Jirkovský, F. Claude, M. Gilles and P. Vanessa, Appl. Catal., B, 2015, 170–171, 25–33 Search PubMed.
- C. Lee, H. Yan, L. E. Brus, T. F. Heinz, J. Hone and S. Ryu, ACS Nano, 2010, 4, 2695–2700 CrossRef CAS PubMed.
- S. Mancipe, F. Tzompantzi and R. Gómez, React. Kinet., Mech. Catal., 2017, 122, 625–634 CrossRef CAS.
- D. S. Ginley and M. A. Butler, J. Appl. Phys., 1977, 48, 2019–2021 CrossRef CAS.
- C. Liu, D. Kong, P. C. Hsu, H. Yuan, H. W. Lee, Y. Liu, H. Wang, S. Wang, K. Yan, D. Lin, P. A. Maraccini, K. M. Parker, A. B. Boehm and Y. Cui, Nat. Nanotechnol., 2016, 11, 1098–1104 CrossRef CAS PubMed.
|
| This journal is © The Royal Society of Chemistry 2019 |
Click here to see how this site uses Cookies. View our privacy policy here.  Open Access Article
 *ab
*ab

![[double bond, length as m-dash]](https://www.rsc.org/images/entities/char_e001.gif) O stretching vibration, which may be caused by the formation of a small amount of oxide on the MoS2 surface. The peaks at 1113 and 1118 cm−1 for MoS2/MgAl-LDH and MoS2, respectively, can be attributed to the S
O stretching vibration, which may be caused by the formation of a small amount of oxide on the MoS2 surface. The peaks at 1113 and 1118 cm−1 for MoS2/MgAl-LDH and MoS2, respectively, can be attributed to the S![[double bond, length as m-dash]](https://www.rsc.org/images/entities/char_e001.gif) O asymmetric stretching vibration. In the spectra of MoS2/MgAl-LDH and MoS2, the peak at 624 cm−1 can be assigned to the Mo–S stretching vibration.
O asymmetric stretching vibration. In the spectra of MoS2/MgAl-LDH and MoS2, the peak at 624 cm−1 can be assigned to the Mo–S stretching vibration.

![[double bond, length as m-dash]](https://www.rsc.org/images/entities/char_e001.gif) C/C–C23 and a weak peak at 288.5 eV for C
C/C–C23 and a weak peak at 288.5 eV for C![[double bond, length as m-dash]](https://www.rsc.org/images/entities/char_e001.gif) O in oxygen-containing functional groups. The XPS results show that there is no chemical bond between MoS2 and MgAl-LDH in the MoS2/MgAl-LDH catalyst.
O in oxygen-containing functional groups. The XPS results show that there is no chemical bond between MoS2 and MgAl-LDH in the MoS2/MgAl-LDH catalyst.


