 Open Access Article
Ferroelectric properties and Raman spectroscopy of the [(C4H9)4N]3Bi2Cl9 compound†
W. Trigui * and
F. Hlel
Faculty of Sciences, Laboratory of Spectroscopic and Optical Characterization of Materials, University of Sfax, BP1171, 3018 Sfax, Tunisia
First published on 6th August 2019
Abstract
The exploration of ferroelectric hybrid materials is highly appealing due to their great technological significance. They have the potential to conserve power and amazing applications in information technology. In line with this, we herein report the development of a [(C4H9)4N]3Bi2Cl9 tetra-alkyl hybrid compound that exhibits ferroelectric properties. The phase purity was confirmed by Rietveld refinement of the X-ray powder diffraction pattern. It crystallizes, at room temperature, in the monoclinic system with the P21/n space group. The outcome of temperature dependence of the dielectric constant proved that this compound is ferroelectric below approximately 238 K. The dielectric constants have been fitted using the modified Curie–Weiss law and the estimated γ values are close to 1. This confirms classical ferroelectric behavior. Raman spectroscopy is efficiently utilized to manifest the origin of the ferroelectricity, which is ascribed to the dynamic motion of cations as well as distortion of the anions. Moreover, the analysis of the wavenumbers and the half-width for δs(Cl–Bi–Cl) and ω(CH2) modes, based on the order–disorder model, allowed us to obtain the thermal coefficient and activation energy near the para-ferroelectric phase transition.
1. Introduction
The design of organic–inorganic hybrid materials, based on trivalent metal halides, has attracted scientific attention not only due to their interesting structural diversity but also to their unique physical properties as well as possible novel applications in optoelectronics, photovoltaic cells, semiconductor devices, electrochemical transistors, and electroluminescent diodes.1–4Crystals of halogeno-bismuthates(III) and antimonates(III) with tetralkylammonium cations with the general formula [(CnH2n+1)4N]3M2X9 (where [(CnH2n+1)4N] = organic cations with n = 1, 2, 3 or 4; M = Bi, Sb and X = Cl, Br, I) are frequently characterized by their phase transitions.5–8 It was found that the complexity of the phase transitions increases with increasing the “n” number of carbon atoms in the alkylammonium chain up to four carbon atoms.9,10
The phase transitions are usually connected with an appearance of interesting physical properties such as ferroelectricity and ferroelasticity, etc.11–13 Thus, the para-ferroelectric phase transitions are characterized by an “order–disorder” mechanism related to the dynamical reorientation of the alkyl cation's chains.14–17 This motion is substantially diminished on lowering temperature yielding ordered phases.18
The anionic [M2X9]3− sublattices are built of basic distorted MX6 octahedral units sharing corners, edges or faces to form anionic discrete bioctahedra (0D),19 chains (1D)20 or layers (2D).21 It is worthwhile to mention that a special interest has been focused on compounds with the inorganic halide M2X9 since the discovery of their ferroelectric properties.22,23
In this work we intend to spot on the nature of para-ferroelectric phase transition at 238 K in [(C4H9)4N]3Bi2Cl9 compound. The crystal structure of this hybrid compound, at room temperature, was previously determined and reported.24
In this contribution, we report the results of the X-ray powder diffraction, dielectric and Raman studies. The temperature dependence of Raman spectra have enabled us to establish the key role played by the tetra-butylammonium cations and the halogeno-bismuthate anions, in the para-ferroelectric transition.
2. Experiments and methods
Phase purity, space group and lattice parameters were checked by X-ray powder diffraction analysis. XRD data was collected, at room temperature, using a Philips PANalytical X'pert Pro X-ray powder diffractometer operating with copper radiation (λ = 1.540598 Å) over a wide range of Bragg angles (6° ≤ 2θ ≤ 52°). Refinements were carried out using FULLPROF program based on Rietveld method.25The impedance analyzer (Agilent 4294A) was used to characterize the dielectric properties in the frequency range, between 50 Hz and 6 MHz, in the temperature range within 195–260 K. The polycrystalline material was used in a form of a pressed pellet with a diameter equal to 8 mm and a thickness of 1.3 mm.
Raman spectra of [(C4H9)4N]3Bi2Cl9 monocrystalline sample were collected using a T-64000 Raman (Horiba-Jobin-Yvon) with cooled CCD detector. The excitation wave-length radiation was 647.1 nm, using an argon-krypton laser (coherent spectrum) with a 50 mW power. The spectra were registered with 1800 per mm grating from 170 to 3300 cm−1. The resolution of the instrument was set at 0.2 cm−1. The measurements were carried out under microscope in the backscattering geometry using an X-50 LF objective, on the (001) natural face of single crystal in Z(XX)Z polarization, where X stands for a birefringence direction. The low temperature measurements were performed with a cold liquid nitrogen cryostat. Temperature stability around ±1 K was achieved. The error range for the determination of the peak position was ±0.3 cm−1.
3. Results and discussion
3.1. X-ray powder diffraction analysis
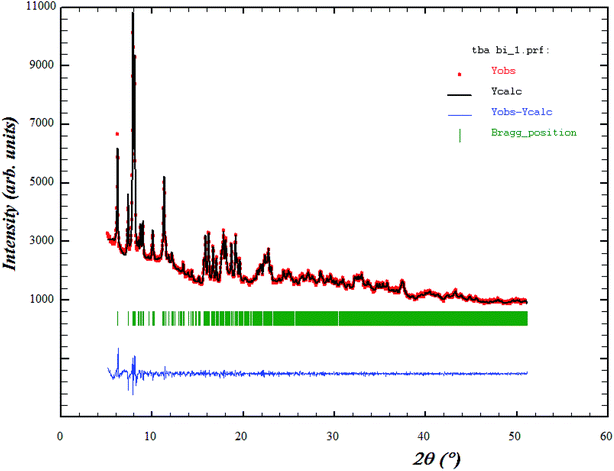
The X-ray diffraction pattern at 293 K for the tri-tetrabutylammonium nona chlorobibismuthate (TBA3Bi2Cl9) compound is plotted in Fig. 1. The circles symbolize the experimental data and the line corresponds to the simulated pattern. The green bars indicate good matching of all the peak positions.The purity of the studied compound was proved and all reflection peaks are successfully refined in the monoclinic system with P21/n space group, using Rietveld method. The corresponding lattice parameters were found to be: a = 11.356 Å, b = 22.342 Å, c = 28.587 Å, β = 96.59° and the cell volume was V = 7155.32 Å3. Those parameters are in good agreement with the published results.24 The quality of the refinement was evaluated through the goodness of fit χ2 = 1.20 and the reliability factors obtained are Rωp = 11.90, Rp = 11.80 and Rexp = 10.85.
3.2. Dielectric studies
The temperature dependence of the real part ε′, imaginary part ε′′of the dielectric permittivity and the dielectric loss Tg(δ), of different frequencies, are plotted in Fig. 2. From these curves, we can observe two dielectric relaxations around 214 and 235 K in the ε′ variation but only one relaxation in the ε′′ and Tg(δ) plots (Tc = 235 K). This prominent dielectric peak at Tc may be associated to a para-ferroelectric phase transition in the title compound. Its maximum does not change while the magnitude decreases with the increase in frequency. In fact, this result suggests that this sample does not present any type of dielectric relaxation in the investigated frequency range.26,27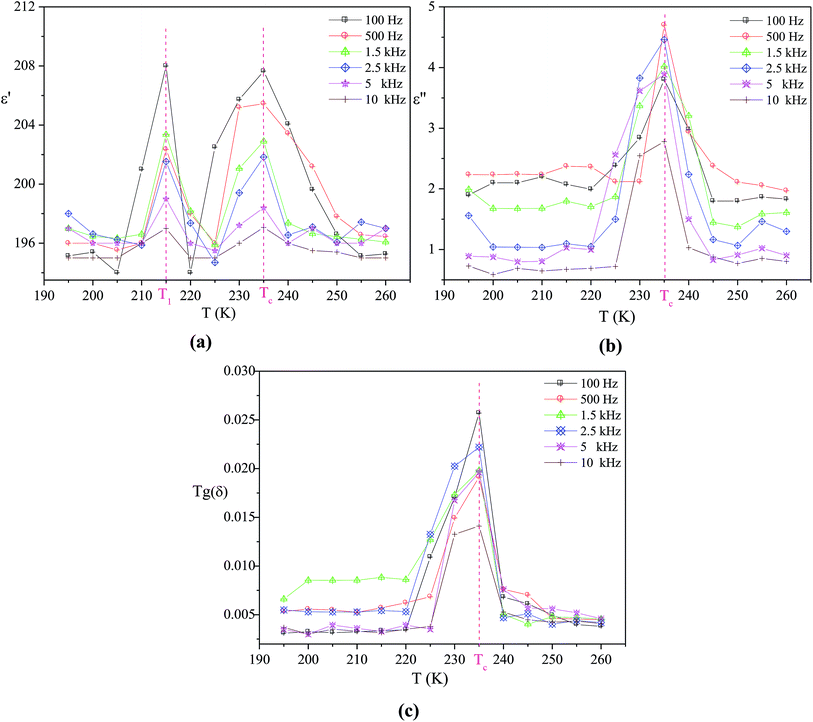 | ||
| Fig. 2 Temperature dependence at various frequencies of the real part ε′ of the complex permittivity (a), the imaginary part ε′′ of the complex permittivity (b) and the dielectric loss Tg(δ) (c). | ||
The dielectric data in the paraelectric state obey quite well the Curie–Weiss law, described by the following relation:
 | (1) |
The temperature dependence of the dielectric reciprocal (1/ε′), at 500 Hz, is illustrated in Fig. 3a. This plot gives a straight line with the X-axis intercept at T0 = 227 K. For the classical ferroelectrics, the order of the para-ferroelectric phase transition can be determined from the value of T0. In case of T0 ≠ TC, the phase transition is of a first order type. If T0 = TC, this transition is of a second order type.28 According to our measurements, the value of T0 is different from TC = 235 K which suggests that this transition is of the first order type29,30 and confirms the drawing results from the differential scanning calorimetry analysis.24
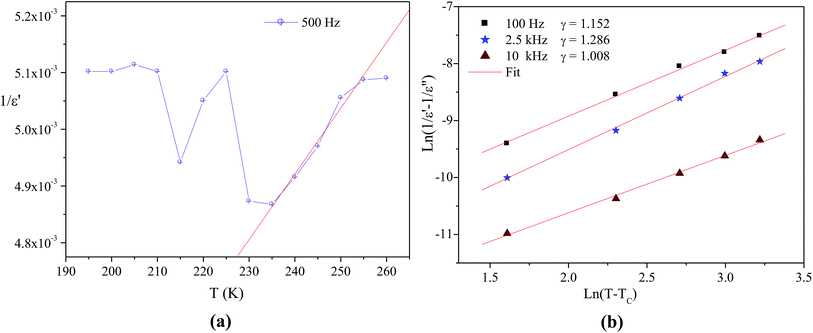 | ||
Fig. 3 (a) Temperature variation of 1/ε′ at some frequency, (b)  as a function of ln(T − TC) for different frequency (the solid red lines denote the fitting curve to the modified Curie–Weiss law). as a function of ln(T − TC) for different frequency (the solid red lines denote the fitting curve to the modified Curie–Weiss law). | ||
In order to determine the nature of classic or relaxor ferroelectrics, Uchino and Nomura31 have proposed a more general expression of the Curie–Weiss law by introducing the exhibitor criticizes γ:
 | (2) |
 is the real dielectric constant at T = TC and γ (1 < γ < 2) corresponds to the degree of relaxation.
The factor γ translates the diffuse character of the transition. However, for ideal relaxor ferroelectrics, the γ value should amount to 2, and for classical ferroelectrics it is near to 1.32,33
Fig. 3b shows the logarithmic plots related to the eqn (2) at various frequencies. The obtained γ values are 1.152, 1.286 and 1.008 corresponding to the frequencies 100 Hz, 2.5 kHz and 10 kHz, respectively. This result proves that the [(C4H9)4N]3Bi2Cl9 is a classical ferroelectric compound.
3.3. Temperature evolution of the Raman spectra
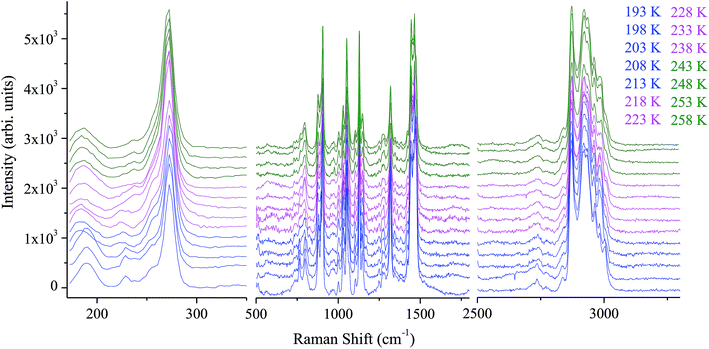
The assignment of the Raman spectrum at room temperature has been performed and presented in table S. Raman spectra in the frequency range 170–3300 cm−1, have been collected for several temperatures (from 193 to 258 K). Fig. 4 shows the temperature evolution of Raman spectra obtained in three spectral ranges.The positions of most analyzed bands are constant even in the close vicinity of both phase transitions. However, one can distinguish several bands showing changes in their positions and width at half maximum, by the order of a few cm−1 when crystal undergoes the phase transitions at T1 and T2.
In order to quantitatively analyze the evolution of Raman bands versus temperature, each spectrum were analyzed by means Labspec software on the basis of Gaussian and Lorentzian shapes. Fig. S1 and S2† reports position and half-width temperature dependence of selected lines, respectively.
The lines issued from the internal modes of Bi2Cl9 anions do not show significant changes where the wavenumbers and lines width exhibit a slight change. However, the Cl–Bi–Cl bending vibration at 184.4 cm−1, presents a remarkable shift toward high frequencies (of 3 cm−1) and a line broadening (of 5 cm−1) on heating above the phase transitions.
We may say that the increase of dynamical motion of the alkyl chains of tetrabutylammonium cations has evoked the distortion of the bi-octahedral anions.5,34
The band related to the symmetric stretching vibration νs(C–C) is located at 797.4 cm−1. Its maximum shifts toward lower wavenumbers by 3 cm−1 around T1 and towards higher wavenumbers around T2. A similar behavior was observed for the band located at 769.8 cm−1 which is assigned to ν4(NC4) and ρr(CH2). The symmetric stretching vibration νs of (CH2) and (CH3) groups shows a variation in its position to the high frequencies by 3 cm−1 and by 5 cm−1 in its half-width. The band at 1319.8 cm−1 assigned to the wagging mode of (CH2) group increase by 3 cm−1, while the variation of the symmetric bending vibration δs(C–C–C) and δs(C–N–C) observed at 906.9 cm−1 is by 2 cm−1 for both wavenumber and half-width.
Over the phase I, the band corresponding to the antisymmetric bending mode δas(CH3) weakly moves to high frequencies. To verify that the phase transitions are connected to a change in the dynamical state of the [(C4H9)4N]+ cations and to the distortion of the [Bi2Cl9]3− anions, we have focused our study on tow selected bands P2 and P29 associated to the bending vibration of (Cl–Bi–Cl) and to the wagging mode ω(CH2) (Fig. 5), respectively.
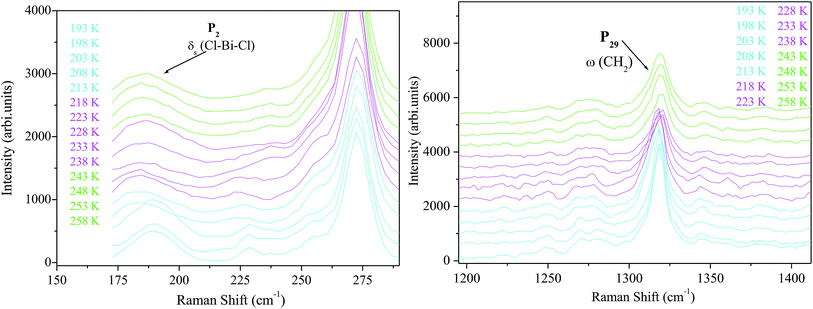 | ||
| Fig. 5 Temperature evolution of the Raman spectra in the frequency region assigned to the bending vibration of (Cl–Bi–Cl) and to the wagging mode of (CH2). | ||
 | (3) |
Generally, the values of γ are small so that we can approximate eqn (3) by:
 | (4) |
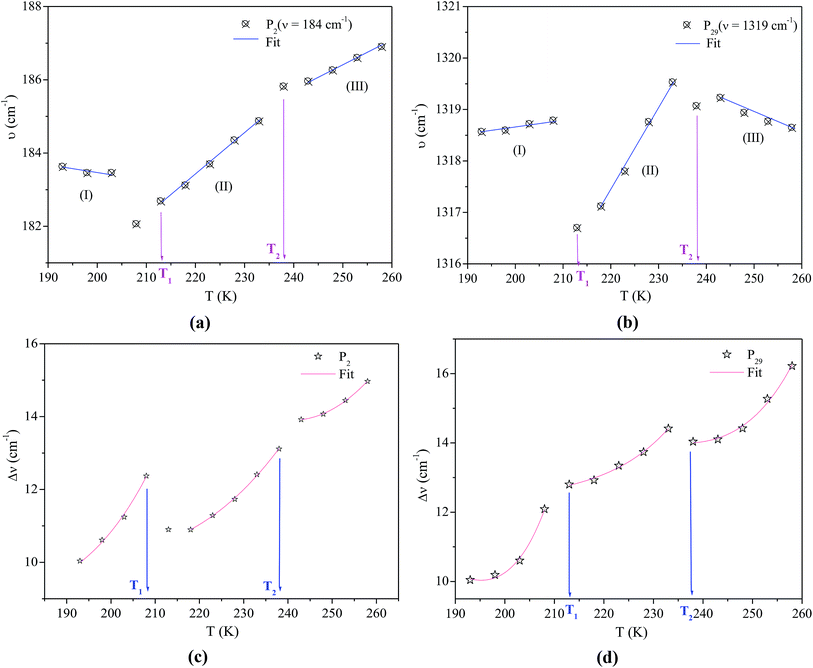
The experimental values of P2 and P29 modes wavenumber, at various temperatures, were fitted to the equation above (Fig. 6a and b). A summary of the experimental thermal coefficient γ values are collected in Table 1. The ‘‘hard-core’’ frequency ν0 values, for the two bands, are (182.7, 1316.5 cm−1) at T1 and (185.8, 1319.1 cm−1) at T2, respectively.
| Peak | Temperature range | Thermal coefficient, γ (K−1) |
|---|---|---|
| P2 | T < T1 | γ = −1.83 × 10⁻⁴ |
| T1 < T < T2 | γ = 1.23 × 10⁻³ | |
| T > T2 | γ = 6.83 × 10⁻⁴ | |
| P29 | T < T1 | γ = −2.48 × 10⁻⁵ |
| T1 < T < T2 | γ = 2.49 × 10⁻⁴ | |
| T > T2 | γ = 5.97 × 10⁻⁵ |
The thermal coefficient is related to the variation of the wavenumber position and the volume of the crystal. It is expressed by the following equation:
 | (5) |
According to Gruneisen,37 the relative change of each vibrational frequency is directly proportional to the relative change in the volume. The increase of the thermal coefficient, related to the shift of the two peaks positions to high frequencies, indicates a decrease of the crystal volume.38 Indeed, the cation geometry can be changed from cross symmetry to broken cross symmetry by reorientational motion of the alkylammonium chains going through the phase transitions.16,39 This behavior suggests that the observed phase transitions are related to the reorientational motion of the cations coupled to the distortion of the anions.
According to Langevin42,43 the temperature dependence of FWHM can be expressed as:
 | (6) |
The mean reorientational time of the atoms τR is given by:
 | (7) |
 | (8) |
The values of the full widths at half maximum are obtained using ultra-high resolution triple additive configuration. Fig. 6c and d show the FWHM experimental values of P2 and P29, at various temperatures, fitted according to eqn (8).
For the bending vibration of (Cl–Bi–Cl), the estimated activation energy values are Ea(I) = 18.23 kJ mol−1 for T < T1, Ea(II) = 15.59 kJ mol−1 for T1< T < T2 and Ea(III) = 11.46 kJ mol−1 for T > T2. Whereas, the obtained values for the wagging mode ω(CH2) are Ea(I) = 40.60 kJ mol−1 for T < T1, Ea(II) = 35.92 kJ mol−1 for T1< T < T2 and Ea(III) = 30.96 kJ mol−1 for T > T2. In fact, the decrease in activation energy values for these Raman bands is probably due to the decrease in the population involved in these vibrations, which may be related to the change of the [(C4H9)4N]+ cations conformation as well as the distortion of the [Bi2Cl9]3− anions.
4. Conclusion
The [(C4H9)4N]3Bi2Cl9 compound, with P21/n space group of the monoclinic system was investigated as a function of temperature. The existence of a para-ferroelectric phase transition at 238 K has been established by the dielectric measurements. The empirical parameter γ indicates that this compound is a classical ferroelectric. The Raman spectroscopic study clearly shows spectacular temperature changes of the internal vibrations of cation and the anion, especially the deformation of (Cl–Bi–Cl) and the (CH2) wagging mode. A detailed analysis of the wavenumber and the bandwidth was performed in the framework of order–disorder models. This study proves that the phase transitions are related to the rotational motion of the tetra-butylammonium cations and to the distortion of the [Bi2Cl9]3− anions.Conflicts of interest
There are no conflicts to declare.References
- R. Jakubas and L. Sobczyk, Phase transitions in alkylammonium halogenoantimonates and bismuthates, Phase Transitions, 1990, 20, 163–193 CrossRef CAS.
- S. T. Han, Y. Zhou and V. A. Roy, Towards the Development of Flexible Non-Volatile Memories, Adv. Mater., 2013, 25, 5425–5449 CrossRef CAS PubMed.
- I. Matulková, J. Cihelka, M. Pojarová, K. Fejfarova, M. Dušek, P. Vanek, J. Kroupa, R. Krupková, J. Fábry and I. Nemec, A new series of 3,5-diamino-1,2,4-triazolium(1+) inorganic salts and their potential in crystal engineering of novel NLO materials, CrystEngComm, 2012, 14, 4625–4636 RSC.
- C. Sanchez, B. Julian, P. Belleville and M. Popall, Applications of hybrid organic–inorganic nanocomposites, J. Mater. Chem., 2005, 15, 3559–3592 RSC.
- W. Trigui, A. Oueslati, F. Hlel and A. Bulou, Raman study of order–disorder phase transition in [(C3H7)4N]3Bi3Cl12 compound, J. Mol. Struct., 2016, 1106, 19–29 CrossRef CAS.
- S. Hajlaoui, I. Chaabane, A. Oueslati, K. Guidara and A. Bulou, Raman scattering investigation of the high temperature phase transition in [N(C3H7)4]2SnCl6, Spectrochim. Acta, Part A, 2015, 136, 547–552 CrossRef CAS PubMed.
- N. Weslati, I. Chaabane and F. Hlel, A theoretical study on the molecular structure and vibrational (FT-IR and Raman) spectra of a new organic–inorganic compound of 2[N(C3H7)4]SbCl4, Vib. Spectrosc., 2015, 81, 90–95 CrossRef CAS.
- G. Bator, R. Jakubas and J. Baran, Vibrational study of the structural phase transitions in the (CH3ND3)3Sb2Br9 (d-MABA) crystals by infrared spectroscopy, Vib. Spectrosc., 2001, 25, 101–113 CrossRef CAS.
- I. Płowaś, A. Białońska, G. Bator, R. Jakubas, W. Medycki and J. Baran, Tris(allylammonium) Hexabromobismuthate(III)-Crystal Structure, Phase Transitions and Thermal, Dielectric, Vibrational and 1H NMR Properties Over a Range of Temperatures, Eur. J. Inorg. Chem., 2012, 4, 636–646 CrossRef.
- J. Tarasiewicz, R. Jakubas, J. Zaleski and J. Baran, Structural characterization, thermal, dielectric and spectroscopic properties of di(n-pentylammonium) pentabromoantimonate(III): [n-C5H11NH3]2[SbBr5], J. Mol. Struct., 2008, 876, 86–101 CrossRef CAS.
- M. Ben Bechir, K. Karoui, M. Tabellout, K. Guidara and A. Ben Rhaiem, Electric and dielectric studies of the [N(CH3)3H]2CuCl4 compound at low temperature, J. Alloys Compd., 2014, 588, 551–557 CrossRef CAS.
- R. Jakubas, J. Jóźków, G. Bator, J. Zaleski, J. Baran and P. Frangois, Phase transitions in i-butylammonium halogenoantimonate(III) and bismuthate(III) crystals, J. Mol. Struct., 1997, 436, 315–325 CrossRef.
- Y. Heng-Yun, T. Yuan-Yuan, L. Peng-Fei, L. Wei-Qiang, G. Ji-Xing, H. Xiu-Ni, C. Hu, S. Ping-Ping, Y. Yu-Meng and X. Ren-Gen, Metal-free three-dimensional perovskite ferroelectrics, Science, 2018, 361, 151–155 CrossRef PubMed.
- J. Tarasiewicz, R. Jakubas, J. Baran and A. Pietraszko, On the structural phase transitions in [n-C4H9NH3]2[SbBr5]: thermal, dielectric and infrared studies, J. Mol. Struct., 2004, 697, 161–171 CrossRef CAS.
- H. Chouaib, N. Elfaleh, S. Karoui, S. Kamoun and M. P. F. Graça, Synthesis, crystal structure, thermal analysis and dielectric properties of (C8H12N)3SnCl6Cl compound, Synth. Met., 2016, 217, 129–137 CrossRef CAS.
- J. Binns, G. J. McIntyre, J. A. Barreda-Argueso, J. Gonzalez, F. Aguado, F. Rodriguez, R. Valiente and S. Parsons, Phase transition sequences in tetramethylammonium tetrachlorometallates by X-ray diffraction and spectroscopic measurements, Acta Crystallogr., Sect. B: Struct. Sci., Cryst. Eng. Mater., 2017, 73, 844–855 CrossRef CAS PubMed.
- A. R. Lim and K. Y. Lim, Structural changes near phase transition temperatures for the [N(C2H5)4] groups in hydrated [N(C2H5)4]2CuCl4xH2O, J. Therm. Anal. Calorim., 2017, 130, 879–884 CrossRef CAS.
- B. Zarychta and J. Zaleski, Phase Transitions Mechanism and Distortion of SbCl63− Octahedra in Bis(n-butylammonium) Pentachloroantimonate(III) (C4H9NH3)2[SbCl5], Z. Naturforsch., B: J. Chem. Sci., 2006, 61, 1101–1109 CAS.
- D. Fredj, C. Ben Hassen, S. Elleuch, H. Feki, N. C. Boudjada, T. Mhiri and M. Boujelbene, Structural, vibrational and optical properties of a new organic–inorganic material: (C5H8N3)2[BiCl5], Mater. Res. Bull., 2017, 85, 23–29 CrossRef CAS.
- N. A. Yelovik, A. V. Mironov, M. A. Bykov, A. N. Kuznetsov, A. V. Grigorieva, Z. Wei, E. V. Dikarev and A. V. Shevelkov, Iodobismuthates Containing One-Dimensional BiI4− Anions as Prospective Light-Harvesting Materials: Synthesis, Crystal and Electronic Structure, and Optical Properties, Inorg. Chem., 2016, 55, 4132–4140 CrossRef CAS PubMed.
- S. A. Adonin, M. N. Sokolov and V. P. Fedin, Polynuclear halide complexes of Bi(III): From structural diversity to the new properties, Coord. Chem. Rev., 2016, 312, 1–21 CrossRef CAS.
- P. Szklarz, R. Jakubas, A. Piecha-Bisiorek, G. Bator, M. Chański, W. Medycki and J. Wuttke, Organic–inorganic hybrid crystals, 2,4,6-CH3PyH3Sb2Cl9 and 2,4,6-CH3PyH3Bi2Cl9. Crystal structure characterization and tunneling of CH3 groups studied by 1H NMR and neutron spectroscopy, Polyhedron, 2018, 139, 249–256 CrossRef CAS.
- B. Kulicka, T. Lis, V. Kinzhybalo, R. Jakubas and A. Piecha, Novel anionic water-containing inorganic fragment in [4-NH2PyH]8[Bi2Cl11][Bi2Cl9(H2O)2]: Structural characterization, thermal, dielectric and vibrational properties, Polyhedron, 2010, 29, 2014–2022 CrossRef CAS.
- W. Trigui, A. Oueslati, I. Chaabane and F. Hlel, Synthesis, crystal structure, thermal analysis and dielectric properties of [(C4H9)4N]3Bi2Cl9 compound, J. Solid State Chem., 2015, 227, 10–16 CrossRef CAS.
- J. Rodriguez-Carvajal, Recent advances in magnetic structure determination by neutron powder diffraction, Phys. B, 1993, 192, 55–69 CrossRef CAS.
- H. Khemakhem, T. Mhiri and A. Daoud, Ferroelectric and electric properties of Rb0.6(NH4)0.4HSO4 single crystal, Solid State Ionics, 1999, 117, 337–343 CrossRef CAS.
- R. M. Shymkiv, S. A. Svelber, I. V. Karpa, I. N. Katerynchuk, I. M. Kunyo and E. I. Phitsych, Electronic spectra and phase transitions in thin [N(CH3)4]2CuCl4 microcrystals, Appl. Spectrosc., 2012, 78, 823–828 CrossRef CAS.
- A. Rhaiem, F. Jomni, K. Karoui and K. Guidara, Ferroelectric properties of the [N(CH3)4]2CoCl2Br2 compound, J. Mol. Struct., 2013, 1035, 140–144 CrossRef.
- R. Hajji, A. Oueslati, F. Hajlaoui, A. Bulou and F. Hlel, Structural characterization, thermal, ac conductivity and dielectric properties of (C7H12N2)(2) SnCl6 Cl-2 center dot 1.5H2O, Phase Transitions, 2016, 89, 523–542 CrossRef CAS.
- W. Ben Nasr, K. Karoui, A. Bulou and A. Ben Rhaiem, Li1.5Rb0.5MoO4: Ferroelectric properties and characterization of phase transitions by Raman spectroscopy, Phys. E, 2017, 93, 339–344 CrossRef CAS.
- K. Uchino and S. Nomura, Critical Exponents of the Dielectric Constants in Diffused-Phase-Transition Crystals, Ferroelectr., Lett. Sect., 1982, 1, 55–61 Search PubMed.
- D. Viehland, M. Wuttig and L. E. Cross, The glassy behavior of relaxor ferroelectrics, Ferroelectrics, 2011, 120, 71–77 CrossRef.
- T. Yan-Qing, Y. Yuan, H. Yong-Mei, D. Su-Ying and Y. Yi-Wen, Structure and dielectric properties of Ba5NdCu1.5Nb8.5O30-δ tungsten bronze ceramics, Mater. Res. Bull., 2013, 48, 1934–1938 CrossRef.
- J. Tarasiewicz, R. Jakubas and J. Baran, Raman studies of the anionic sublattices vibrations in (C5H5NH)6Bi4Cl18, J. Mol. Struct., 2002, 614, 333–338 CrossRef CAS.
- P. d. R. Andrade and S. P. S. Porto, Hard core phonon frequency at transition temperature, Solid State Commun., 1974, 14, 547–550 CrossRef CAS.
- T. S. Jung, H. L. Liu and J. T. Yu, Raman Study of the Phase Transition in [N(C2H5)4]2ZnCl4 Single Crystals, Chin. J. Phys., 2001, 39, 344–348 CAS.
- G. Lucazeau, Effect of pressure and temperature on Raman spectra of solids: anharmonicity, J. Raman Spectrosc., 2003, 34, 478–496 CrossRef CAS.
- M. Oussaid, P. Becker and C. Carabatos-Nedelec, Raman scattering investigation of order–disorder phase transitions in cadmium tris(thiourea) sulphate (CTS), J. Raman Spectrosc., 2000, 31, 529–533 CrossRef CAS.
- N. Moutia, M. Ben Gzaiel, A. Oueslati and K. Khirouni, Electrical characterization and vibrational spectroscopic investigations of order–disorder phase transitions in [N(C3H7)4]2CoCl4 compound, J. Mol. Struct., 2017, 1134, 697–705 CrossRef CAS.
- C. Carabatos-Nédelec and P. Becker, Order–disorder and structural phase transitions in solid-state materials by Raman scattering analysis, J. Raman Spectrosc., 1998, 28, 663–672 CrossRef.
- P. Schiebel and W. Prandl, Single particle dynamics in an anharmonic potential with translation-rotation coupling: crossover from weak localisation via chaos to free rotation, Z. Phys. B: Condens. Matter, 1997, 104, 137–145 CrossRef CAS.
- F. Jebari, P. Becker and C. Carabatos-Nédelec, Order–disorder phase transition in diethylenetriammonium chlorocadmate single crystals determined by Raman spectroscopy, J. Raman Spectrosc., 1994, 25, 261–265 CrossRef CAS.
- M. Oussaïd, P. Becker and C. Carabatos-Nédelec, Low Temperature Phase Transitions in Zinc Tris (Thiourea) Sulfate (ZTS) Determined by Raman Scattering, Phys. Status Solidi B, 1998, 207, 103–110 CrossRef.
- E. Szostak, A. Migdal-Mikuli, A. Kaczor and W. Nitek, Low-temperature phase transition in [Mn(OS(CH3)2)6](ClO4)2 studied by single crystal X-ray diffraction, infrared absorption and Raman scattering spectroscopies, Spectrochim. Acta, Part A, 2011, 79, 1179–1186 CrossRef CAS PubMed.
Footnote |
| † Electronic supplementary information (ESI) available. See DOI: 10.1039/c9ra02577d |
| This journal is © The Royal Society of Chemistry 2019 |

