 Open Access Article
Fabrication of NaYF4:Yb3+,Tm3+-modified Ag nanocubes with upconversion luminescence and photothermal conversion properties
Ziyu Chena,
Guixia Liu *a,
Zhenhai Cuib,
Qixin Liua,
Feng Honga,
Wensheng Yua,
Xiangting Dong
 a and
Chao Songa
aKey Laboratory of Applied Chemistry and Nanotechnology at Universities of Jilin Province, Changchun University of Science and Technology, Changchun 130022, P. R. China. E-mail: liuguixia22@163.com; Fax: +86-431-85383815; Tel: +86-431-85582574
bThe Affiliated Hospital to Changchun University of Chinese Medicine, Changchun 130021, P. R. China
First published on 3rd July 2019
Abstract
Herein, uniform Ag nanocube@NaYF4:Yb3+,Tm3+ multifunctional nanocomposites were constructed by a facile synthetic strategy. Following the successful synthesis of Ag nanocubes, cubic phase NaYF4:Yb3+,Tm3+ upconversion luminescent nanocrystals were modified on the surface of the Ag nanocubes, enhanced the mutual assistance of energy and versatility of the materials. Upon irradiation with a near-infrared laser, the nanocomposites exhibited excellent upconversion fluorescence and good photothermal conversion capability. Furthermore, the potential biological applications and biosafety of the Ag@NaYF4:Yb3+,Tm3+ nanocomposites were also demonstrated; the obtained nanocomposites could achieve a good bactericidal performance and photothermal treatment of cancer cells, and they could be potentially applied in the biomedical field as a promising agent. Furthermore, this method provides a facile approach for synthesizing a multifunctional nanocomposite with different properties.
1 Introduction
Multifunctional nanocomposites (NCs) possess many appreciable advantages due to the integration of distinctive optical, thermal and other properties; they have attracted significant attention for biomedical applications involving imaging, diagnosis, and medical treatment.1–3 In view of the development of single-component nanomaterials with tunable dimensions and multiple morphologies, the fabrication of nanocomposites containing various components strongly appeals to researchers in the emerging field of synergic nanoscience.4–6 Meanwhile, nanocomposites can combine multiple functions in one individual structure on the basis of the applied requirement, while this is difficult for single-component materials.7–10 Furthermore, the active coupling of diverse components and functions on the nanoscale may improve the mutual assistance of energy and versatility of materials, which is suitable to gain an understanding of the cooperative effect for accurate applications in different fields.Up to now, a large number of synthetic methods have been implemented to synthesize multifunctional nanocomposites such as thermal decomposition, self-assembly growth, and surface-induced strategies.11–13 Notably, most nanocomposites are prepared by combining the core compound with epitaxial shell materials in a multi-step operation with excessive external assistance. However, the traditional composite lacks better performance breakthroughs and a high-efficiency output. Thus, the fabrication of nanocomposites with more simple methods, better performance and superior structure is urgently desired.
Rare-earth upconversion luminescent nanocrystals with adjustable structures have become more prominent due to their outstanding contrastive efficiency and biosafety.14–18 Compared to traditional optical materials, rare-earth upconversion luminescent materials can only absorb a low energy light to generate high-energy light emission19–21 and possess high photochemical stability. Among all rare earth ions, Tm3+, as a typical activator of upconversion luminescence, can emit ultraviolet light under the excitation of a near-infrared light.22–24 Furthermore, as one of the best luminescent hosts, NaYF4 can achieve the highest intensity of fluorescence emission and decrease the interference of the autofluorescence background.25–28 Hence, a Yb3+, Tm3+ ion-co-doped NaYF4 upconversion luminescent material is expected to remedy the constrained limitations of traditional optical materials and attain real-time therapeutic feedback and imaging.
Silver nanomaterials have been of great interest in recent years because of their extraordinary physical and chemical properties.29 The distinctive surface enhanced Raman scattering (SERS) activity and localized surface plasmon resonance (LSPR) properties of Ag are strongly dependent on the sizes, shapes and geometries, which can produce different resonance modes.30,31 Ag nanocubes (NBs) possess a superior SERS performance compared to Ag nanospheres due to the truncated crystallographic facets that expose sets of (100) planes and increase the local electric fields. Such a favorable SERS performance promotes Ag NBs to absorb light energy more strongly and convert it into heat more efficiently.32 Moreover, the versatile biological applications of Ag NBs establish them as prospective agents not only in fighting bacterium, but also in eradicating intractable tumors, particularly multidrug-resistant cancer cells. Therefore, Ag NBs are highly desirable to develop as nanomedicines for bacterial infections and photothermal therapy of cancer.
Integrating Ag NBs and rare-earth materials into one platform is helpful to develop their respective advantages and promote further improvement in properties. However, it is crucial to cautiously balance the influence between performance enhancement and the complexities of synthesis and structure.33–36 Most traditional synthetic methods involve external assistance including a medium layer or electricity and complicated post-processing, causing structural instability and long preparation periods. Herein, we used a simple synthesis method to construct Ag NBs and NaYF4:Yb3+,Tm3+ to form multifunctional nanocomposites. In NCs, NaYF4:Yb3+,Tm3+ nanoparticles were effectively coated on individual Ag NBs with excellent dispersibility.
The synthesis procedure of Ag NBs and Ag NB@NaYF4:Yb3+,Tm3+ nanocomposites is presented in Scheme 1. Solvothermal and liquid-phase methods were used to prepare Ag NBs and NCs, respectively.
2 Experimental section
2.1 Chemicals
Analytical grade silver nitrate (AgNO3, ≥99.8%), RE2O3 (RE = Y3+, Yb3+, Tm3+ 99.99%), absolute ethyl alcohol (C2H5OH, ≥95%), and nitric acid (HNO3, 68.0%) were obtained from Sinopharm Co. Ltd. (Beijing, China). Sodium fluoride (NaF, 98.0%) was obtained from GuangFu Fine Chemical Research Institute (Tianjin, China). Poly(vinylpyrrolidone) (PVP, K90) and ethylene glycol (EG, 99.0%) were obtained from J&K Scientific Ltd. (Beijing, China). Sodium chloride (NaCl, 99.5%) was obtained from Macklin Ltd. (Shanghai, China). All chemicals in this research were directly utilized without further purification.2.2 Preparation of Ag NBs
First, 1.3875 g of PVP (K90), 2.5 mmol of AgNO3, and 35 mL of ethylene glycol (EG) were mixed in a normal beaker by magnetic stirring for 30 min and then 0.02 g of NaCl was added. Subsequently, the above mixture was further transferred into an autoclave and reacted at 160 °C for 4 h. After naturally cooling down to 23 °C, the sample was collected and washed with DI water and ethanol three times, finally, the Ag NBs were obtained by centrifuging the sample at 3000 rpm for 20 min.2.3 Preparation of NaYF4:Yb3+,Tm3+ nanoparticles
RE(NO3)3 (RE = Y3+, Yb3+, Tm3+) was prepared with the corresponding RE2O3. In a typical process, RE2O3 was dissolved in an HNO3 solution and then heated at 130 °C with continuous agitation for 4 h to evaporate extra water; ultimately, the aqueous solutions of RE(NO3)3 of fixed concentrations were obtained.NaYF4:Yb3+,Tm3+ nanoparticles were synthesized by a hydrothermal method. Aqueous solutions of RE(NO3)3Y(NO3)3 (0.1 mol L−1), Yb(NO3)3 (0.05 mol L−1), and Tm(NO3)3 (0.05 mol L−1) were added into a 100 mL vessel; then, 10 mmol NaF solution was slowly injected into the previous dispersion liquid and stirred for 10 min. The mixed solution was transferred into an autoclave and reacted at 180 °C for 24 h. After naturally cooling down to room temperature, the nanoparticles were washed with DI water and ethanol three times. Finally, the NaYF4:Yb3+,Tm3+ nanoparticles were dried at 60 °C for 6 h for later comparison use.
2.4 Preparation of Ag@NaYF4:Yb3+,Tm3+ NCs
The as-prepared Ag NBs with 5 mL EG were added into a 100 mL beaker. Subsequently, Y(NO3)3 (0.1 mol L−1), Yb(NO3)3 (0.05 mol L−1), Tm(NO3)3 (0.05 mol L−1), and 10 mmol NaF were slowly added into the above solution and stirred continually under the condition of 100 °C for 4 h. Finally, the NCs were dried at 60 °C for 6 h.2.5 Characterization
The crystallinity of all samples was tested in a Rigaku X-ray diffractometer (XRD). Samples were scanned in the 2θ range (10–90°) and the scanning rate was kept at 6° min−1. Transmission electron microscopy (TEM) images were collected with JEM-2000EX (Japan). Field emission scanning electron microscopy (FESEM) images were obtained by JEOL JSM-7610F. Upconversion fluorescence emission spectra were obtained by a 980 nm laser and recorded on a spectrofluorometer (HITACHI F-7000). UV-visible (UV-Vis) spectra of NCs were measured using Shimadzu UV-2450 (wavelength from 200 nm to 1000 nm). The MTT performance of the samples was tested by a BioTek Epoch ultramicro-microporous plate spectrophotometer (America). The photothermal effect was imaged by an OLYMPUS fluorescence microscope (Japan).2.6 Cytotoxicity assay
In vitro cytotoxicity was evaluated by a standard MTT assay. Human hepatocytes (7702), human hepatocellular carcinoma cells (7721) and human breast cancer cells (MCF-7) were seeded in 96-well cell-culture plates and then incubated with the NCs at 1 mg mL−1 concentration for 24 h under 5% CO2; subsequently, a 980 nm laser was utilized to irradiate the samples for 5 minutes. The standard MTT assay was used to determine cell viability.2.7 Photothermal experiments
The photothermal conversion property of NCs was first assessed by observing the temperature change at different concentrations (0, 0.1, 0.2, 0.6, 0.8, 1.0 mg mL−1) upon 808 nm (1.0 W cm−2) laser irradiation for 10 min. Subsequently, irradiation time was adjusted from 0 to 10 min. The changing temperature was recorded by a thermocouple microprobe submerged in the solution and simultaneously monitored and imaged by an infrared (IR) thermal imaging camera. The photothermal stability of the NC dispersion liquid was tested by NIR laser irradiation for four cycles.2.8 PTT effect
After incubating with the NC dispersion solution for 12 h and irradiating with/without 808 nm (1.0 W cm−2) for 5 min, live or dead MCF-7 cells were stained by calcein acetoxy-methyl ester (Calcein AM) and propidium iodide (PI), which exhibited green live cells and red dead cells utilizing Olympus (Japan).2.9 Antibacterial tests
First, 0.2, 0.5, 1 mg mL−1 NC solutions were uniformly dripped on filter papers, separately. Then, the filter papers were placed onto the surface of Luria–Bertani (LB) broth cultured with E. coli colony. After co-incubation for 3 h, bacterial death was observed. Furthermore, the bacterial death was observed by changing the radiation time of 980 nm laser from 5 to 15 min.3 Results and discussion
3.1 Phase structure and morphology
The corresponding X-ray powder diffraction (XRD) patterns of pure NaYF4:Yb3+,Tm3+ nanoparticles and Ag@NaYF4:Yb3+,Tm3+ nanocomposites (NCs) are exhibited in Fig. 1, which are recorded from 10° to 90°. All the diffraction peaks of as-prepared NaYF4:Yb3+,Tm3+ can be well indexed to the PDF card no. 77-2042 for cubic-phase NaYF4 (lattice constants a = b = c = 5.47 Å) (volume = 163.67 Å3) with slight displacement and cell volume change (volume = 165.9 Å3) due to the introduction of Yb3+ and Tm3+. There are no impurity peaks with high crystallinity, indicating the successful synthesis of pure-phase NaYF4:Yb3+,Tm3+. Furthermore, we can observe the diffraction peaks of Ag in the XRD patterns of NCs, which fit well with the PDF card no. 65-2871 of Ag (lattice constants a = b = c = 4.086 Å). Meanwhile, the diffraction peaks of NaYF4:Yb3+,Tm3+ correspond to the (111), (200), (220), (311), (222), (400), (331), and (422) crystal planes of NaYF4. Furthermore, the existence of both Ag and NaYF4:Yb3+,Tm3+ the successful construction of NCs.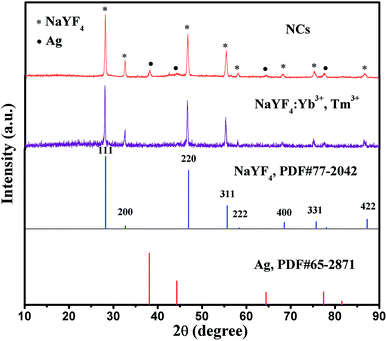 | ||
| Fig. 1 XRD patterns of the NaYF4:Yb3+,Tm3+ nanoparticles and NCs combined with the reference cards of NaYF4 (PDF# 77-2042) and Ag (PDF# 65-2871). | ||
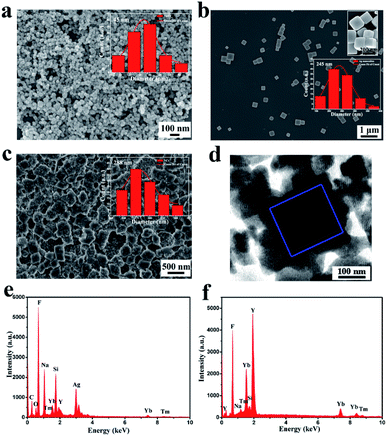
The SEM and TEM images of the as-synthesized samples are shown in Fig. 2. NaYF4:Yb3+,Tm3+ nanoparticles reveal a spherical shape with diameter of 45 ± 2.3 nm. Meanwhile, the Ag nanocubes (NBs) are well-distributed with a homogeneous diameter of 245 ± 3.7 nm. Furthermore, as shown in Fig. 2c, Ag NBs are completely encapsulated by a large number of NaYF4:Yb3+,Tm3+ nanoparticles, presenting a distinctive nanostructure with average diameter of 288 ± 4.3 nm. The surface of NCs is rough. Meanwhile, Fig. 2d exhibits that NaYF4:Yb3+,Tm3+ nanoparticles are obviously located on the surface of NCs. With the assistance of EDS, the corresponding elements C, O, Na, Y, F, Yb, Tm, Ag and Si were detected (Fig. 2e). The presence of Si was due to the use of a silicon wafer carrier, while the presence of C and O was attributed to ethylene glycol. We further confirmed the elemental composition of external nanoparticles on the surface of Ag NBs by the point scan test of EDS (Fig. 2f); Na, Y, F, Yb, and Tm could be found. Combining the analysis of XRD patterns, we inferred that NCs have been synthesized successfully.
3.2 Optical properties
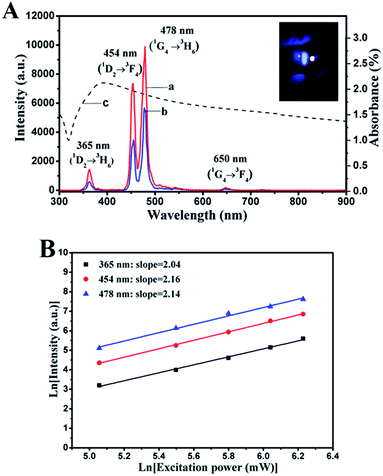
Fig. 3A shows the upconversion emission spectra of pure NaYF4:Yb3+,Tm3+ nanoparticles and NCs upon near-infrared (NIR) excitation. It can be observed clearly that NCs and NaYF4:Yb3+,Tm3+ nanoparticles exhibit discrepant emission intensities yet consistent peak positions centered around 365, 454, 478 and 650 nm, which can be ascribed to the 1D2 to 3H6 (365 nm), 1D2 to 3F4 (454 nm), 1G4 to 3H6 (478 nm) and 1G4 to 3F4 (650 nm) transitions of Tm3+ ions. Furthermore, clear blue fluorescence can be found from the inserted photograph of Fig. 3A under the irradiation of a 1 W cm−2 980 nm NIR laser. The emitted light intensity of NCs was enough to satisfy the requirements of biological applications, which could be implemented widely in the bioimaging field. However, it is worth noting that the emission intensity of NCs was lower than that of pure NaYF4:Yb3+,Tm3+. The decrease in the intensity of NCs can be explained by the ultraviolet visible (UV-Vis) spectrum (Fig. 3A(c)). The absorption spectrum of NCs presents a broad range response from 330 to 500 nm ascribed to Ag NBs with a typical LSPR absorption peak located at 414 nm, which overlaps with the blue purple emission bands of Tm3+ ions in NaYF4:Yb3+,Tm3+. This phenomenon led to significant decrease in the fluorescence emission peaks at 365, 454, and 478 nm of NCs, while the emission peak at 650 nm exhibited no significant change compared with that of pure NaYF4:Yb3+,Tm3+; this indicated the absorption of light energy and high probability of luminescence resonance energy transfer (LRET) between NaYF4:Yb3+,Tm3+ and Ag NBs.To better understand the mechanism of the NC upconversion luminescence (UCL) process, a power-dependent measurement was obtained. The upconversion emission luminescence intensity (IUCL) is proportional to the power of infrared excitation intensity (IIR) via the following formula:
| IUCL ∝ (IIR)n |
3.3 Energy transfer processes
In order to expound the energy transfer process in NCs, an energy level schematic diagram of Yb3+, Tm3+ and NCs is illustrated in Fig. 4. In Fig. 4a, we can see that the electrons on Yb3+ are excited from the 2F7/2 to the 2F5/2 level under 980 nm power excitation, which is filled as a result of radiative transition. The electrons further transfer from the 2F5/2 to the 3H5, 3F2, 1G4, 1D2, and 3P2 levels. Then, some electrons transfer to the intermediate state (3F4, 3H4) by a nonradiative transition to remain as an unsaturated population. Due to the large energy mismatch, the population of 1D2 may be achieved by two cross-relaxation processes: 3F2 + 3H4 → 3H6 + 1D2 and 1G4 + 3H4 → 3F4 + 1D2. Meanwhile, Tm3+ ions promote electron transfer to 3F2, 1G4, and 1D2 levels. Furthermore, the electrons in the 1D2 level are promoted to the 3P2 level and then, they are transferred to the 1I6 level by a nonradiative transition. Subsequently, the remaining electrons continue to be released to the 1D2 level and are transferred to the ground-state 3H6 and 3F4 levels. Meanwhile, the electrons in the 1G4 level are also excited to the 3H6 level, resulting in intense blue and purple emissions. Moreover, from Fig. 4b, we can infer that the NaYF4:Yb3+,Tm3+ nanoparticles in NCs absorb NIR light and produce blue and purple emissions, which can potentially be used in bioimaging. At the same time, part of the NIR light produced by NaYF4:Yb3+,Tm3+ can also be absorbed by Ag NBs in NCs, which can generate heat to be used in photothermal therapy for cancer cells by the photothermal conversion phenomenon.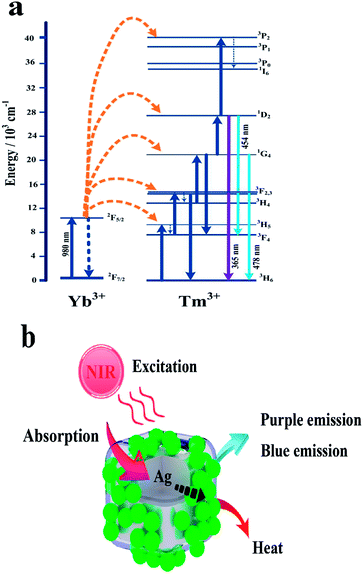 | ||
| Fig. 4 Schematic diagrams of energy level transition of Yb3+ and Tm3+ ions in the upconversion process (a) and the energy transfer in NCs (b). | ||
3.4 Photothermal properties
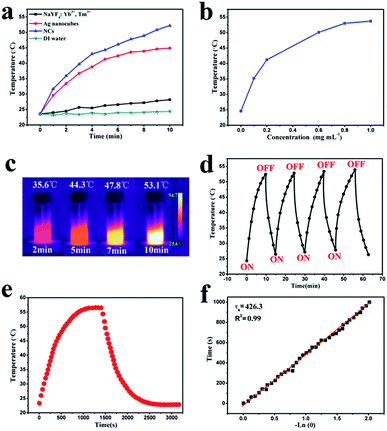
The photothermal behavior of NaYF4:Yb3+,Tm3+ nanoparticles, Ag NBs, NCs and deionized (DI) water is compared in Fig. 5a. The water solutions of different samples were irradiated with a 1 W cm−2 808 nm NIR laser. An obvious temperature increment was found for NaYF4:Yb3+,Tm3+, Ag NBs and NCs after 10 min of irradiation, indicating that the NaYF4:Yb3+,Tm3+ nanoparticles and Ag NBs contribute to the photothermal transduction of NCs. The photothermal effect of Ag NBs was ascribed to the broad absorbance located in the NIR region, which was also the reason to consider Ag NBs as a photothermal agent. Meanwhile, in the composites, the light energy produced by NaYF4:Yb3+,Tm3+ was further transmitted to Ag NBs, due to which NCs exhibited a higher temperature rise of photothermal conversion. After irradiation, the temperatures of NaYF4:Yb3+,Tm3+ nanoparticles, Ag NBs and NCs increased to 28.2 °C, 44.9 °C and 52.2 °C, respectively, confirming that the temperature increment resulted mainly from NaYF4:Yb3+,Tm3+ and Ag NBs. The NCs exhibited extraordinary photothermal conversion, which also depended on the concentration. As the concentration of NCs increased gradually from 0.1 to 1 mg mL−1, an obvious temperature change from 35.2 °C to 53.7 °C was found (Fig. 5b). The result indicated that an appropriate concentration of NCs is satisfactory for their application as a photothermal therapy (PTT) platform and an efficient cooperative antibacterial agent. Furthermore, infrared (IR) thermal ability was measured (Fig. 5c). Intensive contrast of IR imaging with the irradiation duration is increasingly distinguishable, which can achieve visual remote controllability in the process of antibacterial and photothermal therapy. Moreover, NCs were further irradiated with 808 nm laser ON/OFF for 4 repeated cycles to verify the photothermal conversion stability. Every cycle attained a close temperature around 54 °C with a similar heating rate, identifying the high photothermal stability of NCs (Fig. 5d). It is known that when the particle size of a noble metal is larger than 50 nm, an obvious light scattering phenomenon will occur and affect the efficiency of photothermal conversion.37 However, owing to the encapsulation of NaYF4:Yb3+,Tm3+, NaYF4:Yb3+,Tm3+ could reflect the scattered light and cause secondary absorption of Ag NBs to improve the efficiency in light harvesting. Furthermore, secondary absorption transfers part of the energy to Ag NBs and greatly enhances the efficiency of photothermal conversion, which is further revealed by the calculation as follows:Here, hA is the product of the container surface area and the heat transfer coefficient, I is related to NIR laser power, A808 nm is the corresponding absorbance of 808 nm, ΔT1 ≈ 31.7, and Qs is the heat-associated energy loss caused by the light absorbance of water. According to Fig. 5e and f, the photothermal conversion efficiency (η) value of NCs is determined to be 25.7%, which is higher than those of some single Ag materials. Overall, the appropriate photothermal conversion efficiency and excellent photothermal stability combined with visible contrastive results make NCs promising synergetic antibacterial and photothermal nanoagents.
3.5 Cytotoxicity assay and PTT in vitro
In order to study the toxic effect of NCs on organisms, we selected normal cells and cancerous cells from different parts of the body for MTT toxicity tests to observe cell viability. The cytotoxicity of NCs was evaluated by human hepatocytes (7702), human hepatocellular carcinoma cells (7721) and human breast cancer cells (MCF-7) for 24 h. As shown in Fig. 6, the cells with a nutrient fluid only show extremely low cell mortality, and the cells co-cultured with NCs also show high cell viability (7702: 89%, 7721: 90%, MCF-7: 87%), indicating that NCs have negligible toxicity to cells in different locations and types with good biosafety. However, when the cells co-cultured with NCs were irradiated using an NIR laser for 5 min, the viabilities of 7702, 7721 and MCF-7 decreased to 50%, 52%, and 43%, respectively. This decrease is mainly due to the photothermal conversion of NCs, and the converted heat causes the death of cancer cells.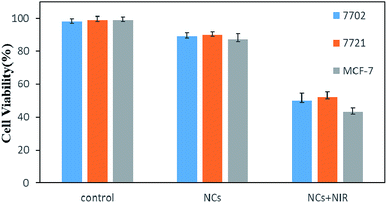 | ||
| Fig. 6 Cell viability of 7702, 7721, MCF-7 cells treated with/without NCs for 24 h and NIR irradiation for 5 min. | ||
The therapeutic efficiency of NCs was further evaluated in MCF-7 cells. We utilized the fluorescence staining method to analyze live (green) and dead (red) cells. Fig. 7 exhibits that the viability of MCF-7 cells treated with only PBS has no change. Furthermore, the cells treated with only NCs also exhibited negligible cell death. However, when MCF-7 cells co-incubated with NCs were exposed to NIR irradiation, a substantial amount of MCF-7 cells were destroyed. The result suggests that NCs can effectively destroy tumor cells via the photothermal effect. Overall, the photothermal therapeutic efficiency of NCs combined with good biocompatibility and biosafety shows good potential for PTT-induced tumor therapy.
 | ||
| Fig. 7 Confocal images of live (green) and dead (red) MCF-7 cells treated with NCs, PBS and irradiated with/without NIR laser. | ||
3.6 Antibacterial tests
The in vitro antibacterial ability of NCs against E. coli was investigated. First, NCs with different concentrations were co-incubated with E. coli for 3 h; then, bacterial viability was counted. As shown in Fig. 8a, we can see that the efficiency of sterilization increases as the concentration increases, which can be attributed to the increase in Ag concentration among NCs. Furthermore, the bacterial death was further measured by changing the radiation time of 980 nm laser. As the radiation time increased, the change in antibacterial efficiency was not obvious, indicating that the antibacterial performance is mainly caused by NCs. The results suggest the potent and broad-spectrum antibacterial activity of NCs.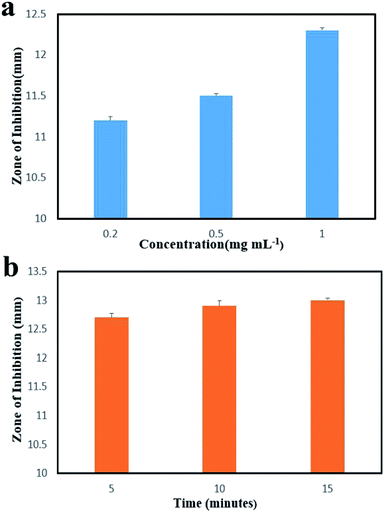 | ||
| Fig. 8 Inhibition zones of E. coli co-cultured with different concentrations of NCs (a) and irradiated by a 980 nm laser for different times (b). | ||
4 Conclusions
In summary, a uniform Ag@NaYF4:Yb3+,Tm3+ nanocomposite with excellent upconversion fluorescence and good photothermal conversion capability was successfully fabricated by a facile strategy. Cubic-phase NaYF4:Yb3+,Tm3+ upconversion luminescent nanocrystals were modified on the surface of Ag nanocubes to construct the nanocomposites, which possessed good structural stability and performance. Upon irradiation of a near-infrared laser, the nanocomposites exhibited bright luminescence and a continuous temperature rise. Moreover, the NCs had good biocompatibility and could kill tumor cells via the photothermal conversion effect. Furthermore, the inherent bactericidal ability of silver could also make the composites have a better bactericidal performance. The results indicate that NCs can be potentially applied in the biomedical field as a promising agent. Furthermore, this method provides a facile approach for synthesizing multifunctional nanocomposites with different properties.Conflicts of interest
There are no conflicts to declare.Acknowledgements
This work was financially supported by National Natural Science Foundation of China (51072026, 51573023, 50972020), Natural Science Foundation of Jilin Province of China (20170101185JC, 20170101101JC), Industrial Technology Research and Development Project of Jilin Province Development and Reform Commission (2017C052-4). Furthermore, the authors gratefully thank Dr Wei Xie (Wuhan University) for kind help in biological measurements.Notes and references
- J. T. Sui, G. X. Liu, Y. Song, D. Li, X. T. Dong, J. X. Wang and W. S. Yu, J. Colloid Interface Sci., 2018, 510, 292–301 CrossRef CAS PubMed.
- Z. Y. Chen, G. X. Liu, J. T. Sui, D. Li, Y. Song, F. Hong, X. T. Dong, J. X. Wang and W. S. Yu, Appl. Surf. Sci., 2018, 458, 931–939 CrossRef CAS.
- C. W. Chen, P. H. Lee, Y. C. Chan, M. Hsiao, C. H. Chen, P. C. Wu, P. R. Wu, D. P. Tsai, D. T. Tu, X. Y. Chen and R. S. Liu, J. Mater. Chem. B, 2015, 3, 8293–8302 RSC.
- J. T. Xu, D. Yang, R. C. Lv, B. Liu, S. L. Gai, F. He, C. X. Li and P. P. Yang, J. Mater. Chem. B, 2016, 4, 5883–5894 RSC.
- L. Yang, Q. L. Ma, X. Xi, D. Li, J. Y. Liu, X. T. Dong, W. S. Yu, J. X. Wang and G. X. Liu, Chem. Eng. J., 2019, 361, 713–724 CrossRef CAS.
- P. P. Lei, R. An, X. H. Zheng, P. Zhang, K. M. Du, M. L. Zhang, L. L. Dong, X. Gao, J. Feng and H. J. Zhang, Nanoscale, 2018, 10, 16765–16774 RSC.
- S. Zhao, R. R. Tian, B. Q. Shao, Y. Feng, S. W. Yuan, L. P. Dong, L. Zhang, K. Liu, Z. X. Wang and H. P. You, ACS Appl. Mater. Interfaces, 2019, 11, 394–402 CrossRef CAS PubMed.
- Z. G. Shen, G. C. Han, X. Y. Wang, J. W. Luo and R. C. Sun, J. Mater. Chem. B, 2017, 5, 1155–1158 RSC.
- X. M. Li, M. Y. Peng, J. K. Cao, Z. M. Yang and S. H. Xu, J. Mater. Chem. C, 2018, 6, 7814–7821 RSC.
- M. Q. Chang, Y. Sheng, Y. H. Song, K. Y. Zheng, X. Q. Zhou and H. F. Zou, RSC Adv., 2016, 6, 52113–52121 RSC.
- W. W. You, D. T. Tu, W. Zheng, X. Y. Shang, X. R. Song, S. Y. Zhou, Y. Liu, R. F. Li and X. Y. Chen, Nanoscale, 2018, 10, 11477–11484 RSC.
- Z. J. Ma, H. Zhang, Z. L. Hu, J. L. Gan, C. S. Yang, Z. C. Luo, T. Qiao, M. Y. Peng, G. P. Dong, Z. M. Yang, F. W. Wised and J. R. Qiu, J. Mater. Chem. C, 2018, 6, 1126–1135 RSC.
- W. J. Liu, G. X. Liu, X. T. Dong, J. X. Wang and W. S. Yu, Phys. Chem. Chem. Phys., 2015, 17, 22659–22667 RSC.
- H. Wu, Z. D. Hao, L. L. Zhang, X. Zhang, Y. Xiao, G. H. Pan, H. J. Wu, Y. S. Luo, L. G. Zhang and J. H. Zhang, J. Mater. Chem. C, 2018, 6, 3459–3467 RSC.
- J. Tang, L. Chen, J. Li, Z. Wang, J. H. Zhang, L. G. Zhang, Y. S. Luo and X. J. Wang, Nanoscale, 2015, 7, 14752–14759 RSC.
- G. T. Xiang, J. H. Zhang, Z. D. Hao, X. Zhang, G. H. Pan, Y. S. Luo and H. F. Zhao, CrystEngComm, 2015, 17, 3103–3109 RSC.
- P. P. Lei, R. An, X. S. Zhai, S. Yao, L. L. Dong, X. Xu, K. M. Du, M. L. Zhang, J. Feng and H. J. Zhang, J. Mater. Chem. C, 2017, 5, 9659–9665 RSC.
- Y. Feng, H. D. Chen, L. N. Ma, B. Q. Shao, S. Zhao, Z. X. Wang and H. P. You, ACS Appl. Mater. Interfaces, 2017, 9, 15096–15102 CrossRef CAS PubMed.
- D. M. Wang, B. Liu, Z. W. Quan, C. X. Li and Z. Y. Hou, J. Mater. Chem. B, 2017, 5, 2209–2230 RSC.
- D. Q. Yang, Y. G. Wang, Z. Q. Li, Y. Xu, F. Cheng, P. Li and H. R. Li, J. Mater. Chem. C, 2018, 6, 1153–1159 RSC.
- G. C. Pan, X. Bai, D. W. Yang, X. Chen, P. T. Jing, S. N. Qu, L. J. Zhang, D. L. Zhou, J. Y. Zhu, W. Xu, B. Dong and H. W. Song, Nano Lett., 2017, 17, 8005–8011 CrossRef CAS.
- X. Xu, Z. Wang, P. P. Lei, Y. N. Yu, S. Yao, S. Y. Song, X. L. Liu, Y. Su, L. L. Dong, J. Feng and H. J. Zhang, ACS Appl. Mater. Interfaces, 2015, 7, 20813–20819 CrossRef CAS.
- H. Suo, F. F. Hu, X. Q. Zhao, Z. Y. Zhang, T. Li, C. K. Duan, M. Yin and C. F. Guo, J. Mater. Chem. C, 2017, 5, 1501–1507 RSC.
- X. Chen, W. Xu, Y. D. Jiang, G. C. Pan, D. L. Zhou, J. Y. Zhu, H. Wang, C. Chen, D. Y. Li and H. W. Song, Nanoscale, 2017, 9, 16357–16364 RSC.
- Y. Y. Chen, B. Liu, X. R. Deng, S. S. Huang, Z. Y. Hou, C. X. Li and J. Lin, Nanoscale, 2015, 7, 8574–8583 RSC.
- Y. Song, G. X. Liu, X. T. Dong, J. X. Wang, W. S. Yu and J. M. Li, RSC Adv., 2014, 4, 62802–62808 RSC.
- X. W. Liu, R. R. Deng, Y. H. Zhang, Y. Wang, H. J. Chang, L. Huang and X. G. Liu, Chem. Soc. Rev., 2015, 44, 1479–1508 RSC.
- Y. Song, G. X. Liu, J. X. Wang, X. T. Dong and W. S. Yu, Phys. Chem. Chem. Phys., 2014, 16, 15139–15145 RSC.
- S. Cao, T. S. Wang, Q. Sun, Y. G. Tang, B. L. Hu, U. Levy and W. X. Yu, IEEE Photonics Technol. Lett., 2018, 30, 475–478 CAS.
- H. K. Lee, Y. H. Lee, Q. Zhang, I. Y. Phang, J. Ming, R. Tan, Y. Cui and X. Y. Ling, ACS Appl. Mater. Interfaces, 2013, 5, 11409–11418 CrossRef CAS.
- H. Y. Guan, X. H. Wang, Y. H. Guo, C. L. Shao, X. T. Zhang, Y. C. Liu and R. F. Louh, Appl. Surf. Sci., 2013, 280, 720–725 CrossRef CAS.
- G. H. Albuquerque, K. Squire, A. X. Wang and G. S. Herman, Cryst. Growth Des., 2018, 18, 119–125 CrossRef CAS.
- Z. Zhuo, Y. S. Liu, D. J. Liu, P. Huang, F. L. Jiang, X. Y. Chen and M. C. Hong, Chem. Sci., 2017, 8, 5050–5056 RSC.
- H. X. Guan, Y. Sheng, Y. H. Song, K. Y. Zheng, C. Y. Xu, X. M. Xie, Y. Z. Dai and H. F. Zou, RSC Adv., 2016, 6, 73160–73169 RSC.
- X. D. Xiao, L. L. Zhang, Z. J. Ma, X. Bao, M. Y. Peng and J. R. Qiu, J. Mater. Chem., 2011, 21, 2194–2203 RSC.
- Y. L. Liu, J. L. Zhang, G. Cheng, G. Y. Hong and J. Z. Ni, Nanotechnology, 2012, 23, 425702–425710 CrossRef.
- H. T. Wang, X. L. Zheng, J. L. Chen, D. C. Wang, Q. Y. Wang, T. Y. Xue, C. Liu, Z. Jin, X. Q. Cui and W. T. Zheng, J. Phys. Chem. C, 2012, 116, 24268–24273 CrossRef CAS.
| This journal is © The Royal Society of Chemistry 2019 |



![[thin space (1/6-em)]](https://www.rsc.org/images/entities/char_2009.gif)