DOI:
10.1039/C9RA03603B
(Paper)
RSC Adv., 2019,
9, 20760-20777
Retracted Article: Impact of some pyrrolidinium ionic liquids on copper dissolution behavior in acidic environment: experimental, morphological and theoretical insights
Received
14th May 2019
, Accepted 27th June 2019
First published on 3rd July 2019
Abstract
The inhibitive and adsorption activity of some pyrrolidinium ionic liquids (ILs) for the dissolution of copper in 1 M HNO3 solution was tested using chemical methods such as weight loss and electrochemical techniques; potentiodynamic polarization, electrochemical impedance spectroscopy (EIS) and electrical frequency modulation (EFM) techniques. The results indicated that the ionic liquids under investigation exhibited promising corrosion inhibitory performance in 1 M HNO3 and their efficiencies reached up to 85% at 0.05 mM. Also, an enhancement in the inhibition efficiency (% IE) accompanied the increase in inhibitor concentration. The polarization measurements suggested that these ionic liquid inhibitors act as mixed-type inhibitors. The adsorption of the ionic liquid inhibitors on the copper surface obey the Langmuir adsorption isotherm. Thermodynamic parameters were calculated and discussed. The surface morphology of the copper surface was examined using different techniques. Correlation between the calculated % IE from experiments and some quantum chemical parameters was established.
1. Introduction
Copper is widely used in various industrial applications owing to its higher electrical and thermal conductivity, mechanical workability and excellent corrosion resistance. Copper alloys are main constituents in technological device applications, such as in electronics as a conductor, and in electrical power conduits, transportation pipelines used for local and industrial water services such as sea water, heat exchangers, heat conductors, etc.1–4 As a result, the dissolution of copper and its inhibition in various environments have received increasing interest in academic research and industry.5–8 Previous reports in the literature have been devoted to conquering the challenges of copper corrosion that is common in aqueous solution environments.9,10 One effective method to mitigate the degradation of copper in acid solution is the use of corrosion inhibitors, such as organic, inorganic, organic anionic and organic cationic inhibitors, which simply protect the metal surface from attack by corrosive species in the media. The safe handling and cost effectiveness, which are the important points that deserve full consideration when testing new corrosion inhibitors.11,12 Amongst organic heterocyclic compounds, benzotriazole (BTA) is recognized as an active inhibitor of copper dissolution in neutral/basic media.13 It is usually approved that its inhibition mechanism in neutral and basic media is the adsorption of a single BTA molecule on the copper surface and the creation of a polymeric film of a (Cu+BTA) complex.14 But, in acidic media, BTA occurs largely as a protonated species, BTAH+. These protonated species are strongly chemisorbed on the copper surface, as the metal is positively charged in acidic media.15 This is in turn drives to a reduction in the inhibition efficiency of BTA in acidic media. Over the last decade, extensive ongoing research have been devoted to the use of ILs as corrosion inhibitors because they fulfill the criteria in many practical industrial applications.16–18 In general, ILs are organic salts in its liquid state with low melting point below 100 °C, consisting of organic cations as ammonium, imidazolium, pyridinium, piperidinium, sulfonium, phosphonium or pyrrolidinium and inorganic anions such as fluoride, chloride, bromide or cyanide.19 Their intrinsic physicochemical features, like good solvent transport, excellent electrical conductivity, and electrochemical activity make them potential candidates in physisorption and chemisorption studies.20 Some ILs have surface activity, like surfactants and able to form micelles and reducing wetting interfacial tension of aggressive solutions that support surface wetting and adsorption.21 Similar to the action of surfactant, the maximum efficiency is attained near the critical micelle concentration (CMC) wherever the colloidal aggregates are created. The micelle composition is varied in the existence of ILs mainly in pyrrolidinium-based ILs. These properties have motivated researchers to evaluate new synthesized ILs in a wide variety of applications, particularly such as corrosion inhibitors in aqueous environments.
Zhou et al., evaluated the inhibition activity of 1-butyl-3-methylimidazolium tetrafluoroborate ([BMIM][BF4]) ionic liquid for carbon steel dissolution in basic chloride solution via electrochemical measurements, the results showed that the compound effectively inhibited cathodic and anodic processes together and played as a mixed type inhibitor.22 Zheng et al., represented the inhibition achievement of 1-octyl-3-methylimidazolium bromide and 1-ally-3-octylimidazolium bromide on mild steel surface inundated in environment involving sulfate ions and found that the inhibitors confirmed good inhibitive capability (above 85%) but proceeded as cathodic inhibitors slightly.23 Also, in HCl solution, ILs are shown to be effective. For example, Zhang et al., are shown that at 303 K, alkyl imidazolium ionic liquids: 1 butyl-3-methylimidazolium chlorides, 1-hexyl-3-methylimidazolium chlorides and 1-octyl-3-methylimidazolium chlorides prohibited aluminum dissolution in a hydrochloric acid environment by 82.4, 90.4, and 94.0%, respectively.24 This activity may be attributed to the adsorption ability of the used ILs, which mainly due to the adsorption of ILs species on the metal surface, the compounds with large molecular size and accordingly, the molecular mass. So far, ILs are used as corrosion inhibitors, however, there is scarce of researches have been carried out on the inhibition of copper dissolution in acid solutions using ionic liquid systems.
Thus, the overall objective of the present work is to estimate the corrosion inhibition activity of 1-butyl-1-methylpyrrolidinium tetrafluoroborate and 1-ethyl-1-methylpyrrolidinium bis(trifluoromethylsulfonyl)imide ILs for copper dissolution in 1 M HNO3 solution via chemical, electrochemical experiments for corrosion monitoring. The surface morphology of copper specimens was analyzed by scanning electron microscopy (SEM), energy dispersive X-rays (EDX), and atomic force microscopy (AFM). We have demonstrated the validity of our findings by corroborating the experimental results with computed quantum chemical parameters and adsorption energies from molecular dynamics simulations. Furthermore, this research is aimed to elucidate the adsorption of ionic liquid inhibitors on the copper surface and understanding the role of ionic liquid constituents in the corrosion inhibition process.
2. Experimental methods
2.1 Materials, inhibitors and solutions
The elemental chemical composition of Cu specimens used in our investigation was as follows in weight %: 0.0297 Fe, 0.0103 Ni, 0.0053 Si, 0.023 Pb and rest are Cu (Merck Chemicals Co.). The investigated ILs were purchased from Sigma Aldrich Co., and used without further purification, they are labeled as IL1 and IL2. The molecular structure, molecular weight and physical properties are given in Table 1. The corrosive solution used was prepared by dilution of analytical grade, 70% HNO3 (El-Gomhouria Chemicals Co.) by bi-distilled water, and the acid concentration was standardized using NaOH (El-Gomhouria Chemicals Co.) before carrying out the experiments. The tested inhibition dose of ILs ranged from 0.01 to 0.05 mM in 1 M HNO3.
Table 1 Chemical structure of the investigated ionic liquids
| Inhibitors code |
Structure |
CAS number |
Empirical formula |
Molecular weight (g mole−1) |
Purity |
Impurities |
| IL1 |
 |
345984-11-4 |
C9H20BF4N |
229.07 |
≥97.0% (T) |
≤0.2% halogens (as chloride) ≤0.5% water |
| IL2 |
 |
223436-99-5 |
C9H16F6N2O4S2 |
394.35 |
≥98.5% (T) |
≤0.5% water |
2.2 Weight loss method (WL)
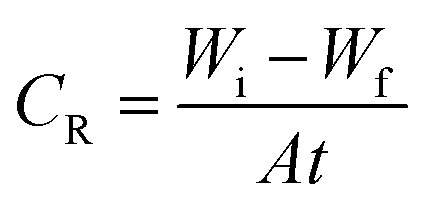
The weight loss method (WL) was applied to the copper specimens with geometrical size (2 × 2 × 0.1 cm3). The copper coupons were firstly prepared by scratching against emery papers of different grit size from coarser to finest, then the samples were degreased and rinsed with distilled water and desiccated before measuring their initial weight (Wi), after that the copper samples were immersed in 100 ml of corrosive solution at controlled temperature for 3 hours immersion period, where the coupons were taken out from solution every 30 minute and washed out with distilled water, dried and the weight after immersion was measured (Wf). The corrosion rate (CR), the surface coverage degree (θ) and the (% IE) of the investigated ILs were calculated from the following equations:| |
 | (1) |
| | |
% IE = θ × 100 = [(Wa − Wb)/Wa] × 100
| (2) |
where, Wi and Wf denote to the initial and final weight of the copper samples in the tested solution, respectively. A, is the entire surface area of copper specimens (cm2) and t, is the immersion time in (min). Wa and Wb are the WL per unit area of copper specimens in the absence and presence of inhibitors, correspondingly.
2.3 Electrochemical measurements
Electrochemical experiments used the copper specimen with the same composition were mounted in glass rod with an exposed surface area of 1.0 cm2. An epoxy resin was used to fill the gap between a copper electrode and the opening glass rod. The electrochemical measurements [potentiodynamic polarization (PP), electrochemical impedance spectroscopy (EIS) and electrochemical frequency modulation (EFM)] techniques were done at 298 K in a classic three glass cell electrode system involving the copper specimen as working electrode, platinum wire as counter electrode (HANNA Instruments Co.), and a saturated calomel electrode (SCE) as reference electrode (HANNA Instruments Co.). Prior to each experiment, the specimens were polished with a sequence of emery papers of various sizes up to 1200, washed out a few times with distilled water and dried before use. The copper electrode was allowed to immerse in an open circuit condition for about 15 min to reach the steady state conditions before starting the measurements (the equipment of electrochemical measurements are calibrated using a dummy cell and measurements are repeated 3 times for reproducibility).
Potentiodynamic polarization (PP) was obtained via sweeping the electrode potential automatically from (−0.900 to +0.900) mV. (SCE) vs. open circuit potential (OCP) at a scan rate of 1.0 mV s−1.25
Electrochemical impedance spectroscopy (EIS) was applied in a frequency range from 100 kHz to 0.5 Hz with an amplitude of 5.0 mV peak-to-peak via AC signals at particular corrosion potential.26
Electrochemical frequency modulation (EFM) was applied via two frequencies 2 and 5 Hz. The base frequency was 1.0 Hz with 32 cycles, so the waveform repeats after 1 s. A disturbance signal with amplitude of 10 mV was applied for together disturbance frequencies of 2 and 5 Hz. The option for the frequencies of 2 and 5 Hz was founded on three principles.27
Electrochemical measurements were achieved with a Gamry instrument potentiostat/Galvanostat/ZRA, this incorporates a Gamry framework system based on the ESA 400, Gamry applications that impeded DC105 for DC corrosion tests, EIS300 for EIS measurements and EFM140 to compute the corrosion current and Tafel constants for EFM measurements. Echem Analyst software was used for graphing, analyzing, and fitting data. A computer was employed for gaining the expected data.
2.4 Surface analyses (SEM, EDX and AFM)
Scanning electron microscopy (SEM) provides an insightful depiction of the copper surface morphology and the inhibitive protective layer on the surface. The surface morphology of the copper specimens was analyzed via (JEOL JSM-5500, Japan) model. The uninhibited and inhibited copper specimens' compositional analysis was investigated via electron dispersive X-ray spectroscopy (EDX). Also, the conditions of copper specimens in the acid environments without and with the optimum concentration of ILs was applied via atomic force microscopy (AFM) using Pico SPM 2100 with the software version of Pico scan version 5.4.
2.5 Ionic liquid solution test (tensiometry measurements)
Tensiometry measurements were applied via Kruss (Force Tensiometer – K100) under atmospheric pressure via the ring method. The platinum ring was fully washed and flame-dried prior to each test. This tensiometry measurement is repeated 3 times for reproducibility and the average value was determined as represented in our investigation.
2.6 Computational chemical approaches
2.6.1 Quantum chemical calculations. By using quantum chemical calculations, the correlation between the properties of studying ILs and their electronic properties was studied. In general, the electronic properties and the chemical reactivity of compounds can be anticipated from the molecular structure. Such theoretical calculation tools provide a depth understanding of the chemical reactivity compounds which approximated quantitatively from the interpretation of some quantum chemical descriptors for example, the energies of Frontiers molecular orbital's, for short, FMOs (HOMO and LUMO). In our investigation, the first step in the calculation is performed geometrical optimization on the molecular structure of the tested ILs. These computations were made with the aid of Standard Gaussian 09 software package (revision A02) applying the density functional theory (DFT) method with hybrid functional which is Becke three parameter-hybrid-B3 with the L–Y–P (Lee–Yang–Parr) correction, functional (B3LYP) and 6-31G(d,p) basis set in absence of symmetry limitations.28 The reason to select this computational set up in our investigations is that this method is established in literature to give good approximate for the activity of corrosion inhibitors. Also, B3LYP is suitable and yield reliable intermolecular distances and binding energies. In addition, since the corrosion inhibition occurs in wet (aqueous) environments, the effect of solvent (water) representing the corrosion inhibition environment was considered in one perspective of the computational calculations by performing the calculation with polarized continuum model (PCM). No imaginary frequency appeared, indicating the proper optimization of structures. Frontiers molecular orbital's EHOMO and ELUMO represent the energy of the highest occupied molecular orbital and the energy of the lowest unoccupied molecular orbital, respectively from which the gap energy ΔE = ELUMO − EHOMO is calculated. Other quantum chemical parameters were calculated such as softness (σ), hardness (η), and electronegativity (X) which are global chemical descriptors reflecting the chemical reactivity and molecular stability. Higher reactivity of chemical compounds is associated with increasing softness (σ) values and decreasing the hardness values (η). Moreover, the more electronegative (X) of the compound, the better the interaction with other reacting species.
2.6.2 Monte Carlo simulations. The adsorption of testing ILs on the copper surface was investigated by Monte Carlo search code modulated in Materials Studio version 07. The simulations were carried out with periodic boundary conditions to mimic part of the corrosion inhibitor system of ILs on Cu surface.29 The constructing simulation system involves in the first place a preparation procedure to import pure Cu crystal and cleaved its surface along the plane (111), which is the lowest energy plane, then building appropriate supercell of appropriate size (10 × 10) to accommodate the inhibitors, and with a vacuum thickness 30 Å. Their mesh dimensions were as follows a = b = 24.5 Å and c = 42.7 Å. Furthermore, the surface of the Cu (111) was first relaxed to the lowest energy state before initiating the simulations. Moreover, the optimized structures of the ILs by force-field calculation method were introduced in the simulations.30 The molecular dynamic simulation was performed using Monte Carlo search code by applying universal force field with a time step of 1 fs and a simulation time of 500 ps done at 298 K, set NVT.
3. Results and discussion
3.1 Weight loss method
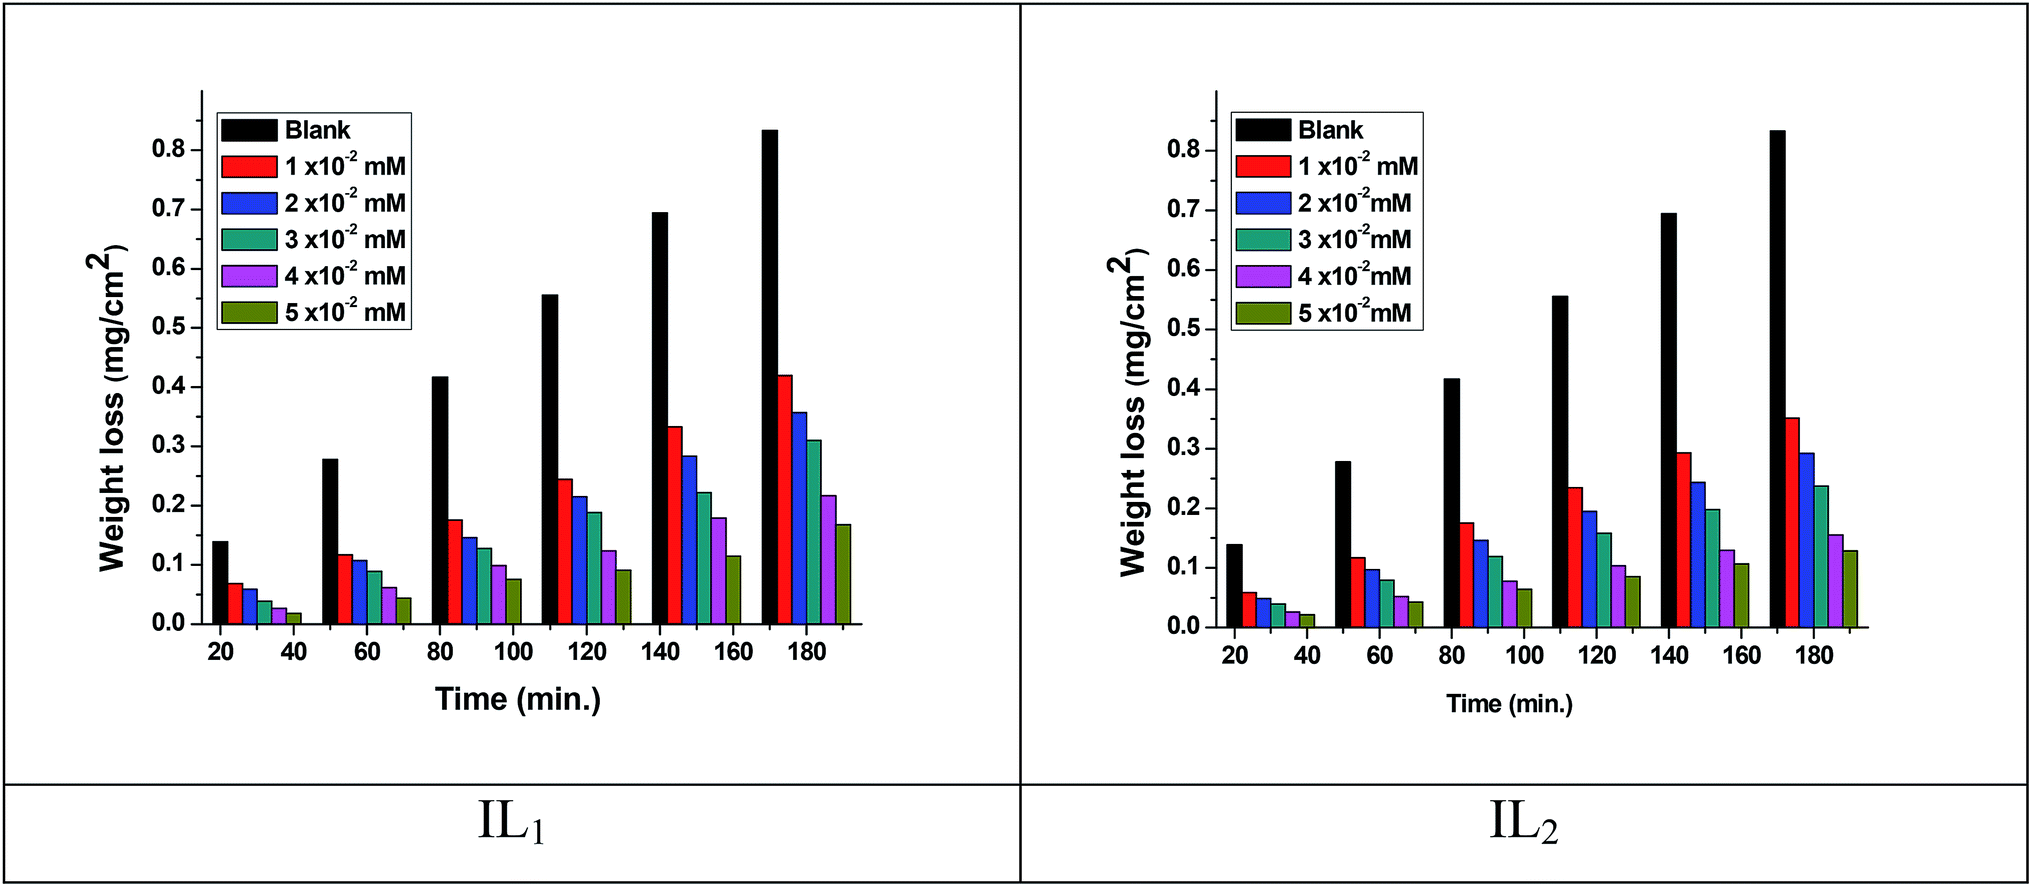
The weight loss of the copper specimens in 1 M HNO3, with and without various concentrations of the tested ILs, was calculated after 3 hours of immersion at 298 K, as represented in Fig. 1. The weight loss corrosion data, including % IE are listed in Table 2. The existence of the ILs lowering the corrosion rate of copper specimen in 1 M HNO3. The inhibition efficiency (% IE) was noticed to increase with increasing the dose of ILs in the tested solutions.31,32 The corrosion inhibition is due to the adsorption of the applied ILs at the copper/nitric acid solution boundary.33 This adsorption is caused by the electrostatic interaction between ILs & the copper specimen surface. The inhibition efficiency raised with rising the concentration up to achieve an optimal concentration (0.05 mM). Since, the ionic liquid concentrations were increased, the corrosion rate remained constant approximately owing to the saturation of the IL adsorbed layer and increasing the concentration may participate only in the creation of hydrogen bonding of the pyrrolidinium ring with their counter ions as well as with water molecules in the medium.34,35 Similar results were achieved in previous works.36,37 Moreover, the % IE of these ILs within the same concentration follows the order IL2 > IL1, this performance may be referred to the adsorption capability of the ILs studied, which mainly attributing to the increasing in adsorption density at the metal surface with rising of the molecular size of ILs. Hence, the variation in the anionic parts of IL1 and IL2 is responsible for the different size changes and different performance of the ILs in the inhibition efficiency. The results listed in Table 3 agree with the critical concentration values for these ILs gained via the tensiometery method as represented in Fig. 2.
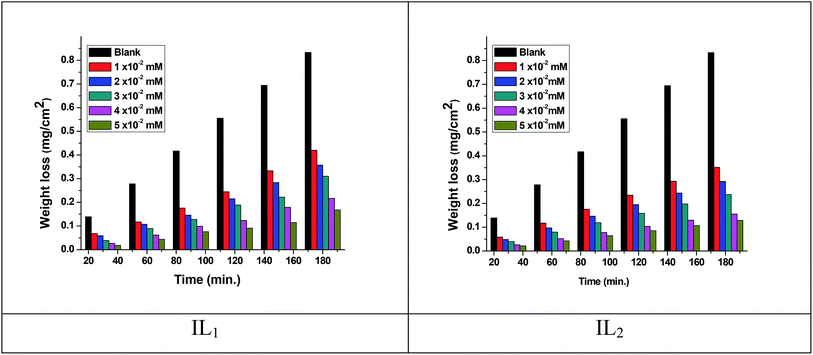 |
| | Fig. 1 Weight loss-time plots for copper dissolution in 1 M HNO3 in the absence and presence of ILs at 298 K. | |
Table 2 Corrosion rate (CR), θ and % IE data obtained from WL measurements for copper dissolution in 1 M HNO3 in the absence and presence of ILs at 298 K
| Inhibitors |
Conc., mM × 10−2 |
Weight loss, mg cm−1 |
CR, mmy−1 |
% IE |
θ |
| 1 M HNO3 |
Blank |
8.333 |
4.6 |
— |
— |
| IL1 |
1 |
4.195 |
2.3 |
49.7 |
0.497 |
| 2 |
3.571 |
2.0 |
57.2 |
0.572 |
| 3 |
3.099 |
1.7 |
62.8 |
0.628 |
| 4 |
2.169 |
1.2 |
74.0 |
0.740 |
| 5 |
1.680 |
0.9 |
79.8 |
0.798 |
| IL2 |
1 |
3.515 |
2.0 |
57.8 |
0.578 |
| 2 |
2.922 |
1.6 |
64.9 |
0.649 |
| 3 |
2.376 |
1.3 |
71.5 |
0.715 |
| 4 |
1.550 |
0.9 |
81.4 |
0.814 |
| 5 |
1.285 |
0.7 |
84.6 |
0.846 |
Table 3 Surface tension data for the investigated ionic liquids
| Inhibitors |
Conc., mM × 10−2 |
Surface tension, mN m−1 |
Standard deviation |
Standard uncertainties |
| IL1 |
1 |
60 |
0.2494 |
0.30 |
| 2 |
52 |
0.2450 |
0.30 |
| 3 |
44 |
0.4497 |
0.55 |
| 4 |
36 |
0.0816 |
0.10 |
| 5 |
30 |
0.2494 |
0.30 |
| IL2 |
1 |
55 |
0.2494 |
0.30 |
| 2 |
48 |
0.3742 |
0.45 |
| 3 |
38 |
0.3559 |
0.40 |
| 4 |
35 |
0.3399 |
0.40 |
| 5 |
30 |
0.4109 |
0.50 |
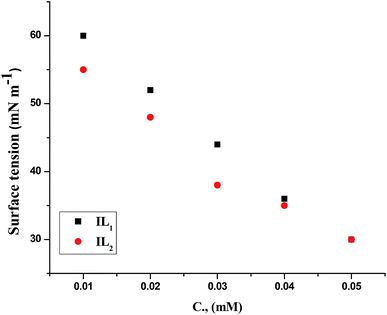 |
| | Fig. 2 Surface tension vs. ILs total concentration in 1 M HNO3 solution at 298 K. | |
3.2 Potentiodynamic polarization (PP)
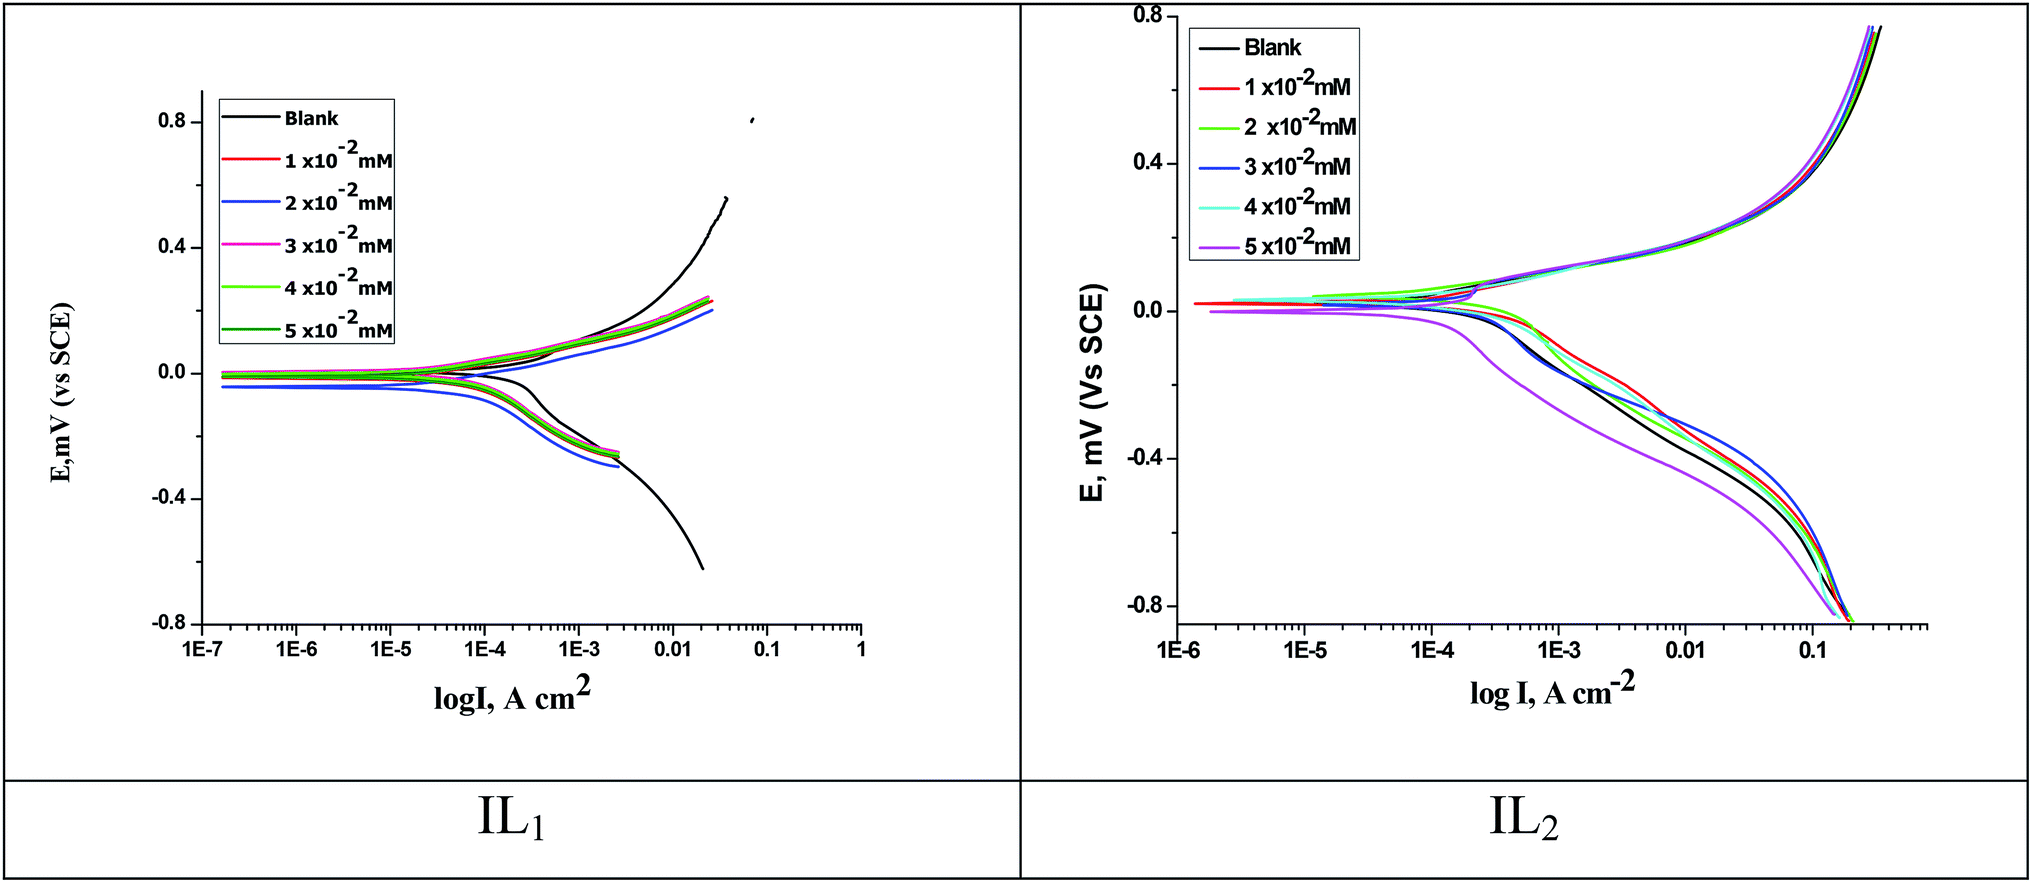
The anodic and cathodic polarization curves of copper in 1 M HNO3 with and without various concentrations of the applied compounds (IL1 & IL2) are illustrated together in Fig. 3. It's known that the polarization behavior of copper in acidic environments follows approximately identical pattern. A variety of corrosion kinetic parameters, for example, corrosion potential (Ecorr), corrosion current (icorr), Tafel slopes (βa and βc), surface coverage degree (θ) and inhibition efficiency (% IE) obtained from the polarization plots are given in Table 4. From the PP results, we can say that these (ILs) function as mixed-type inhibitors, due to the potential change in the cathodic path is equivalent to that in the anodic path. The reduction in (icorr) with rising the dose of ILs used to illustrate the efficiency of the examined compounds as corrosion inhibitors. The free corrosion potential in 1 M HNO3 solution is 6.2 mV vs. SCE in favorable agreement with published data.38,39 The (Ecorr) data are indicating that the inhibition takes place by blocking the surface of the copper electrode.
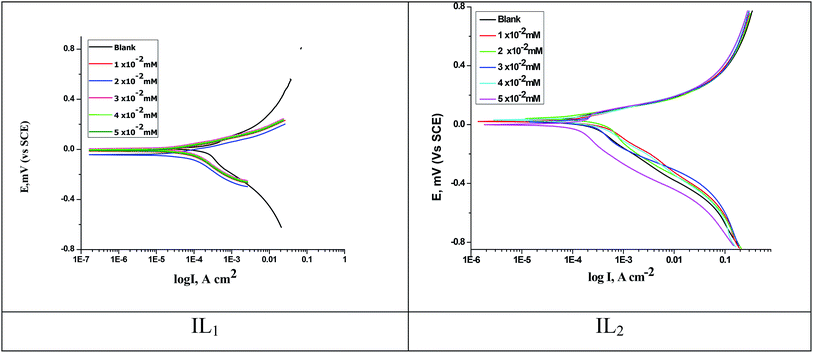 |
| | Fig. 3 PP curves for copper dissolution in 1 M HNO3 with and without various concentrations of ILs at 298 K. | |
Table 4 The impact of the various ILs concentration on the free corrosion potential (Ecorr), corrosion current density (icorr), Tafel slopes (βa and βc), inhibition efficiency (% IE) and surface coverage degree (θ) of copper dissolution in 1 M HNO3 at 298 K
| Inhibitors |
Conc., mM × 10−2 |
Ecorr, mV |
icorr, μA cm−2 |
βa, mV dec−1 |
βc, mV dec−1 |
CR, mpy |
% IE |
θ |
| 1 M HNO3 |
Blank |
6.2 |
198 |
215 |
141 |
90.0 |
— |
— |
| IL1 |
1 |
28.4 |
116 |
288 |
151 |
52.7 |
41.4 |
0.414 |
| 2 |
24.4 |
81.7 |
248 |
158 |
37.1 |
58.7 |
0.587 |
| 3 |
15.6 |
48.9 |
233 |
228 |
22.2 |
75.3 |
0.753 |
| 4 |
22.8 |
45.2 |
208 |
171 |
20.5 |
77.2 |
0.772 |
| 5 |
36.3 |
41.5 |
232 |
192 |
18.9 |
79.0 |
0.790 |
| IL2 |
1 |
22.4 |
78.2 |
322 |
133 |
35.5 |
60.5 |
0.605 |
| 2 |
19.6 |
69.8 |
381 |
195 |
31.7 |
64.7 |
0.647 |
| 3 |
21.4 |
56.4 |
289 |
121 |
25.6 |
71.5 |
0.715 |
| 4 |
27.6 |
41.7 |
252 |
111 |
18.9 |
78.9 |
0.789 |
| 5 |
32.8 |
26.2 |
155 |
98 |
11.9 |
86.8 |
0.868 |
Table 4 represents the change in the inhibition efficiency (% IE) of ILs at different concentrations calculated from the polarization plots at 298 K. The order of the inhibition efficiency of these compounds is: IL2 > IL1 and is in excellent agreement with that gained from weight loss method.
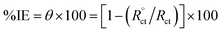
3.3 Electrochemical impedance spectroscopy (EIS)
Fig. 4 illustrates Nyquist & Bode diagrams for the Cu electrode at competent corrosion potentials after 30 min inundation in 1 M HNO3 with and without various concentrations of the applicable inhibitors at 298 K. As the ILs concentrations increase, the semi-circle width increases. Generally, the variation from ideal semicircle was referred to the frequency spreading as well as the surface heterogeneity.9,40,41 EIS test of the investigated ILs was evaluated via the equivalent circuit, Fig. 5, which shows a single charge transfer reaction and approximated well with our experimental data. The constant phase element, CPE, is inserted in the circuit instead of a pure double layer capacitor to provide a more perfect fit. The double layer capacitance, Cdl, for a circuit involving a CPE parameter (Y0 and n) are computed from eqn (3):| | |
Cdl = Y0ωn−1/sin[n(π/2)]
| (3) |
where, Y0, is the extent of the CPE, ω = 2πfmax, fmax is the frequency at which the imaginary impedance module is maximal and the factor, n, is a flexible parameter that always lies between 0.5 and 1.0. The semi-circle width characterizes the charge transfer resistance, Rct, corresponding to the polarization resistance, Rp, and inversely proportional to the icorr value. The rising in Rct reflects the increase in the double layer thickness that adsorbed via ILs.42,43 As well, the data of the double-layer capacitance (Cdl) reduce by inserting ionic liquid inhibitors into the applicable corrosive medium. Furthermore, double layer capacitance is computed from the following eqn (4):where, ε, is the double-layer dielectric constant, εo the vacuum electrical permittivity, δ the double-layer thickness, and A is the surface area. Generally, the reduction in Cdl data is assigned to the substitution of the adsorbed water molecules at the copper surface by the ILs inhibitor molecules which having lower dielectric constant.44 Moreover, the reduction in the surface area which proceeds as sites for charging may be believed as a different reason for the decrease in Cdl. These points recommend that the role of inhibitory molecules is advanced by its adsorption at the metal–solution interface. The impedance corrosion parameters are reported in Table 5. The % IE was computed from the charge transfer resistance data from the eqn (5).| |
 | (5) |
where, Rct and  are the charge-transfer resistance values with and without inhibitors, respectively.
 |
| | Fig. 4 (a) Nyquist and (b) Bode diagrams for copper dissolution in 1 M HNO3 containing different concentrations of ILs at 298 K. | |
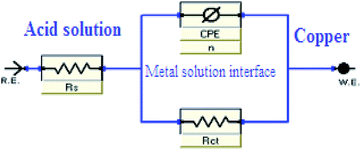 |
| | Fig. 5 Parallel circuit diagram applied for modeling the metal/solution. | |
Table 5 EIS parameters for Cu dissolution in 1 M HNO3 with and without various concentrations of ionic liquid inhibitors at 298 K
| Inhibitors |
Conc., mM × 10−2 |
Rct, Ω cm2 |
Cdl, μF cm−2 |
% IE |
θ |
| IL1 |
Blank |
108 |
350 |
— |
— |
| 1 |
225 |
261 |
52.0 |
0.520 |
| 2 |
271 |
228 |
60.1 |
0.601 |
| 3 |
335 |
215 |
67.8 |
0.678 |
| 4 |
387 |
208 |
72.1 |
0.721 |
| 5 |
448 |
199 |
76.0 |
0.760 |
| IL2 |
Blank |
108 |
350 |
— |
— |
| 1 |
291 |
107 |
62.9 |
0.629 |
| 2 |
341 |
199 |
68.3 |
0.683 |
| 3 |
456 |
175 |
76.3 |
0.763 |
| 4 |
578 |
138 |
81.3 |
0.813 |
| 5 |
735 |
62 |
85.3 |
0.853 |
The obtained results show that the value of Rct raises with the rising of the inhibitor concentration, which leads to an improve in % IE and double layer capacitance (Cdl) data reduce in the existence of the inhibitors. The lower Cdl value results from a decrease in local dielectric constant and/or an increase in the double layer thickness. Thus, it is reasonable to presume that inhibitor compound function by adsorption at the metal–acid interface. It is clear that there is a perfect agreement between the two dissimilar electrochemical techniques owing to the same trend of inhibition of ILs inhibitors.
3.4 Electrochemical frequency modulation (EFM)
Recently, Bosch et al. suggested electrochemical frequency modulation (EFM) as a novel electrochemical method for corrosion monitoring.27 EFM is a non-destructive and a quick corrosion rate measurement method that directly provide the corrosion current data without previous knowledge of Tafel constants.
It is known that the corrosion process is non-linear in nature, a potential distortion by one or more sine waves will produce responses at higher frequencies than the input frequencies of the applied signal. Practically, no notice is provided to the inter-modulation or electrochemical frequency modulation. However, EFM illustrated that this non-linear response includes enough information about the corroding system so that the corrosion current can be calculated directly. The great strength of the EFM is the causality factors which act as an internal test of the EFM measurement validity, with the causality factors the experimental EFM results can be confirmed.45,46
Fig. 6 shows the current response involving not only the input frequencies, but also the other frequencies which are the sum, difference, and multiples of the two input frequencies. Inter-modulation spectra driven from EFM measurements of copper with and without various concentrations of the tested ILs in 1 M HNO3. The EFM inter-modulation spectra were constructed of copper in nitric acid medium with and without various concentrations of the investigated inhibitors at 298 K are also studied.
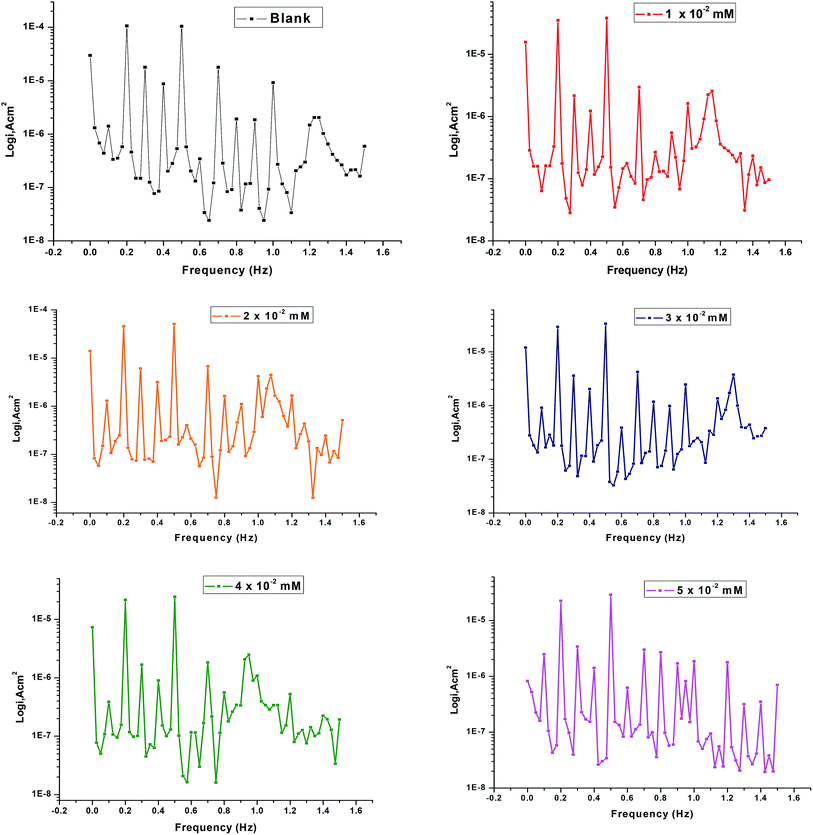 |
| | Fig. 6 EFM diagrams for copper dissolution in 1 M HNO3 with and without different concentrations of IL2 at 298 K. | |
The higher peaks are applied to calculate the corrosion current density (icorr), the Tafel slopes (βa and βc) and the causality factors (CF-2 and CF-3). These electrochemical corrosion parameters at various concentrations of the investigated inhibitors for copper dissolution in 1 M HNO3 at 298 K are determined at once and reported in Table 6.
Table 6 EFM parameters for copper dissolution in 1 M HNO3 with and without different concentrations of ILs at 298 K
| Inhibitors |
Conc., mM × 10−2, ppm |
icorr, μA cm−2 |
βa, mV dec−1 |
βc, mV dec−1 |
CF-2 |
CF-3 |
CR, mpy |
% IE |
θ |
| IL1 |
Blank |
255.0 |
85 |
281 |
1.88 |
3.32 |
115.9 |
— |
— |
| 1 |
113.7 |
146 |
203 |
1.92 |
2.88 |
51.7 |
55.4 |
0.554 |
| 2 |
85.2 |
151 |
212 |
1.85 |
2.85 |
38.7 |
66.6 |
0.666 |
| 3 |
78.6 |
149 |
200 |
1.91 |
2.95 |
35.7 |
69.2 |
0.692 |
| 4 |
66.9 |
150 |
190 |
1.88 |
2.98 |
30.4 |
73.8 |
0.738 |
| 5 |
55.5 |
152 |
191 |
1.95 |
2.82 |
25.2 |
78.2 |
0.782 |
| IL2 |
1 |
81.4 |
98 |
55 |
2.15 |
3.11 |
37.0 |
68.1 |
0.681 |
| 2 |
72.7 |
122 |
51 |
1.92 |
3.01 |
33.1 |
71.5 |
0.715 |
| 3 |
61.2 |
111 |
49 |
1.98 |
2.81 |
27.8 |
76.0 |
0.760 |
| 4 |
49.5 |
88 |
45 |
2.11 |
2.97 |
22.5 |
80.6 |
0.806 |
| 5 |
36.3 |
94 |
39 |
1.88 |
2.89 |
16.5 |
85.8 |
0.858 |
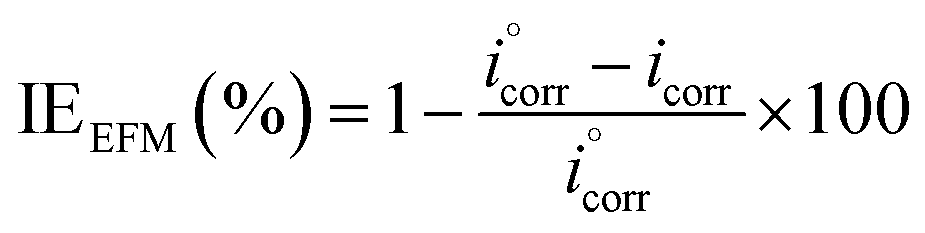
IEEFM the inhibition efficiency (%), calculated from the eqn (6), increases by the abundance of the investigated inhibitors in test solution.
| |
 | (6) |
where,
icorr and

are corrosion current densities with and without inhibitors, correspondingly. The causality factors CF-2 and CF-3 summarized in
Table 6 are very close to their theoretical values of 2.0 and 3.0, respectively. This suggests that the calculated EFM parameters are valid and of excellent quality. Hence, the results from (EFM) method demonstrated that all the investigated inhibitors have good inhibiting power for copper corrosion in nitric acid. Derived from these data, the electrochemical frequency modulation test appears able to examine the corrosion inhibition of copper in nitric acid by various concentrations of ILs compounds.
3.5 Adsorption isotherm
It is generally accepted that the inhibitors mitigate the metal corrosion by adsorbing on the copper surface and this process involves replacing the water molecules on the metal surface by ionic liquid inhibitor molecules.20 Therefore, the positive information on the copper corrosion inhibition via ILs can be obtained by applying different adsorption isotherms. Finally, experimental data from WL, PP, EIS and EFM measurements for the corrosion inhibition of copper in 1 M HNO3 medium by ILs are fitted to different adsorption isotherms such as Langmuir, Temkin, Frumkin, Freundlich and El-Awady thermodynamic adsorption isotherms. It was found that the Langmuir adsorption isotherm gives the best fit obtained. Langmuir adsorption isotherm is identified by the subsequent equation:47| |
 | (7) |
where, θ is the surface coverage degree, C is the concentration, Kads is the equilibrium constant of adsorption–desorption process. The plot of C/θ as a function of C for the inhibition of copper dissolution in 1 M HNO3 is illustrated in Fig. 7 and the adsorption parameters produced from the diagrams are reported in Table 7. The strong correlations (0.9968) and the linearity of the diagrams are verified the power of this approach. In Table 5, Kads values are indicated that the adsorption strength or desorption between adsorbate and adsorbent. It is also detected from Table 7 that the slopes deviated from the unity value as predicted from an ideal Langmuir adsorption equation. This variable may be assigned to interaction between adsorbed ILs species on the copper surface. It has been supposed from the indication of the Langmuir isotherm equation that adsorbed species don't cooperate with one another; this hypothesis isn't true for organic molecules at low concentration which can be absorbed at the anodic and cathodic sites together on a metal surface. From PP plots shown in Fig. 3, it can be seen that ILs suppress largely the anodic processes due to the adsorption of ILs molecules on the cathodic site which is the reason for the observed variation from unit gradient.
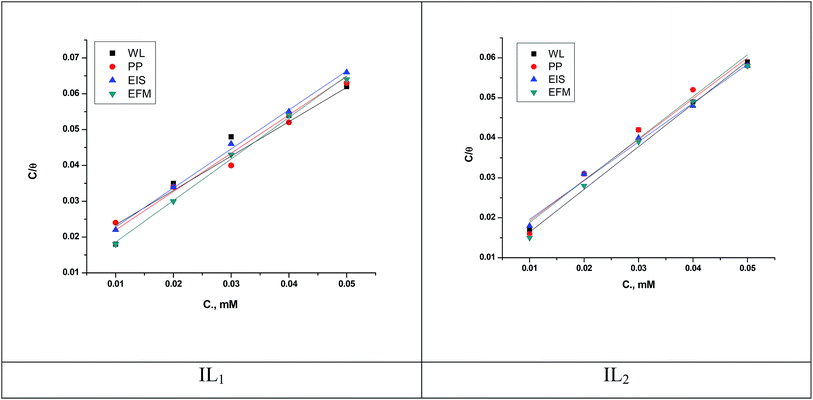 |
| | Fig. 7 Langmuir adsorption isotherm for copper dissolution in 1 M HNO3 involving different concentrations of ILs at 298 K. | |
Table 7 Langmuir adsorption parameters for the copper dissolution in 1 M HNO3 involving different concentrations of ILs at 298 K
| Inhibitors |
Experimental methods |

(kJ mol−1) |
K (M−1) |
Slope |
R2 |
| IL1 |
WL |
−9.68 |
0.909 |
1.07 |
0.9439 |
| PP |
−9.09 |
0.914 |
0.96 |
0.9863 |
| EIS |
−9.47 |
0.983 |
1.09 |
0.9965 |
| EFM |
−10.79 |
1.42 |
1.16 |
0.9968 |
| IL2 |
WL |
−10.18 |
1.11 |
1.02 |
0.9813 |
| PP |
−10.47 |
1.25 |
1.05 |
0.9689 |
| EIS |
−9.92 |
1.0 |
0.97 |
0.9900 |
| EFM |
−11.19 |
1.67 |
1.07 |
0.9932 |
The values of the free energy of adsorption also reported in Table 7 which are computed via the subsequent equation:48
| |
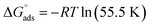 | (8) |
where,
R is the molar gas constant,
T is the absolute temperature, and the constant value of 55.55 is the water molar concentration. As reported in
Table 7, the

values are negative, and this indicates the spontaneity of the adsorption process and stability of the adsorbed ILs films on the copper surface.
3.6 Surface analysis
3.6.1 SEM and EDX. SEM and EDX tests are used to confirm the presence of the ILs on the copper surface or just peeled off the copper surface. SEM micrographs are signal of the changes that join with the corrosion and the protection of the copper surface together as shown in (Fig. 8A–D). Fig. 8A illustrates the free metal. Fig. 8B illustrates the loss caused to the surface by nitric acid. Fig. 8C illustrates SEM micrographs of the copper surface after treating with 1 M HNO3 involving 0.05 mM of ionic liquids. From these micrographs, it's clear that the copper surface appears to be unaffected by corrosion nearly. This is due to adsorption of ILs creating a thin protecting film of the ILs on the copper surface. This film is greatly responsible for the effective inhibition by these inhibitors. The matching EDX analyses are reported in Table 8 and Fig. 9A–D for ILs with and without 0.05 mM ionic liquids. In addition, it's essential to deduce the presence of C, O and Cu peaks in the EDX graphs of the copper surface matching to the sample inundated for 12 h. In solutions involving the favorable concentration of the ionic liquids, the creation of a thin protective film of ILs is matching with the SEM micrographs.49
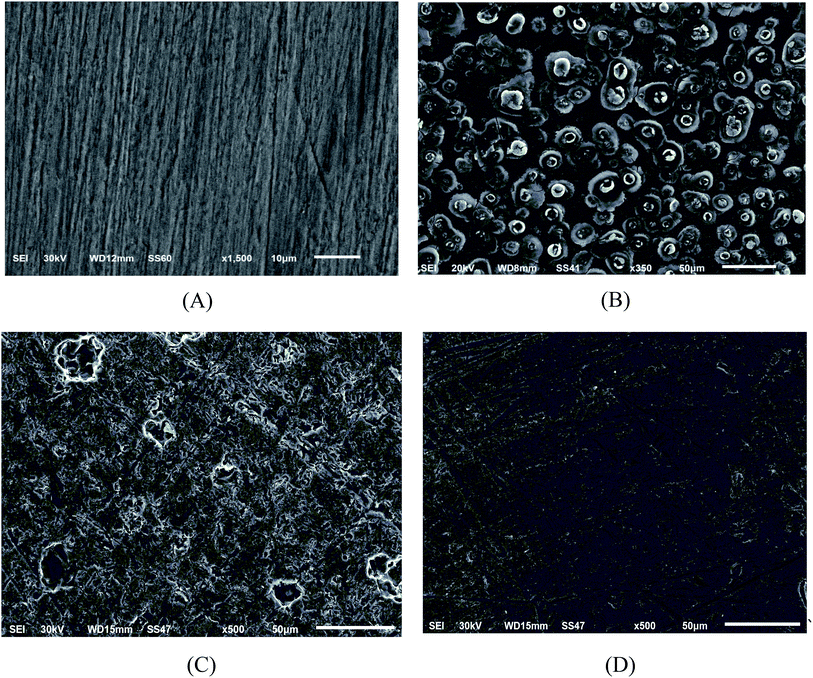 |
| | Fig. 8 SEM micrographs for (A) copper free in polished state (B) exposed to 1 M HNO3 solution, (C) exposed to 1 M HNO3 solution with 0.05 mM IL1 and (D) exposed to 1 M HNO3 solution with 0.05 mM IL2 at 298 K. | |
Table 8 Surface composition (mass%) of copper after 12 h of inundation in 1 M HNO3 + 0.05 mM ILs (IL1 & IL2)
| Mass% |
C |
O |
Cu |
| Pure |
— |
— |
100 |
| Blank |
13.1 |
4.5 |
82.4 |
| IL1 |
21.5 |
6.7 |
71.8 |
| IL2 |
32.9 |
4.3 |
62.8 |
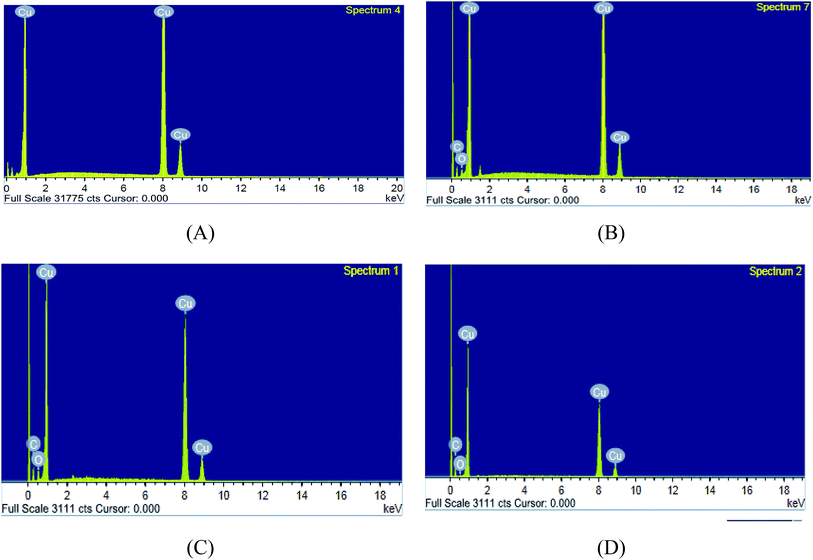 |
| | Fig. 9 EDX micrographs for (A) copper free in polished state (B) exposed to 1 M HNO3 solution, (C) exposed to 1 M HNO3 solution with 0.05 mM IL1 and (D) exposed to 1 M HNO3 solution with 0.05 mM IL2 at 298 K. | |
3.6.2 Atomic force microscopy (AFM). Further morphological evaluation of the copper surface was applied via AFM in the presence and absence of the ILs with concentrations (0.05 mM) after inundation 12 h. The AFM micrographs were shown in Fig. 10A–D. The average roughness parameter is listed in Table 9. It is evidently observed from the micrographs that the copper sample show a coarse surface caused by acid corrosion. But, the copper specimens get smoothened in the presence of 0.05 mM ILs (IL1 & IL2) solutions in 1 M HNO3 which inhibited corrosion on the surface, as shown in Fig. 10C–D. The possibly the creation of adsorbed thin protective film of inhibitors on the copper surface was the reason behind the reduction in the copper specimens' roughness as reported in Table 9.
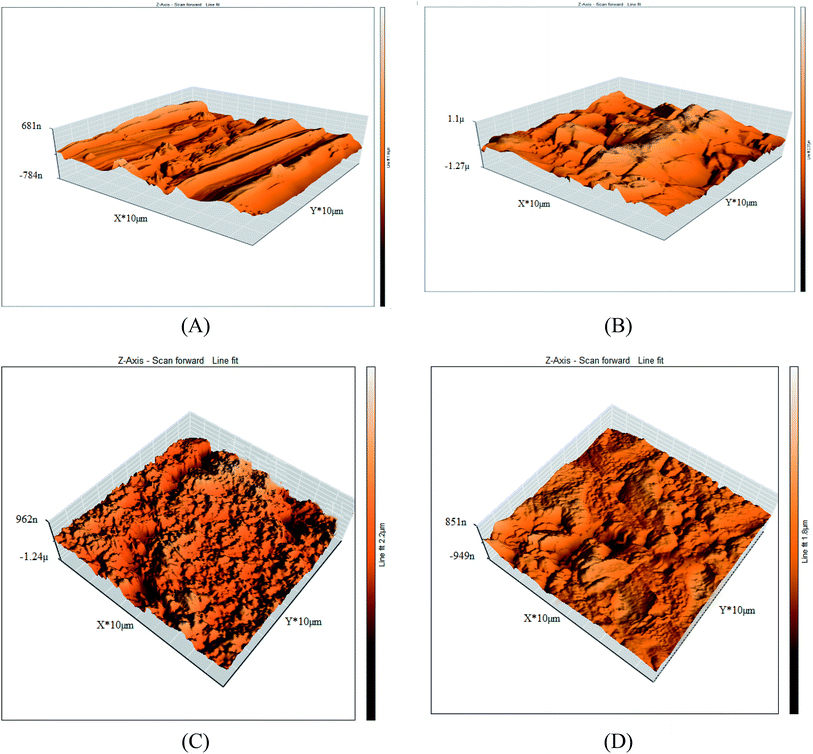 |
| | Fig. 10 3D AFM images for (A) copper free in polished state (B) exposed to 1 M HNO3 solution, (C) exposed to 1 M HNO3 solution containing 0.05 mM IL1 and (D) exposed to 1 M HNO3 solution containing 0.05 mM IL2 after 12 h at 298 K. | |
Table 9 The surface roughness average (Sa) of copper after 12 h of immersion in 1 M HNO3 containing 0.05 mM ILs at 298 K
| Status |
Sa (nm) |
| Pure metal |
76.5 |
| Pure metal + 1.0 M HNO3 |
180.2 |
| Pure metal + 1.0 M HNO3 + IL1 (0.05 mM) |
118.4 |
| Pure metal + 1.0 M HNO3 + IL2 (0.05 mM) |
82.8 |
3.7 Quantum chemical calculations
3.7.1 DFT computations. The active sites in the tested ILs are the key enabling regions on the compounds that adsorb on metal substrate. This type of chemical reaction can be identified by interpretation of the parameters from quantum chemical calculations. Such method provides a plethora of information on the reactivity of chemical species and an atomic-level insight on the effect of molecular structure. In our investigation, we carried out the calculations at the (DFT) level to obtain the relevant quantum chemical parameters.50 Some quantum chemical data from DFT calculations is given in Table 10. The optimized geometric structures and density distribution of electrons of EHOMO and ELUMO are presented in Fig. 11.
Table 10 Different quantum chemistry descriptors of the investigated ILs; global hardness (η), global softness σ (S), electronegativity (X), dipole moment (μ)
| Quantum parameters |
Total energy (Ha) |
EHOMO, eV |
ELUMO, eV |
ΔE, eV |
η |
σ (S) |
X |
μ, Debye |
| IL1/water |
−834.245796 |
−8.762 |
−1.342 |
7.420 |
3.710 |
0.270 |
5.052 |
18.15 |
| IL2/water |
−2158.29015 |
−7.659 |
0.832 |
8.491 |
4.245 |
0.236 |
3.414 |
24.59 |
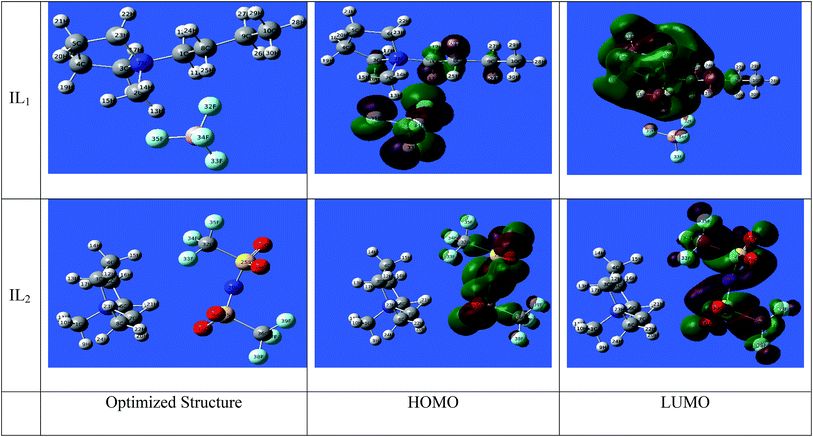 |
| | Fig. 11 Optimized molecular structures with electronic densities of HOMO and LUMO of ILs study. | |
For IL1, the electron density of (HOMO) is localized mainly over the anion part with a partial spread on the neighboring carbon atoms of the cationic part. On the other side, the LUMO can be seen spread over the cationic part of IL1 with greatest localization on the aromatic rings, especially N atoms. For IL2, it is obvious that the electron densities of HOMO and LUMO occur in the anionic part of the compound.51–54 This indicates the big role that the anionic part contributes in the corrosion inhibition process. Looking at Table 10, it can infer that the trend in inhibition of compounds relates to the decreasing in the ELUMO, also lower total energy of IL2 reflects the higher stability of compounds on metal surface. This decreasing trend in ELUMO is accompanying with increasing the electron affinity of compounds, meaning that the capacity of compounds to accept free electrons from corroding metal surface increases. Another observation is that IL2 possess larger magnitude of the dipole moment, this could correlate to higher dipole–dipole interaction of ILs ionic species which indicates higher adsorption and strengthen the effect of blocking the active sites on corroding metal surface. The gap energy ΔE is important to explore the static molecular reactivity. It is noted that the active centers of the ILs compounds are mainly distributed around the polar atoms, meaning that those polar atoms donate electrons to Fe atoms with empty d-orbitals.
The ionization potential of the compound (−EHOMO) shows higher tendency of the studied ILs to donate electrons.55 It is generally established that the lower ionization potential [higher the value of (EHOMO) values are indicative of higher capacity of compounds to donate electrons to an appropriate electron acceptor such as chemical species having unoccupied molecular orbitals at low energy level, which is in our case the Cu surface atoms]. It also can be noticed that the total energy of compound IL2 is lower than IL1, meaning that the IL2 is more stable than IL1. Likewise, the dipole moment of IL2 is greater than IL1, indicating the higher polarizability of IL2 compound that facilitate the adsorption of compound on metal surface.
The distribution of the Mulliken atomic charges on the atoms of the ILs is shown in Fig. 12. We have observed that the oxygen atoms with other carbon atoms is the structure of ILs studied possesses negative charges, these atoms are the active sites and responsible for nucleophilic attack with the Cu surface through electron/charge transfer from negatively charges sites to the vacant-d orbital of Cu surface atoms. The region with positive charges are mainly appearing on the anionic part of ILs, these regions are also active centers of electrophilic attack that occurs between the Cu surface and inhibitors through the formation of back-bond when the electrons from the Cu surface are freely transferred to the anti-bonding orbitals of these positively charged atoms.
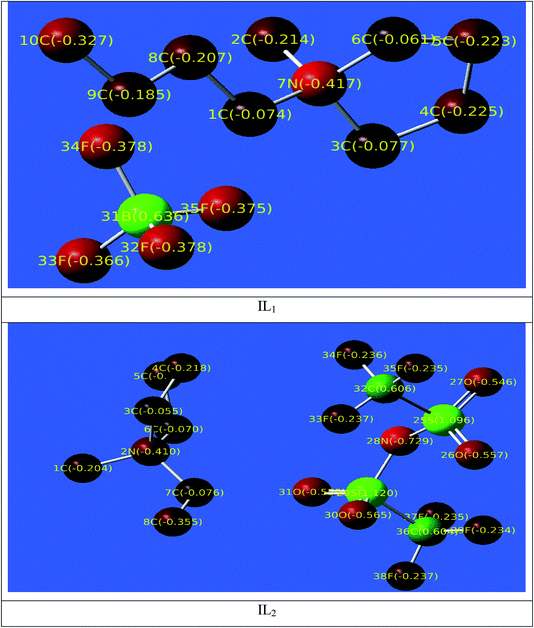 |
| | Fig. 12 Mulliken population analysis with atomic charge ranges from −ve charged with red color and +ve charged with green color in the tested ILs. | |
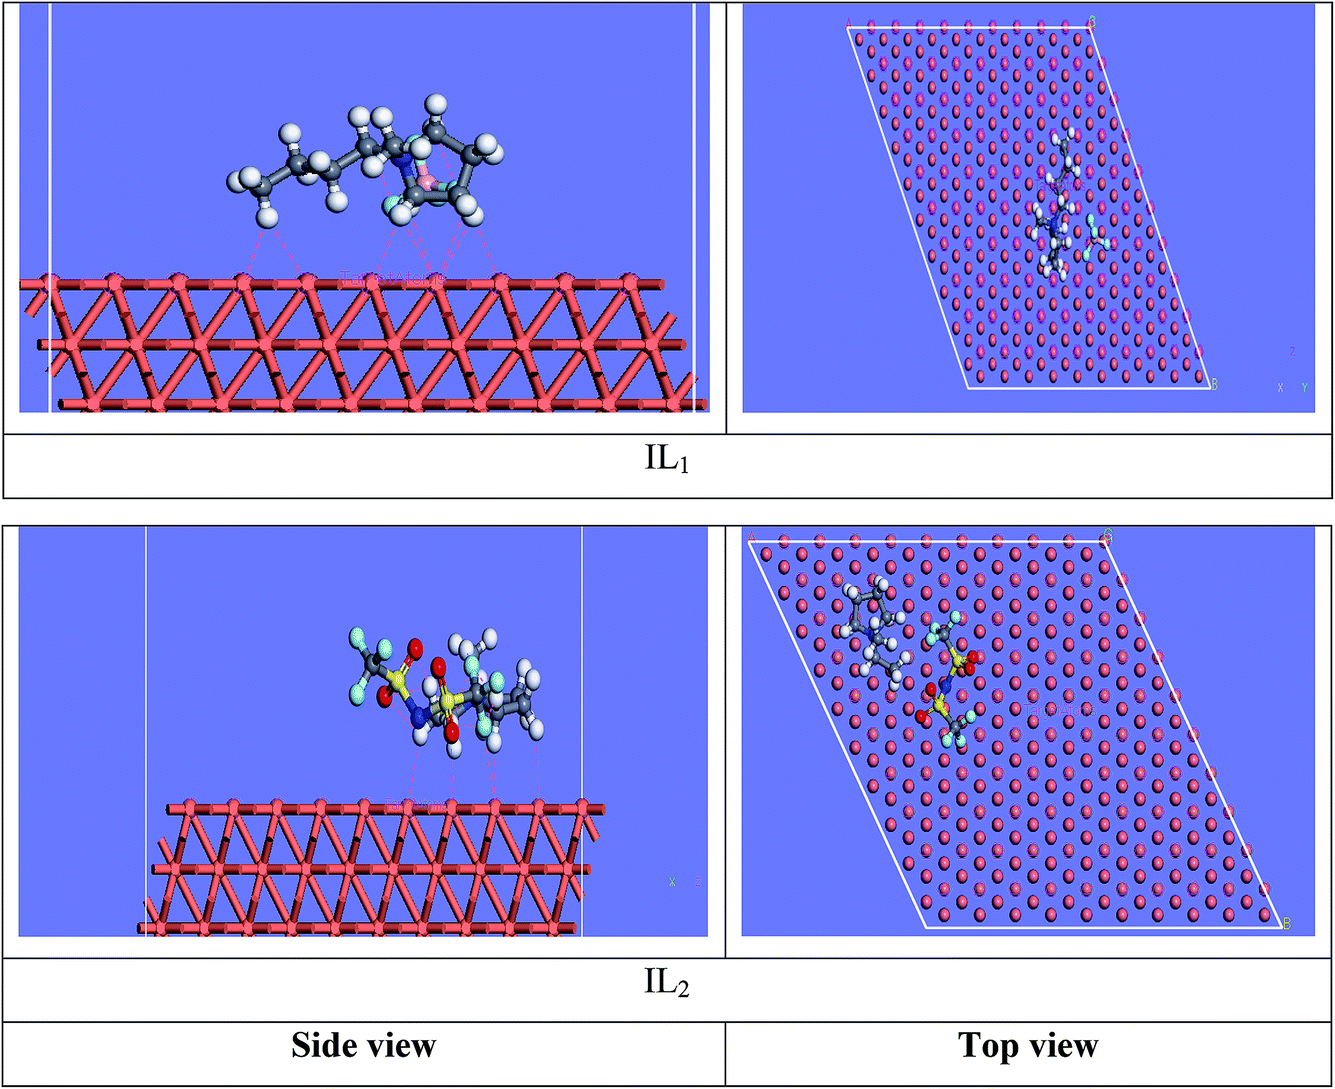
3.7.2 Molecular dynamics simulations. The equilibrium configurations of the ILs on the iron surface has been searched using a molecular dynamic simulation method which provides deep understanding of the interactions of the inhibitors with Cu surface. Molecular dynamics simulation can reasonably predict the more favorable configuration of the metal inhibitor interface.56,57 As a result, the side and top views of the adsorption orientation of the two ILs inhibitors on Cu (111) surface in vacuum and aqueous solution are displayed in Fig. 13 and 14. As obviously shown from the figures the two inhibitors have a planar orientation of Cu (111) surface, this position offers strong adsorption, where the formation of coordination bond is more likely through the sharing of π-electrons in the aromatic ring with copper, and the transfer of electrons from d-orbital of Cu to anti-bonding orbital's in the tested ILs.
 |
| | Fig. 13 Side and top side snapshots of the most stable orientation of ILs simulated as whole part in vacuum condition. | |
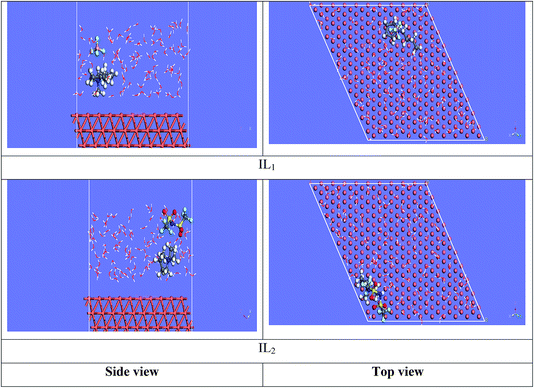 |
| | Fig. 14 Side and top view snapshots of the most stable orientation of ILs simulated as whole part in water condition. | |
Overall, from Table 11 the adsorption energy is higher in aqueous solution than in a vacuum, indicating the facilitating role of solvent in the adsorption process of compounds on Cu surface. Furthermore, the high adsorption energy in aqueous solutions (−21.622 kcal mol−1) was recorded for IL2 compound, indicating the spontaneous and strong adsorption of this compound on Cu surface. Also, the adsorption energy of IL2 is higher than IL1 in all simulations, which means that IL2 exhibited better corrosion inhibition performance compared to IL1 as shown in Fig. 15.
Table 11 Adsorption energies of the tested ILs on Cu (111), simulated as whole and separated constituents in vacuum and water
| System |
Adsorption energy, kcal mol−1 |
| IL1/vacuum |
−2.742 |
| IL1+/vacuum |
−16.652 |
| IL1−/vacuum |
−0.722 |
| IL2/vacuum |
−3.245 |
| IL2+/vacuum |
−16.00 |
| IL2−/vacuum |
−1.811 |
| IL1/aqueous |
−17.526 |
| IL1+/aqueous |
−29.832 |
| IL1−/aqueous |
−5.911 |
| IL2/aqueous |
−21.622 |
| IL2+/aqueous |
−26.613 |
| IL2−/aqueous |
−11.655 |
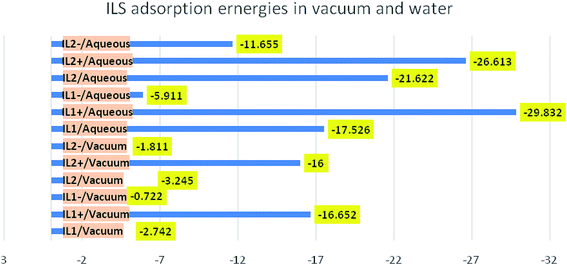 |
| | Fig. 15 Comparison of the adsorption energies in kcal mol−1 for the different ILs in vacuum and water simulations. | |
The molecular dynamic simulations were carried out on the optimized ILs structure, and as separate ionic parts (cationic and anionic) species that comprise the studied ILs. All the adsorption energies give negative values, this means that the adsorption is a spontaneous and favorable process on Cu surface. Intriguingly, the cationic part has higher adsorption energy than its associated anionic part, this reflects the key obvious contribution of the cationic part in the inhibition process. It can also be seen that the cationic part of the investigated ILs moved closer to the Cu surface when water is present in the simulation and the adsorption energy observed with higher negative values. This led us to conclude that the cationic part of the ionic liquid has a significant effect on corrosion inhibition potential, meaning that the corrosion inhibition is greatly affected by the cationic part. In conducting the simulation for the intimate ionic liquid where the cationic and anionic part are not separated, it was found that IL2 gives higher adsorption energy, in either vacuum or water, compared to IL1, this is in good agreement with the results from experimental studies. While, this observation was not the case when performing the simulation of ILs as separated constituents, as we noticed that the effect of cationic part outweighs the anionic part. This finding is of interest as it corroborates the conclusion from quantum chemical studies and maximizes the effect of anion species of ILs on the corrosion inhibition. This means the physicochemical properties of ILs are due to the intrinsic electronic properties of associated ionic species composing the ILs where the effect of any part should not be overlooked. It is generally recognized that the adsorption of ILs molecules and its size & shape of the metal surface are controlled by the hydrophobic tail length and the charged head group interactions.38 As indicated in previous studies that the higher chain length of ILs with the same head group results in higher % IE. The chain length compatibility changes film properties such as aggregate lifetime, surface tension and etc.39,40 In our systems, we studied two ILs containing different anionic parts varying in hydrocarbon chain lengths, the impact of anionic part compatibility was found intriguing since the inhibition efficiency of ILs for copper is also estimated by the impact of the anionic parts along with the electrostatic interaction of the head groups. The variation in the corrosion rate of copper in the existence of IL1 and IL2 at the same inhibition dose is confirmed by the top explanation.
3.8 Mechanism of corrosion
In HNO3 solution, copper surface is positively charged and the anodic corrosion reactions in the absence of inhibitors follow the below equation steps:| | |
Cu + NO3− → (CuNO3−)ads
| (9) |
| | |
(CuNO3−)ads → (CuNO3)ads + e−
| (10) |
| | |
(CuNO3)ads → CuNO3+ + e−
| (11) |
| | |
CuNO3+ → Cu2+ + NO3−
| (12) |
The adsorption of nitrate polyatomic ion (NO3−) as in eqn (9) recharges the metal surface, making it negatively charged again. While, in acidic solutions, the ILs exists in their protonated ([Inh]+) forms and this protonated species are easily adsorbed on corroding copper surface via coulombic attraction according to eqn (13):
| | |
(CuNO3−)ads + [Inh]+ → (CuNO3−[Inh]+)ads
| (13) |
Simultaneously, the cathodic corrosion reactions involve the following steps:
| | |
(CuH+)ads + e− → (CuH)ads
| (15) |
| | |
(CuH)ads + H+ + e− → Cu + H2
| (16) |
In our study, the corrosion inhibition action of pyrrolidinium-based ILs on copper surface in HNO3 solutions affects the discharging of H+ through competitive adsorption on the cathodic positions which results in H2 evolution, so the H2 evolution process occurs according to the subsequent steps in eqn (17) and (18):
| | |
Cu + [Inh]+ → Cu[Inh]+ads
| (17) |
| | |
Cu[Inh]+ads + e− → Cu[Inh]ads
| (18) |
In general, organic compounds adsorb on the copper metal surface is associated with the substitution of water via the inhibitor molecules in the aqueous solution (Orgsol) replacing the water molecules (H2Oads) at the copper/solution interface:9
| | |
Orgsol + xH2O → Orgads + H2Osol
| (19) |
where,
x is the number of H
2O molecules substituted. Thus, it is assumed that the metal surface charge is governed by the corrosion potential of surface (
Ecorr) described by the potential of zero charge which affect the adsorption potential of compounds on copper surface (PZC)
Eq = 0, hence affecting the overall inhibition process.
48 In general, when the difference between
Ecorr and
Eq = 0 is negative, the metal surface acquires a net negative charge which in turn supports the adsorption of positively charged species. On the other hand, the adsorption of negatively charged species is favorable when
Ecorr −
Eq = 0 is positive. The protonated [ILs]
+ species are directly adsorbed onto the copper metal surface as a result will be unfavorable that ILs molecules are adsorbed onto the copper surface in 1.0 M HNO
3 medium according to
eqn (9). But, it appears that the adsorbed NO
3− ions didn't perfectly shielded the repulsive impact of the +ve charged copper surface on [ILs]
+ as obvious from the inhibiting activity hypothesis of the ILs inhibitors.
4. Conclusions
The % IE depends on the dose of the ILs compounds studied. The PP measurement results confirmed that both ILs following the same postulated corrosion inhibition mechanism and act mainly as mixed type inhibitors. The adsorption of the ionic liquid inhibitors on the copper surface obey Langmuir adsorption isotherm. The adsorption of the investigated ionic liquids on the copper surface is spontaneous. The reduction of Cdl data when raising the dose of inhibitors is due to the adsorption of ILs molecules in the metal-corrosive solution surface. The % IE of the investigated ionic liquids correlate well with some quantum chemical descriptors. Monte Carlo simulations provide the most stable adsorption pattern for both compounds was on the copper surface resulting in increasing the surface coverage and showed the effect of anionic constituent on the overall corrosion inhibition action of ILs.
Conflicts of interest
There are no conflicts to declare.
References
- M. T. Alhaffar, S. A. Umoren, I. B. Obot and S. A. Ali, RSC Adv., 2018, 8, 1764 RSC.
- M. A. Deyab, R. Essehli and B. El Bali, RSC Adv., 2015, 5, 64326–64334 RSC.
- H. Alhumade, A. Abdala, A. Yu, A. Elkamel and L. Simon, Can. J. Chem. Eng., 2016, 94, 896–904 CrossRef CAS.
- H. Gerengi, M. Mielniczek, G. Gece and M. M. Solomon, Ind. Eng. Chem. Res., 2016, 55, 9614–9624 CrossRef CAS.
- M. Shabani-Nooshabadi, F. S. Hoseiny and Y. Jafari, Metall. Mater. Trans. A, 2015, 46, 293–299 CrossRef CAS.
- A. S. Fouda and H. A. A. Wahed, Arabian J. Chem., 2016, 9, S91–S99 CrossRef CAS.
- T. Gan, Y. Zhang, M. Yang, H. Hu, Z. Huang, Z. Feng, D. Chen, C. Chen and J. Liang, Ind. Eng. Chem. Res., 2018, 57(32), 10786–10797 CrossRef CAS.
- N. Kovačević, I. Milošev and A. Kokalj, Corros. Sci., 2017, 124, 25–34 CrossRef.
- W.-J. Lee, Mater. Sci. Eng., A, 2003, 348, 217–226 CrossRef.
- Y. Qiang, S. Zhang, S. Xu and W. Li, J. Colloid Interface Sci., 2016, 472, 52–59 CrossRef CAS PubMed.
- C. Verma, L. O. Olasunkanmi, E. E. Ebenso and M. A. Quraishi, J. Mol. Liq., 2018, 251, 100–118 CrossRef CAS.
- A. Pandey, B. Singh, C. Verma and E. E. Ebenso, RSC Adv., 2017, 7, 47148 RSC.
- T. Notoya and G. W. Poling, Corrosion, 1976, 32, 216–223 CrossRef.
- F. El-Taib Heakal and S. Haruyama, Corros. Sci., 1980, 20, 887–898 CrossRef CAS.
- Y. C. Wu, P. Zhang, H. W. Pickering and D. L. Allara, J. Electrochem. Soc., 1993, 140, 2791–2800 CrossRef CAS.
- C. Verma, I. B. Obot, I. Bahadur, E.-S. M. Sherif and E. E. Ebenso, Appl. Surf. Sci., 2018, 457, 134 CrossRef CAS.
- A. Yousefi, S. Javadian, N. Dalir, J. Kakemam and J. Akbari, RSC Adv., 2015, 5, 11697–11713 RSC.
- S. Ben Aoun, RSC Adv., 2017, 7, 36688 RSC.
- D. R. MacFarlane, A. L. Chong, M. Forsyth, M. Kar, R. Vijayaraghavan, S. Anthony and J. M. Pringle, Faraday Discuss., 2018, 206, 9–28 RSC.
- J. Leys, M. Wübbenhorst, C. P. Menon, R. Rajesh, J. Thoen and C. Glorieux, J. Chem. Phys., 2008, 128, 064509 CrossRef PubMed.
- A. S. Hanamertani, R. M. Pilus and S. Irawan, ICIPEG, 2016, 2017, pp. 133–147 Search PubMed.
- X. Zhou, H. Yang and F. Wang, Electrochim. Acta, 2011, 56, 4268–4275 CrossRef CAS.
- X. Zheng, S. Zhang, W. Li, M. Gong and L. Yin, Corros. Sci., 2015, 95, 168–179 CrossRef CAS.
- Q. Zhang and Y. Hua, Mater. Chem. Phys., 2010, 119, 57–64 CrossRef CAS.
- R. Yıldız, Ionics, 2019, 25, 859–870 CrossRef.
- C. Zhu, H. X. Yang and Y. Z. Wang, et al., Ionics, 2019, 25, 1395–1406 CrossRef CAS.
- R. W. Bosch, J. Hubrecht, W. F. Bogaerts and B. C. Syrett, Corrosion, 2001, 57, 60–70 CrossRef CAS.
- A. S. Fouda, M. A. Ismail, A. M. Temraz and A. S. Abousalem, New J. Chem., 2019, 43, 768–789 RSC.
- S. Kaya, B. Tüzün, C. Kaya and I. B. Obot, J. Taiwan Inst. Chem. Eng., 2016, 58, 528–535 CrossRef CAS.
- A. Karim, A. N. Al-Rawi, A. Kara, T. S. Rahman, O. Trushin and T. Ala-Nissilä, Phys. Rev. B: Condens. Matter Mater. Phys., 2006, 73(16), 165411 CrossRef.
- B. Lin and Y. Zuo, RSC Adv., 2019, 9, 7065 RSC.
- E. E. El-Katori and Y. M. Al Angari, Int. J. Electrochem. Sci., 2018, 13, 4319–4337 CrossRef CAS.
- A. Zarrouk, B. Hammouti, H. Zarrok, S. S. Al-Deyab and I. Warad, Res. Chem. Intermed., 2012, 38, 1655–1668 CrossRef CAS.
- S. Javadian, V. Ruhi, A. Asadzadeh Shahir, A. Heydari and J. Akbari, Ind. Eng. Chem. Res., 2013, 52, 15838–15846 CrossRef CAS.
- S. Javadian, V. Ruhi, A. Heydari, A. Asadzadeh Shahir, A. Yousefi and J. Akbari, Ind. Eng. Chem. Res., 2013, 52, 4517–4526 CrossRef CAS.
- A. Yousefi, S. Javadian and J. Neshati, Ind. Eng. Chem. Res., 2014, 53, 5475–5489 CrossRef CAS.
- S. Javadian, A. Yousefi and J. Neshati, Appl. Surf. Sci., 2013, 285, 674–681 CrossRef CAS.
- S. Y. Shiao, V. Chhabra, A. Patist, M. L. Free, P. D. T. Huibers, A. Gregory, S. Patel and D. O. Shah, Adv. Colloid Interface Sci., 1998, 74, 1–29 CrossRef CAS.
- D. Asefi, N. M. Mahmoodi and M. Arami, Colloids Surf., A, 2010, 355, 183–186 CrossRef CAS.
- Q. Zhang, Z. Gao, F. Xu and X. Zou, Colloids Surf., A, 2011, 380, 191–200 CrossRef CAS.
- K. F. Khaled, Corros. Sci., 2010, 52, 3225–3234 CrossRef CAS.
- M. A. Deyab, J. Ind. Eng. Chem., 2015, 22, 384–389 CrossRef CAS.
- R. Solmaz, E. A. Şahin, A. Döner and G. Kardaş, Corros. Sci., 2011, 53, 3231–3240 CrossRef CAS.
- A. S. Abousalem, M. A. Ismail and A. S. Fouda, J. Mol. Liq., 2019, 276, 255–274 CrossRef CAS.
- A. S. Fouda, A. S. Abousalem and G. Y. EL-Ewady, Int. J. Ind. Chem., 2017, 8, 61–73 CrossRef CAS.
- M. N. El-Haddad, A. S. Fouda and H. A. Mostafa, J. Mater. Eng. Perform., 2013, 22, 2277–2287 CrossRef CAS.
- M. A. Amin, S. S. A. EI-Rehim, E. E. F. El-Sherbini, O. A. Hazzazi and M. N. Abbas, Corros. Sci., 2009, 51, 658–667 CrossRef CAS.
- B. M. Prasanna, B. M. Praveen, H. Narayan, M. K. Pavithra, T. S. Manjunatha and R. S. Malladi, Surf. Interface Anal., 2018, 50, 779–789 CrossRef CAS.
- A. S. Fouda, M. A. Ismail, A. S. Abousalem and G. Y. Elewady, RSC Adv., 2017, 7, 46414–46430 RSC.
- I. B. Obot, D. D. Macdonald and Z. M. Gasem, Corros. Sci., 2015, 99, 1–30 CrossRef CAS.
- A. Singh, K. R. Ansari, M. A. Quraishi, H. Lgaz and Y. Lin, J. Alloys Compd., 2018, 762, 347–362 CrossRef CAS.
- F. Tezcan, G. Yerlikaya, A. Mahmood and G. Kardaş, J. Mol. Liq., 2018, 269, 398–406 CrossRef CAS.
- S. Bashir, V. Sharma, H. Lgaz, I.-M. Chung, A. Singh and A. Kumar, J. Mol. Liq., 2018, 263, 454–462 CrossRef CAS.
- A. Bousskri, A. Anejjar, M. Messali, R. Salghi, O. Benali, Y. Karzazi, S. Jodeh, M. Zougagh, E. E. Ebenso and B. Hammouti, J. Mol. Liq., 2015, 211, 1000–1008 CrossRef CAS.
- D. Daoud, T. Douadi, H. Hamani, S. Chafaa and M. Al-Noaimi, Corros. Sci., 2015, 94, 21–37 CrossRef CAS.
- A. Salhi, S. Tighadouini, M. El-Massaoudi, M. Elbelghiti, A. Bouyanzer, S. Radi, S. El Barkany, F. Bentiss and A. Zarrouk, J. Mol. Liq., 2017, 248, 340–349 CrossRef.
- K. F. Khaled, J. Solid State Electrochem., 2009, 13, 1743–1756 CrossRef CAS.
|
| This journal is © The Royal Society of Chemistry 2019 |
Click here to see how this site uses Cookies. View our privacy policy here. 
 Open Access Article
 This Open Access Article is licensed under a Creative Commons Attribution-Non Commercial 3.0 Unported Licence
 *a and
Ashraf S. Abousalem
*a and
Ashraf S. Abousalem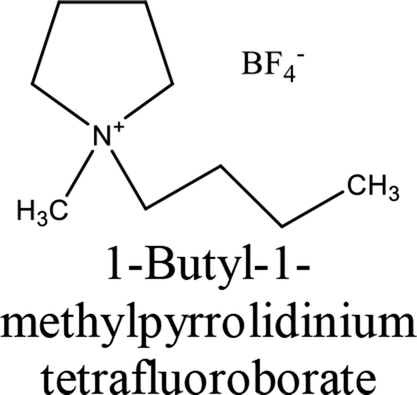


 are the charge-transfer resistance values with and without inhibitors, respectively.


 are corrosion current densities with and without inhibitors, correspondingly. The causality factors CF-2 and CF-3 summarized in Table 6 are very close to their theoretical values of 2.0 and 3.0, respectively. This suggests that the calculated EFM parameters are valid and of excellent quality. Hence, the results from (EFM) method demonstrated that all the investigated inhibitors have good inhibiting power for copper corrosion in nitric acid. Derived from these data, the electrochemical frequency modulation test appears able to examine the corrosion inhibition of copper in nitric acid by various concentrations of ILs compounds.


 values are negative, and this indicates the spontaneity of the adsorption process and stability of the adsorbed ILs films on the copper surface.