
 Open Access Article
 This Open Access Article is licensed under a Creative Commons Attribution-Non Commercial 3.0 Unported Licence
Facile and low-cost synthesis of pure hematite (α-Fe2O3) nanoparticles from naturally occurring laterites and their superior adsorption capability towards acid-dyes
D. M. S. N. Dissanayakeab,
M. M. M. G. P. G. Mantilaka *ab,
T. C. Palihawadanaa,
G. T. D. Chandrakumaraab,
R. T. De Silvaa,
H. M. T. G. A. Pitawalabc,
K. M. Nalin de Silvaad and
G. A. J. Amaratungaae
*ab,
T. C. Palihawadanaa,
G. T. D. Chandrakumaraab,
R. T. De Silvaa,
H. M. T. G. A. Pitawalabc,
K. M. Nalin de Silvaad and
G. A. J. Amaratungaae
aSri Lanka Institute of Nanotechnology, Nanotechnology and Science Park, Mahenwatte, Pitipana, Homagama, Sri Lanka. E-mail: rasangam@slintec.lk; mantilaka@gmail.com
bPostgraduate Institute of Science, University of Peradeniya, Peradeniya, Sri Lanka
cDepartment of Geology, Faculty of Science, University of Peradeniya, Peradeniya, Sri Lanka
dDepartment of Chemistry, Faculty of Science, University of Colombo, Colombo 3, Sri Lanka
eElectrical Engineering Division, Department of Engineering, University of Cambridge, 9 J. J. Thomson Avenue, Cambridge CB3 0FA, UK
First published on 9th July 2019
Abstract
Hematite nanoparticles have a broad range of outstanding applications such as in wastewater treatment, electrolytic studies, and photoelectrochemical and superparamagnetic applications. Therefore, the development of facile and novel methods to synthesize hematite nanoparticles using low-cost raw materials is an important and timely requirement. In this study, we have developed a facile economical route to synthesize hematite nanoparticles, directly from the naturally occurring material laterite. Laterite is a rock that is rich in Fe and Al with extensive distribution in large mineable quantities in many countries around the world, though not yet utilized for major industrial applications. In this method, ferric ions in the laterite were leached out using acid and the solution obtained was hydrolyzed with slow-release hydroxyl ions which were acquired by aqueous decomposition of urea. The resulted precursor was calcined to obtain hematite nanoparticles. Characterization data shows that the final product is comprised of spherical hematite nanoparticles with a narrow particle size vs. frequency distribution with an average particle diameter of 35 nm. The synthesized product has a purity of over 98%. Furthermore, the synthesized nanoparticles show an excellent adsorption percentage as high as 70%, even when the initial dye concentration in water is 5000 ppm and the amount of material is minimal, towards acid dyes which are excessively used in textile based industries. Such acid dyes are a threat to the environment when they are released into water bodies by industries in massive quantities. Therefore synthesized hematite nanoparticles are ideal to treat dye wastewater in industrial effluents because such nanoparticles are low cost and economical, and the synthesis procedure is rather facile and effective.
Introduction
Iron oxide nanoparticles have superior properties compared to conventional sizes of the same material due to their high surface area-to-volume ratio. Hence, such nanoparticles have been immensely valuable materials due to their versatility in nanotechnology related applications with outstanding properties including thermal stability,1–3 non-toxicity and characteristics such as magnetic, catalytic, adsorptive and electric properties. Magnetic iron oxide particles are widely used in various imaging techniques such as magnetic resonance imaging (MRI),4–6 molecular imaging1,7–9 and some biomedical applications including drug delivery systems,10–12 hyperthermia,13,14 tissue repair13,15 and purification of DNA.16 Such nanoparticles are widely used in sonocatalytic and photocatalytic17–20 applications.Naturally, iron oxides exist in different crystalline forms due to their different oxidizing states in atmospheric conditions. Such forms are hematite (α-Fe2O3), magnetite (FeO·Fe2O3), maghemite (γ-Fe2O3), β-Fe2O3, ε-Fe2O3, and wusite (FeO).21 Hematite is the oldest known iron oxide and is widespread mainly in red rocks and soils. Its colour is blood-red (Greek haima = blood) if finely divided and black or a sparkling grey if they are coarsely crystalline. Hematite has the corundum (Al2O3) structure which is based on an hcp anion packing. Similar to goethite, it is extremely stable and is often the end form of transformations of other iron oxides. Hematite is an important pigment and a valuable ore.21 On the other hand, nanoparticles of hematite are used in various advanced applications such as solar water oxidation20,22–25 and water purification.
Conventional production methods of nanoparticles, mainly microwave-assisted synthesis, co-precipitation method, hydrothermal and high-temperature synthesis, sol–gel synthesis, polyol methods, flow injection synthesis, electrochemical methods, aerosol/vapour methods and sonolysis methods have been reported in the literature.3,26–36 It is an established fact that the production of these nanoparticles require a lot of resources, time, energy and human effort even for a single gram of nanopowder which in turn make it a very limited and expensive product that doesn't fulfil the current demand.35,37 Recent literature shows that hematite nanoparticles have been produced by methods such as hydrothermal synthesis,38,39 electrochemical synthesis,40 microwave assisted synthesis41 and so forth. Comparing the current synthesis procedure in this paper with previous work, it suggests that this method is facile and cost effective because it requires minimum materials and minimum energy to synthesize the nanoparticles with the same characteristics. Therefore identification of raw materials for the synthesis and simple, novel and industrial viable techniques are timely needed for the fulfilment of the current demand of iron oxide nanoparticles.
In this study, we have developed a novel, simple and low-cost method for the synthesis of hematite nanoparticles using iron-rich laterites as a natural resource. Laterite is a rock found with large mineable quantities, in equatorial tropical regions of the world.42 It is rich in iron and aluminium in various proportions. For the present study, an iron rich variety of laterites which is called ferruginous laterites42 was collected from Sri Lanka and used for the synthesis process. Synthesized nanoparticles were characterized by scanning electron microscopy coupled with energy dispersive X-ray spectroscopy, X-ray diffraction and Fourier transform infrared spectroscopy. The synthesis procedure requires minimum energy and materials for the production compared to the existing synthesis routes of iron oxide nanoparticles. Synthesized nanoparticles showed superior adsorption capacities towards acid dyes as demonstrated by industrially heavily used textile dye, Syno Acid Blue-NBF (SAB-NBF). This confirmed the effectiveness of synthesized iron oxide nanoparticles in industrial dye waste removal from wastewater by adsorption.
Experimental
Materials
All chemicals used in the experiments were of analytical grade and were used without further purification. Hydrochloric acid (38 wt%) and urea (99 wt%) were purchased from Sigma-Aldrich. Commercially available Syno Acid Blue-NBF (SAB-NBF) textile dye was used as a typical adsorbate in the study. Laterite rock samples were collected from Homagama, Sri Lanka.Methods
![[thin space (1/6-em)]](https://www.rsc.org/images/entities/char_2009.gif) 000 CPS for 4.5 min which is coupled with SEM. Thermal characteristics of the precipitates obtained were studied with thermogravimetric analysis (TGA) which was conducted using a TA SDT Q600 instrument under atmospheric conditions at a heating rate of 20 °C min−1 from 30 °C to 1000 °C.
000 CPS for 4.5 min which is coupled with SEM. Thermal characteristics of the precipitates obtained were studied with thermogravimetric analysis (TGA) which was conducted using a TA SDT Q600 instrument under atmospheric conditions at a heating rate of 20 °C min−1 from 30 °C to 1000 °C.
 | (1) |
The percentage adsorption (%) was calculated using eqn (2),
 | (2) |
Typical adsorption isotherms were studied by treating 25 ml of variable concentrations of dye solutions (1000, 2000, 6000, 8000 and 10000 ppm) with 0.2 g constant amounts of the adsorbate. In here, three types of adsorbates were used for the experiments such that as-synthesized hematite nanoparticles, raw laterite powder and calcined laterite powder. The adsorbate–adsorbent mixtures were sonicated for 30 seconds using a probe sonicator and stirred at 150 rpm for 20 minutes at 25 °C. The equilibrated mixtures were centrifuged at 9000 rpm for 30 min for the separation of solid adsorbate particles from the solution. The visible spectra of the initial and treated dye solutions were measured using UV-3600 Series UV-VIS-NIR spectrophotometer (Shimadzu, Japan) at 0.2 nm sample interval and 0.1 second time constant and maximum absorbance values at 620 nm were recorded for further calculations.
The adsorption data obtained from the batch experiments were analysed using the linear forms of Langmuir and Freundlich isotherm models as indicated in the eqn (3) and (4) respectively.
 | (3) |
 | (4) |
Results and discussion
Characterization and digestion process of laterites
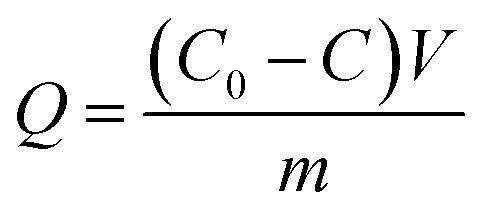
Laterites are mainly comprised of Fe, Al and Si bearing minerals such as goethite [FeO(OH)], hematite (Fe2O3), dickite [Al2Si2O5(OH)4], gibbsite [Al(OH3)] and quartz (SiO2). The XRD pattern obtained for raw laterite powder suggests that it has the crystalline phases including hematite (2θ = 34°, 36°, 63°, 65°/JCPDS card no. 72-469), dickite (2θ = 12°, 25°/JCPDS card no. 3-55), gibbsite (2θ = 21°, 55°, 78°/JCPDS card no. 76-1782) and quartz (2θ = 27°, 37°, 56°, 69°/JCPDS card no. 5-490) (Fig. 1a). Even though acid leaching process is applied mostly to Al-refining industry to digest Al-rich minerals,44 in the present study only the iron rich minerals are being digested with HCl, because theoretically the conditions used in the suggested process are not capable of leaching stable minerals and compounds such as quartz, aluminium oxides/hydroxides into the aqueous phase.45,46In order to make sure that ions other than Fe has come to the aqueous phase, an ICP-MS elemental analysis was done to the first supernatant (S-1) after the first reflux setup and the prepared nanoparticles (dissolved in HCl) (INp). As the results suggest as shown in Fig. 1b, the S-1 (black columns) contains 82% Fe and 15% Al as majorly and the red columns represent the final precipitate which shows, 95% Fe and 3% Al as majorly. These ICP-MS results suggest that the process retains some of the impurities in the second supernatant after the precipitate is formed, on the other hand it increases the content of Fe in the precipitate.
 | ||
| Fig. 1 (a) XRD pattern of the raw laterite powder used for the production as the iron source; (b) ICP-MS data for selected elements of S-1 and digested INp. | ||
The synthesis mechanism of IONp
The synthesis process of iron oxide nanoparticles composed of two parts, the hydrolysis of S-1 and its calcination. When considering the hydrolysis, urea acts as a slow releasing agent of hydroxyl ions upon heating. The decomposition process of urea in water upon elevated temperatures is as follows,First, the urea dissolves in water, creating an aqueous solution.
| NH2CONH2(aq) + H2O(l) ↔ 2NH3(g) + CO2 | (5) |
Then with temperature, ammonia gas is produced (5), in a combination of two major steps which are as follows: ((6)/(7))
| NH2CONH2(aq) + H2O(l) ↔ NH4COONH2(aq) | (6) |
| NH4COONH2(aq) ↔ NH3(g) + CO2(g) | (7) |
When the emitted ammonia gas reacts with the water, it releases ammonium ions resulting in hydroxyl ions.
| NH3(g) + H2O(l) ↔ NH4+(aq) + OH−(aq) | (8) |
This whole process helps the size of the iron hydroxide particles to be stabilized in the nanoscale. CO2 can re-dissolve in water and make CO3− ions. This results in iron carbonate precipitate in the precursor.
Synthesis of hematite nanoparticles
The extracted ferric ions through acid digestion of laterite sample reacts with hydroxyl ions of hydrolysed urea in order to produce precursor nanoparticles of iron hydroxides and carbonates (precursor composition is discussed in the current section). The obtained iron hydroxide and carbonate nanoparticles must be converted into iron oxide nanoparticles through calcination process. TGA plot (Fig. 2a) of iron hydroxide precursor suggests two decomposition steps. First thermal decomposition occurs around 100 °C with 4% mass loss due to the evaporation of physically bound water molecules from hygroscopic iron hydroxide precursor (section A). The second decomposition step from 200 °C to 600 °C occurs with mass loss of 14% as a result of the combination of solid urea decomposition (section B) and conversion of iron hydroxides into the iron oxides (section C). So the calcination temperature is identified to be 600 °C.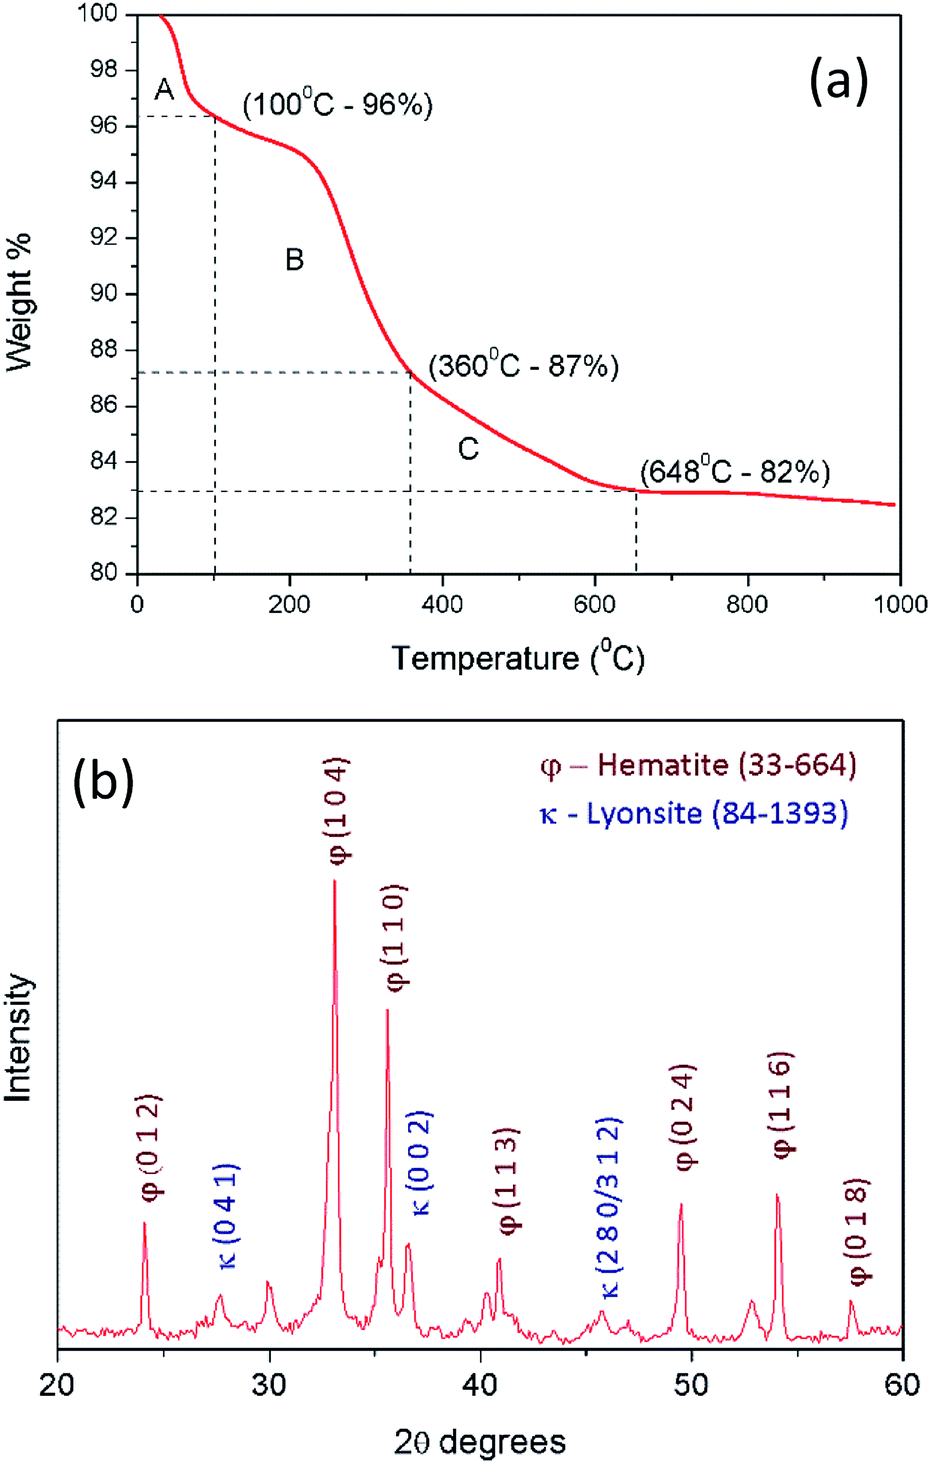 | ||
| Fig. 2 (a) Thermo gravimetric analysis for the prepared precipitate after urea precipitation; (b) XRD pattern of the calcined precipitate at 600 °C. | ||
Fig. 2b shows the XRD pattern of the final iron oxide product. It has a clear comparison between hematite (2θ = 24°, 30°, 33°, 35°, 40°, 49°, 54°, 57°/JCPDS card no. 33-664) and lyonsite (2θ = 27°, 36°, 46°/JCPDS card no. 84-1393).
Lyonsite is there as the crystalline phases of trace amount impurities present in S-1 as shown in Fig. 1b, as small amount as 0.1% while hematite covers 98% of the final precipitate.
The FTIR spectra of the raw laterites, calcined laterites, commercial hematite and the product from the proposed method are illustrated in Fig. 3. The characteristic broad peak around 540 cm−1 and the narrow peak ant 432 cm−1 corresponds to the bonds in Fe2O3 formation.47 Also, in raw laterites, there are some peaks corresponding to Si–O–Si stretching vibration, Si–OH stretching and Si–O bonding in the wavelengths of 1000 and 1460 cm−1.48 There are bands correspond to O–H bonds as appear at 1629 cm−1 and 3350 cm−1. This is due to the water molecules present in ambient conditions. Dissolved conjugated carbonate compounds could also be responsible for the band at 1629 cm−1. No peaks related to Al are shown in the FTIR here nevertheless XRD results suggests there are Al containing minerals in raw laterites. This may be due to low percentage. Also no any bonds corresponding to Si are seen in the prepared product and it has a good agreement with the commercial laterite as well.
 | ||
| Fig. 3 Fourier transform infrared spectroscopy result for raw laterite, calcined laterite and the precipitate with industrially available hematite. | ||
The EDX elemental mapping (Fig. 4) of the prepared product also suggests that it's free from impurities like Si and Al. But as suggested by Fig. 1b, the Al percentage of the final product is around 1%. Hence it can be concluded that EDX mapping result, XRD, FTIR and ICP-MS results for the prepared product are in good agreement that it is a pure hematite nanoparticles.
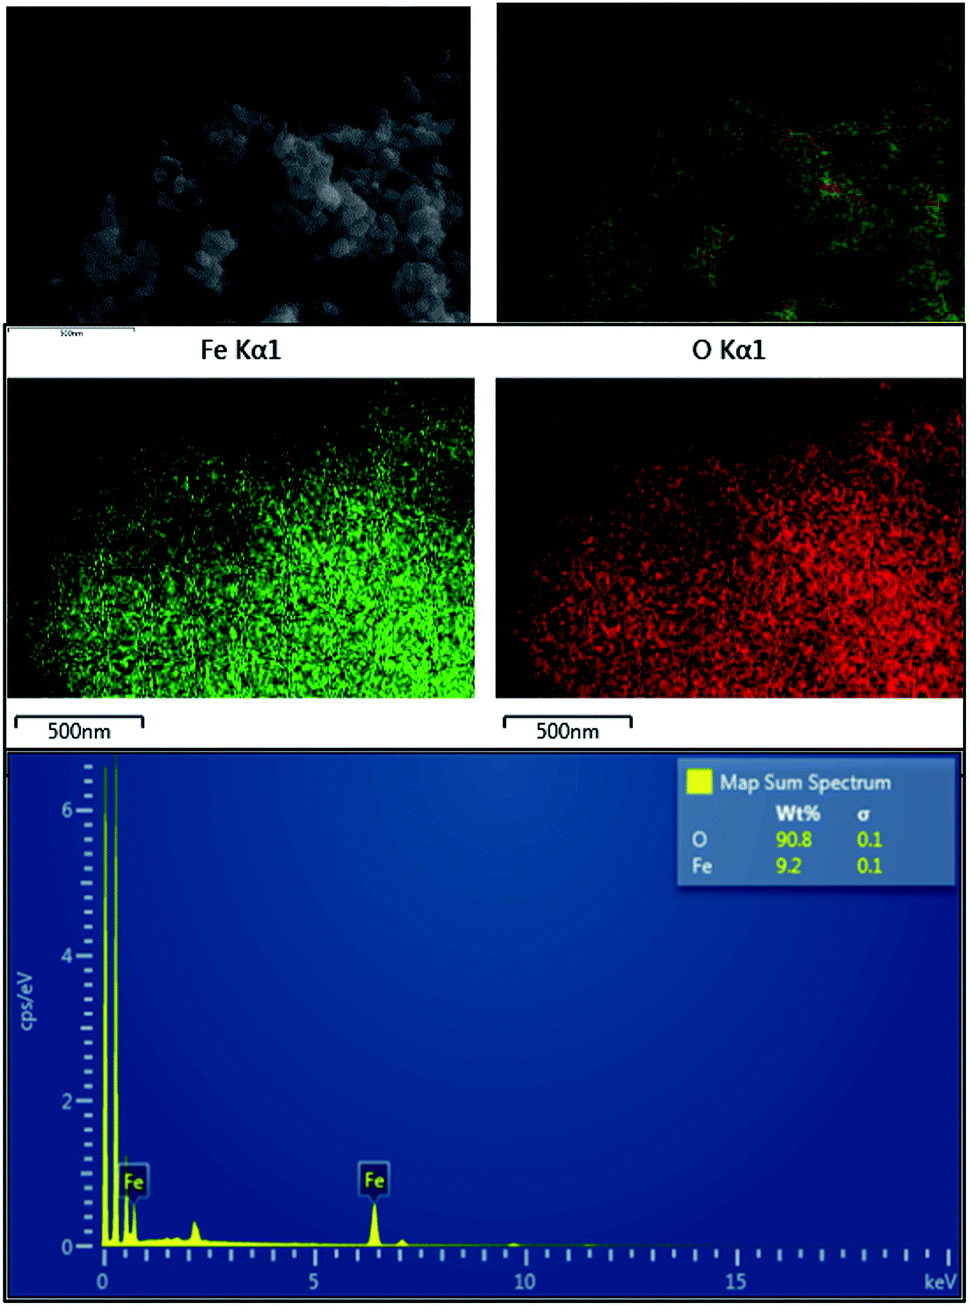 | ||
| Fig. 4 EDX mapping result for the final precipitate. | ||
When considering the morphology and the particle size of the particles as observed in SEM, it has a near spherical shape that in between spherical and tabular particle morphologies. The morphology before calcination is quite unclear because, unwashed urea is also crystalized in between the iron oxide nanoparticles upon drying. However when calcined, urea decomposes and iron oxide nanoparticles are clearly visible as shown in Fig. 5. The particle size distribution is very even as shown in the Fig. 5b. The average particle size of the final product is 35 nm which is ranging from 10 nm to 70 nm.
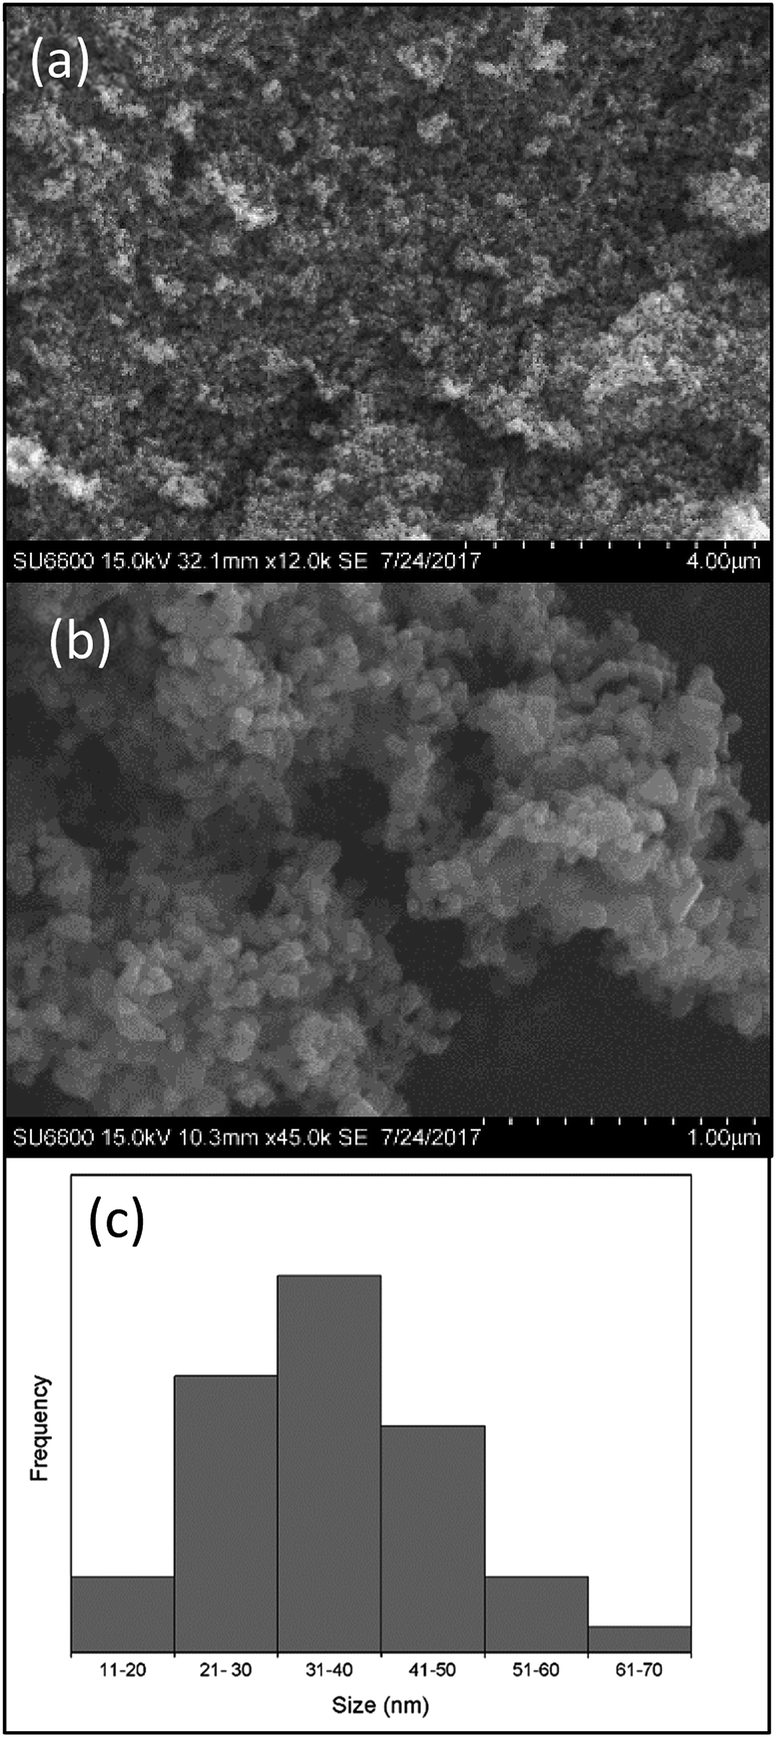 | ||
| Fig. 5 (a) and (b) SEM images; (c) particle size frequency distribution of the prepared hematite nanoparticles. | ||
When particle size and shape is taken into account, synthesized nanoparticles have a considerable smaller particle size when compared to literature,36,38,39,49 and a very stable even shape which is more or less spherical shape. The frequent question that raised is regarding the purity of the nanoparticles which have been synthesized by earth materials. These synthesized nanoparticles have over 98% purity as described in the above sections and minor amounts of impurities (Fig. 6).
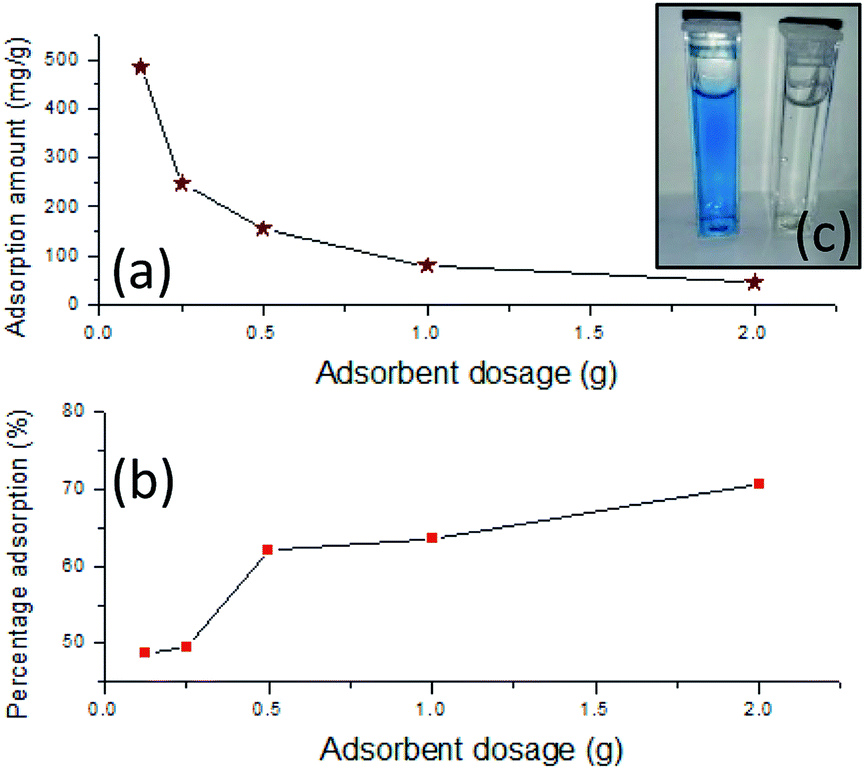 | ||
| Fig. 6 Graphs of (a) adsorption amount (Q) and (b) percentage adsorption versus adsorption dosage (c) the photograph of ppm SAB-NBF dye solutions (c) before and after the adsorption by INPs the 1000 at room temperature. | ||
| Adsorbent dosage (±0.0001) (g) | Percentage adsorption (%) | Q (mg g−1) | ||
|---|---|---|---|---|
| 0.1250 | 48.6167 | (±0.0362) | 486.1667 | (±1.8104) |
| 0.2500 | 49.3987 | (±0.0582) | 246.9933 | (±2.9084) |
| 0.5000 | 62.0607 | (±0.0803) | 155.1517 | (±4.0138) |
| 1.0000 | 63.6067 | (±0.0595) | 79.5083 | (±2.9768) |
| 2.0000 | 70.7440 | (±0.0904) | 44.2150 | (±4.5180) |
Whereas, the Freundlich isotherm model is considered as an empirical model. It describes the surface heterogeneity of the dye sorbent and heterogeneous energy distribution of surface active sites which yield multilayer adsorption due to the interaction between the adsorbed molecules. Fig. 7 indicates the linear plots of Langmuir and Freundlich isotherm models of the IONp with comparison to raw laterite and calcined laterite.
 | ||
| Fig. 7 Adsorption isotherm models for different adsorbent materials; (a) Langmuir; (b) Freundlich isotherms for raw laterite; (c) Langmuir; (d) Freundlich isotherms for calcined laterite; (e) Langmuir; (f) Freundlich isotherms for IONp. | ||
The parameters derived from the adsorption isotherms indicate the details of the adsorption mechanism of the SAB-NBF dye and the properties of the surface. The adsorption isotherm model constants and correlation coefficients for isotherm models are shown in Table 2.
| Langmuir adsorption isotherm constants | ||||
|---|---|---|---|---|
| R2 | Qm (mg g−1) | KL × 104 (L mg−1) | RL = 1/(1 + C0KL) | |
| Raw laterite | 0.99195 | 108.58 | 6.72 | (0.13–0.60) |
| Calcined laterite | 0.98050 | 161.29 | 5.82 | (0.15–0.63) |
| IONp | 0.96664 | 384.62 | 5.53 | (0.15–0.64) |
| Freundlich adsorption isotherm constants | |||
|---|---|---|---|
| R2 | n | KF (L g−1) | |
| Raw laterite | 0.97837 | 2.94 | 4.31 |
| Calcined laterite | 0.95058 | 2.62 | 4.32 |
| IONp | 0.99508 | 2.23 | 5.82 |
The maximum monolayer capacity for IONp of the surface was recorded as 384.62 mg g−1 while the Langmuir constant was 5.53 × 10⁻⁴ L mg−1 (Fig. 7e/Table 2).
The dimensionless equilibrium parameter RL represents the favourability of the adsorption. The RL = 0 indicate the adsorption is irreversible, the range of 0 > RL > 1 indicate the favourable adsorption if RL = 1, the adsorption is linear and RL > 1 is unfavourable adsorption. The RL values calculated from the Langmuir isotherm indicate the favourable dye adsorption of the material. When comparing to raw laterite and calcined laterites, both of which behave more or less the same way, the adsorption behaviour is' elevated when it comes to IONp. The monolayer adsorption capacity (Qm) is as low as 108.58 and 161.29 for raw laterites and calcined laterites respectively.
When considering the parameters calculated by the Freundlich isotherm for IONp (Fig. 7f), the constant corresponding to the adsorption capacity KF was given as 5.82 L g−1. The n value (heterogeneity factor) obtained from the slope of the isotherm explained the surface heterogeneity and the adsorption intensity.53,54 At the constant temperature and constant adsorbent dosage the n value (2.23) should be higher than one, upon which the adsorption is favourable.53 As for the control experiments the values are lower than the IONp and again proves that the prepared material is superior in adsorption behaviour.
When comparing the value of the regression coefficient R2 of the above linear plots for SAB-NBF dye adsorption on the IONp surface suggest that, Freundlich adsorption isotherm has higher R2 (0.99508) and can be considered as best fitting model. And for raw laterite and calcined laterites R2 value is higher in Langmuir isotherm model than the Freundlich model. Hence the best fitting model for those materials can be defined as Langmuir isotherm model.
The increment of the adsorption property of IONp than the raw materials depends upon several factors. Firstly, the nanoparticles have high surface area per a unit volume than the raw materials, hence the number of adsorption sites are higher and probability of an adsorbent molecule to meet an adsorbent site is very high. Also when considering the raw materials, they consists of several mineral phases which have different surface charges and adsorption capabilities. When one site is attracting the adsorbent, another site might repel it.
However detailed studies are needed to predict the actual adsorption behaviours of different mineral phases when in a rock mass. Also as shown in Fig. 7 and Table 2, the adsorption capacity has increased slightly when the laterite is calcined. This is because of the transformation of hydrated mineral phases in to oxide state.
Not only this IONp material is better adsorbent than raw materials, it is also a better competitive material when it comes to other studies on acid dyes as well. According to Table 2; the monolayer adsorption capacity Qm of this material is 384.62 mg g−1. Compared to the values given in literature (Table 3) this material has a superior adsorption capacity. Hence the material requirement for a possible waste treatment plant will be very small amount and the cost of materials production will be very low as the method suggests.
| Adsorbate dye | Qm (mg g−1) | Adsorbent | Ref. |
|---|---|---|---|
| Rhodamine B | 89.3 | SDS modified molecular seeds supported by Fe2O3 | 55 |
| Acid violet 19 | 0.99 | Polyaniline–Fe2O3 | 56 |
| Acid red | 16.31 | γ-Fe2O3 nanoparticles (50 nm) | 57 |
| Anthraquinone blue | 25.70 | Fe2O3 powder | 58 |
| Methyl orange | 34.29 | Fe2O3/SiO2/chitosan composite | 59 |
| Congo red | 200.8 | γ-Fe2O3 nanoparticles | 60 |
| Alizarin red S | 108.69 | Carbon/γ-Fe2O3 | 61 |
| SAB-NBF | 108.58 | Raw laterite | Current study |
| SAB-NBF | 161.29 | Calcined laterite | |
| SAB-NBF | 384.62 | IONp |
Conclusions
An alternative facile and economical synthesis route was devised to produce hematite nanoparticles from laterite rock/deposits which consists of digestion of the rock using acid to leach the iron into the solution as Fe3+ ions and synthesizing the nanoparticles of iron oxide by the aid of OH− groups released when the urea is decomposed, followed by calcination. The SEM studies showed that the morphology of the nanoparticles are near-spherical and the average diameter is 35 nm. Also the method consumes minimum energy and minimum wastage of material in producing these nanomaterials. The synthesized hematite nanoparticles showed superior adsorption efficiency for SAB-NBF dyes. For instance, even at 5000 ppm dye concentration level the adsorption efficiency of nanoparticles deemed to be remarkable (up to 70% of adsorption percentage and 384.62 mg g−1 monolayer adsorption capacity). The adsorption mechanism was well described by the Freundlich isotherm than the Langmuir isotherm. These findings indicates that the synthesised hematite nanoparticles are a promising adsorbate material to treat industrial acid dye effluents using low cost naturally available mineral resources.Conflicts of interest
There are no conflicts to declare.Acknowledgements
The research was financially assisted by the National Research Council (Grant no. 16-123), Sri Lanka. The authors would like to acknowledge all the staff members of Sri Lanka Institute of Nanotechnology for their support in many ways to complete this research successfully.References
- K. Yan, P. Li, H. Zhu, Y. Zhou, J. Ding, J. Shen, Z. Li, Z. Xu and P. K. Chu, RSC Adv., 2013, 3, 10598–10618 RSC
.
- F. Fajaroh, H. Setyawan, A. Nur and I. W. Lenggoro, Adv. Powder Technol., 2013, 24, 507–511 CrossRef CAS
- B. I. Kharisov, H. R. Dias, O. V. Kharissova, V. M. Jiménez-Pérez, B. O. Perez and B. M. Flores, RSC Adv., 2012, 2, 9325–9358 RSC
- C. Sun, J. S. Lee and M. Zhang, Adv. Drug Delivery Rev., 2008, 60, 1252–1265 CrossRef CAS
- H.-Y. Lee, Z. Li, K. Chen, A. R. Hsu, C. Xu, J. Xie, S. Sun and X. Chen, J. Nucl. Med., 2008, 49, 1371–1379 CrossRef CAS PubMed
- R. Qiao, C. Yang and M. Gao, J. Mater. Chem., 2009, 19, 6274–6293 RSC
- J.-H. Lee, Y.-M. Huh, Y.-w. Jun, J.-w. Seo, J.-t. Jang, H.-T. Song, S. Kim, E.-J. Cho, H.-G. Yoon and J.-S. Suh, Nat. Med., 2007, 13, 95–99 CrossRef CAS
- D. L. Thorek, A. K. Chen, J. Czupryna and A. Tsourkas, Ann. Biomed. Eng., 2006, 34, 23–38 CrossRef
- J. W. Bulte and D. L. Kraitchman, NMR Biomed., 2004, 17, 484–499 CrossRef CAS PubMed
- B. Chertok, B. A. Moffat, A. E. David, F. Yu, C. Bergemann, B. D. Ross and V. C. Yang, Biomaterials, 2008, 29, 487–496 CrossRef CAS
- H.-L. Xu, K.-L. Mao, Y.-P. Huang, J.-J. Yang, J. Xu, P.-P. Chen, Z.-L. Fan, S. Zou, Z.-Z. Gao and J.-Y. Yin, Nanoscale, 2016, 8, 14222–14236 RSC
- K. Kavithaa, M. Paulpandi, P. R. Padma and S. Sumathi, RSC Adv., 2016, 6, 64531–64543 RSC
- A. K. Gupta and M. Gupta, Biomaterials, 2005, 26, 3995–4021 CrossRef CAS
- S. Laurent, S. Dutz, U. O. Häfeli and M. Mahmoudi, Adv. Colloid Interface Sci., 2011, 166, 8–23 CrossRef CAS
- A. K. Gupta, R. R. Naregalkar, V. D. Vaidya and M. Gupta, Nanomedicine, 2007, 2, 23–39 CrossRef CAS
- M. Mahmoudi, A. Simchi, A. Milani and P. Stroeve, J. Colloid Interface Sci., 2009, 336, 510–518 CrossRef CAS
- J. M. Perez, Nat. Nanotechnol., 2007, 2, 535–536 CrossRef CAS
- H. Lim, J. Lee, S. Jin, J. Kim, J. Yoon and T. Hyeon, Chem. Commun., 2006, 463–465 RSC
- A. S. Ganeshraja, K. Rajkumar, K. Zhu, X. Li, S. Thirumurugan, W. Xu, J. Zhang, M. Yang, K. Anbalagan and J. Wang, RSC Adv., 2016, 6, 72791–72802 RSC
- L. Zhou, X. Lv, Y. Nie, J. Deng, H. Zhang, X. Sun and J. Zhong, RSC Adv., 2016, 6, 92206–92212 RSC
- R. M. Cornell and U. Schwertmann, The iron oxides: structure, properties, reactions, occurrences and uses, John Wiley & Sons, 2003 Search PubMed
- S. D. Tilley, M. Cornuz, K. Sivula and M. Grätzel, Angew. Chem., Int. Ed., 2010, 49, 6405–6408 CrossRef CAS
- B. Iandolo, H. Zhang, B. Wickman, I. Zorić, G. Conibeer and A. Hellman, RSC Adv., 2015, 5, 61021–61030 RSC
- Q. Yu, X. Meng, L. Shi, G. Liu, P. Li and J. Ye, RSC Adv., 2016, 6, 62263–62269 RSC
- D. Danaei, R. Saeidi and A. Dabirian, RSC Adv., 2015, 5, 11946–11951 RSC
- P. Das, B. Mondal and K. Mukherjee, RSC Adv., 2014, 4, 31879–31886 RSC
- S. Laurent, D. Forge, M. Port, A. Roch, C. Robic, L. Vander Elst and R. N. Muller, Chem. Rev., 2008, 108, 2064–2110 CrossRef CAS PubMed
- D. Maity and D. Agrawal, J. Magn. Magn. Mater., 2007, 308, 46–55 CrossRef CAS
- A. S. Teja and P.-Y. Koh, Prog. Cryst. Growth Charact. Mater., 2009, 55, 22–45 CrossRef CAS
- C. Cheng, F. Xu and H. Gu, New J. Chem., 2011, 35, 1072–1079 RSC
- B. Ahmmad, K. Leonard, M. S. Islam, J. Kurawaki, M. Muruganandham, T. Ohkubo and Y. Kuroda, Adv. Powder Technol., 2013, 24, 160–167 CrossRef CAS
- P. K. Raul, R. R. Devi, I. M. Umlong, A. J. Thakur, S. Banerjee and V. Veer, Mater. Res. Bull., 2014, 49, 360–368 CrossRef CAS
- D. Wang, P. Yang and B. Huang, Mater. Res. Bull., 2016, 73, 56–64 CrossRef CAS
- P. Yang, D. Wang, J. Zhao and R. Shi, Mater. Res. Bull., 2015, 65, 36–41 CrossRef CAS
- A. Ali, M. Z. Hira Zafar, I. ul Haq, A. R. Phull, J. S. Ali and A. Hussain, Nanotechnol., Sci. Appl., 2016, 9, 49 CrossRef CAS
- I. Fernández-Barahona, M. Muñoz-Hernando and F. Herranz, Molecules, 2019, 24, 1224 CrossRef PubMed
- S. Laurent, A. A. Saei, S. Behzadi, A. Panahifar and M. Mahmoudi, Expert Opin. Drug Delivery, 2014, 11, 1449–1470 CrossRef CAS
- M. Zhu, Y. Wang, D. Meng, X. Qin and G. Diao, J. Phys. Chem. C, 2012, 116, 16276–16285 CrossRef CAS
- S.-B. Wang, Y.-L. Min and S.-H. Yu, J. Phys. Chem. C, 2007, 111, 3551–3554 CrossRef CAS
- C. Pascal, J. Pascal, F. Favier, M. Elidrissi Moubtassim and C. Payen, Chem. Mater., 1999, 11, 141–147 CrossRef CAS
- W.-W. Wang, Y.-J. Zhu and M.-L. Ruan, J. Nanopart. Res., 2007, 9, 419–426 CrossRef CAS
- R. Bourman, Aust. J. Earth Sci., 1993, 40, 387–401 CrossRef
- S. Pradhan, V. Sahu and B. Mishra, J. Mol. Catal. A: Chem., 2016, 425, 297–309 CrossRef CAS
- A.-c. Zhao, L. Yan, T.-a. Zhang, G.-z. LÜ and Z.-h. Dou, Trans. Nonferrous Met. Soc. China, 2013, 23, 266–270 CrossRef CAS
- M. Silveira, L. Alleoni, G. O'connor and A. Chang, Chemosphere, 2006, 64, 1929–1938 CrossRef CAS
- Q. Chen, Y. Xu and L. G. Hepler, Can. J. Chem., 1991, 69, 1685–1690 CrossRef CAS
- C. J. Serna, J. L. Rendon and J. E. Iglesias, Spectrochim. Acta, Part A, 1982, 38, 797–802 CrossRef
- S. C. Feifel and F. Lisdat, J. Nanobiotechnol., 2011, 9, 59 CrossRef CAS
- R. Zysler, D. Fiorani, A. Testa, L. Suber, E. Agostinelli and M. Godinho, Phys. Rev. B: Condens. Matter Mater. Phys., 2003, 68, 212408 CrossRef
- P. Xu, G. M. Zeng, D. L. Huang, C. L. Feng, S. Hu, M. H. Zhao, C. Lai, Z. Wei, C. Huang and G. X. Xie, Sci. Total Environ., 2012, 424, 1–10 CrossRef CAS
- S. Bishnoi, A. Kumar and R. Selvaraj, Mater. Res. Bull., 2018, 97, 121–127 CrossRef CAS
- H. Liu, Z. Wang, H. Li, H. Wang and R. Yu, Mater. Res. Bull., 2018, 100, 302–307 CrossRef CAS
- S. Shariati, M. Faraji, Y. Yamini and A. A. Rajabi, Desalination, 2011, 270, 160–165 CrossRef CAS
- A. Afkhami and R. Moosavi, J. Hazard. Mater., 2010, 174, 398–403 CrossRef CAS
- A. A. AbdulRazak and S. Rohani, Adv. Mater. Sci. Eng., 2018, 2018, 1–10 CrossRef
- M. R. P. V. Shrivastava, J. Mater. Environ. Sci., 2015, 6, 11–21 Search PubMed
- N. N. Nassar, Sep. Sci. Technol., 2010, 45, 1092–1103 CrossRef CAS
- K. H. Gonawala and M. J. Mehta, Int. J. Eng. Res. Appl., 2014, 4, 102–109 Search PubMed
- H. Zhu, R. Jiang, Y.-Q. Fu, J.-H. Jiang, L. Xiao and G.-M. Zeng, Appl. Surf. Sci., 2011, 258, 1337–1344 CrossRef CAS
- L. Lu, J. Li, J. Yu, P. Song and D. H. Ng, Chem. Eng. J., 2016, 283, 524–534 CrossRef CAS
- M. Fayazi, M. Ghanei-Motlagh and M. A. Taher, Mater. Sci. Semicond. Process., 2015, 40, 35–43 CrossRef CAS
| This journal is © The Royal Society of Chemistry 2019 |