 Open Access Article
X-ray absorption near edge structure simulation of LiNi0.5Co0.2Mn0.3O2 via first-principles calculation†
Toshiharu Ohnuma * and
Takeshi Kobayashi
Material Science Research Laboratory, Central Research Institute of Electric Power Industry (CRIEPI), 2-6-1 Nagasaka, Yokosuka-shi, Kanagawa-ken 240-0196, Japan. E-mail: ohnuma@criepi.denken.or.jp
First published on 4th November 2019
Abstract
Simulation of Ni K-edge X-ray absorption near edge structure (XANES) spectra in LiNi0.5Co0.2Mn0.3O2 (NCM523) was performed. The structure of NCM523 was optimized by first-principles calculation based on density functional theory and XANES spectrum simulation via the finite difference method. The calculated Ni K-edge XANES spectra of NCM523 with Li amounts of 1.0 and 0.5 showed good agreement with the measured spectra. The bond length between Ni and O shortened as the valence of Ni increased. Distortion of the structure resulting from Jahn–Teller distortion was observed with Ni3+. The XANES spectra of the Ni K-edge of Ni2+, Ni3+, and Ni4+ were calculated. In NCM523 with a Li amount of 1.0, the spectrum of Ni3+ shifts towards the higher energy side compared to that of Ni2+; at a Li amount of 0.5 the absorption edge of Ni2+, Ni3+, and Ni4+ shifts toward a higher energy as valence increases. Even at the same Ni valence number, the XANES spectra were different when the Li amounts were 1.0 and 0.5. Cation mixing of Li/Ni readily occurs at a Li amount of 1.0, more than that of 0.5 because of the super exchange interaction. The K-edge XANES spectrum of the Ni of the Li site did not change the position of the absorption edge of the Ni site Ni2+ XANES spectrum; a difference in shape of the shoulder peak and the pre-edge peak appeared. From these results, the Ni valence, bonding state, and cation mixing effect of Li/Ni on the Ni K-edge XANES spectrum in NCM523 were clarified.
Introduction
Lithium ion batteries are widely used in mobile phones, laptop computers, electric vehicles, etc.1–4 LiCoO2 has been widely used as a positive electrode for lithium ion batteries. Since Co is expensive and toxic, in order to achieve a higher capacity, lower cost, and higher thermal stability, the ternary positive electrode material LiNixCoyMnzO2 (NCM) has often been used.5–36 In NCM, the capacity increases as Ni content increases, but the charge/discharge cycle degradation because of Li/Ni cation mixing readily occurs, decreasing the thermal stability.5,6 However, Mn improves the thermal stability of NCM.In NCM, it is known that the atomic configurations of transition metals have ordered structures.7,8 Among various NCMs, NCM523 best balances capacity, thermal stability, and cost.35 Because NCM523 has a large unit cell, many Ni, Co, and Mn arrangements can be used. Dixit et al. used a combination of the classical molecular dynamics method and first-principles calculation for various models such as √3 × √3, linear, and random configurations to determine the most stable structure of [√3 × √3] R 30° from among 256 different configurations.9 In NCM, the valence and electronic states of Ni and Co change with the change in Li amount caused by the charge/discharge cycle. Changes in valence and electronic states of transition metals in positive electrodes can be analyzed using X-ray absorption fine structure (XAFS) measurement in the energy region of the X-ray absorption near edge structure (XANES).11–15
In NCM, it is known that Li/Ni cation mixing occurs when lithium is released/inserted by charge/discharge cycle.17 Therefore, the change in the valence and electronic states of the transition metal because of the lithium in the transition metal layer and Ni in the lithium layer (Li/Ni cation mixing) cause the change in the XANES spectrum. Furthermore, the XANES spectrum varies with valence state, bonding state, and the coordination environment of Ni and Co depending on the change in the amount of Li. The difference in the valence, bonding state, and coordination environment of Ni and Co is difficult to distinguished by simply comparing the XANES spectra obtained in an experiment.18–20 Therefore, to understand the XANES spectral change in experiment, it is useful to investigate the influence of valence, bonding state, and coordination environment via XANES spectrum simulation based on first-principles calculation.
There are three approaches to XANES spectrum simulation by first-principles calculation: calculating from the band structure, multiple scattering theory and finite difference method.36–43 For XANES spectral simulation of positive electrode materials, calculations of the Co K-edge for LiCoO2 by the full potential augmented plane wave (FLAPW) + local orbitals (lo) methods and projector augment wave (PAW) method; calculation of the Co K-edge for LiCoVO4 by multiple scattering theory; calculation of the K-edge of Co, Ni, and Mn of the LiNi1/3Co1/3Mn1/3O2 by FLAPW + lo method; and calculation of the Mn K-edge for the LiMnO3 by PAW method are performed.36–41 In the XANES spectrum simulation of Ca and S K-edge of CaS, finite difference method calculation shows better agreement with the experiment than FLAPW + lo method or multiple scattering theory calculations.43 Although it is possible to perform XANES spectrum simulation via multiple scattering theory or finite difference method at high speed, it is difficult to optimize the structure. Therefore, we optimized the structure by first-principles calculation based on density functional theory and performed XANES spectrum simulation via finite difference method.
In this study, focusing on Ni in which a valence resulting from charge and discharge occurs mainly in NCM523 with Li amounts of 1.0 and 0.5, simulation of XANES spectra of the Ni K-edge were performed to study the effect of the Li amount, Ni valence number, a Li/Ni cation mixing on the change in the XANES spectrum.
Calculation method
The structure of NCM523 was calculated using the Vienna ab initio Simulation Package (VASP) code which is the first-principle calculation code by the plane wave basis PAW method.44,45 We used the DFT+U method for the Ni, Co, and Mn 3d electrons which treat the interaction between localized electrons as on-site Coulomb interactions.46 The Hubbard U value was set to 5.96 eV for Ni, 5.00 eV for Co, and 5.10 eV for Mn.9 For the electronic correlation, a generalized gradient approximation was used.47 Brillouin zone sampling was performed using the Monkhorst–Pack scheme with a 2 × 2 × 1 mesh.48 A supercell of 240 atoms, the unit cell of LiCoO2 layered oxides of 5 × 4 × 1, was used. As for the structure of NCM523, structural optimization was performed with an initial arrangement of Ni, Co, and Mn [√3 × √ 3] R 30° as determined by Dixit et al.9 The antiferromagnetic arrangement of each element was used as a magnetic structure.16 As initial values of magnetic moment, Ni, Co and Mn were set to 2 μB, 0 μB and −3 μB, respectively, and the final magnetic moment was determined by structure optimization.In Li0.5-NCM, with a Li amount of 0.5, the Li atomic configuration was determined using the first-principles molecular dynamics method. The first-principles molecular dynamics calculation of 30 ps was performed with a time step 1 fs at a temperature of 500 K after quenching to 0 K by 5 ps run based on the configuration of 5 cases of 10 ps, 15 ps, 20 ps, 25 ps, and 30 ps snapshots. The structure based on 30 ps was the most stable and was used as the structure of Li0.5-NCM523. Li/Ni cation mixing was calculated at Li1.0-NCM523 with a Li amount of 1.0 and Li0.5-NCM523.
XANES spectra were calculated using the FDMNES code based on finite difference method.42 We used the atomic configuration and magnetic moment of each atom obtained via structure optimization using the VASP code. Configuration of d-electrons of Ni, Co and Mn used in FDMNES code are shown in Table 1. The same value was used for Hubbard U as that for structural optimization. A cluster radius of 7 Å was used. The quadrupole approximation was used. The XANES spectra were calculated using 30 atoms, i.e. all the Ni atoms in the supercell.
| Up spin | Down spin | |
|---|---|---|
| Ni2+ | 5.0 | 3.0 |
| Ni3+ | 4.5 | 3.5 |
| Ni4+ | 4.0 | 4.0 |
| Co3+ | 3.5 | 3.5 |
| Co4+ | 3.0 | 4.0 |
| Mn4+ | 1.0 | 4.0 |
Experimental method
NCM523 (Thank Metal Co., Ltd.) was used as a cathode material, acetylene black (AB) (Denka Co., Ltd.) and vapor grown carbon fiber (VGCF) were used as conductive additive materials, and polyvinylidene fluoride (Kureha Co., Ltd.) was used as a binder, as described elsewhere.49 The mixing ratios were NCM523![[thin space (1/6-em)]](https://www.rsc.org/images/entities/char_2009.gif) :
:![[thin space (1/6-em)]](https://www.rsc.org/images/entities/char_2009.gif) AB
AB![[thin space (1/6-em)]](https://www.rsc.org/images/entities/char_2009.gif) :
:![[thin space (1/6-em)]](https://www.rsc.org/images/entities/char_2009.gif) VGCF
VGCF![[thin space (1/6-em)]](https://www.rsc.org/images/entities/char_2009.gif) :
:![[thin space (1/6-em)]](https://www.rsc.org/images/entities/char_2009.gif) PVdF = 85
PVdF = 85![[thin space (1/6-em)]](https://www.rsc.org/images/entities/char_2009.gif) :
:![[thin space (1/6-em)]](https://www.rsc.org/images/entities/char_2009.gif) 3
3![[thin space (1/6-em)]](https://www.rsc.org/images/entities/char_2009.gif) :
:![[thin space (1/6-em)]](https://www.rsc.org/images/entities/char_2009.gif) 3
3![[thin space (1/6-em)]](https://www.rsc.org/images/entities/char_2009.gif) :
:![[thin space (1/6-em)]](https://www.rsc.org/images/entities/char_2009.gif) 9 by weight ratio. The mixtures were dispersed in N-methylpyrrolidone (NMP) and coated onto metallic aluminum. The samples were dried at 100 °C in air atmosphere and at 85 °C under a vacuum atmosphere. They were pressed and punched to 16 mm φ to prepare the cathode. 1 mol L−1 LiPF6 in ethylene carbonate
9 by weight ratio. The mixtures were dispersed in N-methylpyrrolidone (NMP) and coated onto metallic aluminum. The samples were dried at 100 °C in air atmosphere and at 85 °C under a vacuum atmosphere. They were pressed and punched to 16 mm φ to prepare the cathode. 1 mol L−1 LiPF6 in ethylene carbonate![[thin space (1/6-em)]](https://www.rsc.org/images/entities/char_2009.gif) :
:![[thin space (1/6-em)]](https://www.rsc.org/images/entities/char_2009.gif) dimethyl carbonate = 1
dimethyl carbonate = 1![[thin space (1/6-em)]](https://www.rsc.org/images/entities/char_2009.gif) :
:![[thin space (1/6-em)]](https://www.rsc.org/images/entities/char_2009.gif) 1 volume% was used as a liquid electrolyte. Metallic lithium was used for the anode. A pouch-type cell was fabricated by assembling the anode, liquid electrolyte, separator, and cathode. Hard XAFS measurement was performed on the cell using a transmission method with a beam lines, BL14B2 and BL16B2 at a synchrotron facility, SPring-8. The ion chambers, I0 and I1 were filled with insert gases of 100% N2 and 80% N2 + 20% Ar. XAFS spectra were obtained at cell voltage before the charge–discharge test and 4.11 V at room temperature at energy range between 8000–9830 eV. XAFS spectra were analyzed to extract valence of Ni and Ni–O bonding distance in NCM523 using the software Athena and Artemis designed to process and analyze XAFS data.50 NCM333 and Li-0.5NCM523 were used as the reference materials of linear fitting analysis.51
1 volume% was used as a liquid electrolyte. Metallic lithium was used for the anode. A pouch-type cell was fabricated by assembling the anode, liquid electrolyte, separator, and cathode. Hard XAFS measurement was performed on the cell using a transmission method with a beam lines, BL14B2 and BL16B2 at a synchrotron facility, SPring-8. The ion chambers, I0 and I1 were filled with insert gases of 100% N2 and 80% N2 + 20% Ar. XAFS spectra were obtained at cell voltage before the charge–discharge test and 4.11 V at room temperature at energy range between 8000–9830 eV. XAFS spectra were analyzed to extract valence of Ni and Ni–O bonding distance in NCM523 using the software Athena and Artemis designed to process and analyze XAFS data.50 NCM333 and Li-0.5NCM523 were used as the reference materials of linear fitting analysis.51
Results and discussion
NCM523 structure and electronic state
The structures of Li1.0-NCM523 and Li0.5-NCM523 are shown in Fig. 1. The atomic configuration of Li at Li0.5-NCM523 uses the most stable configuration obtained via the first-principles molecular dynamics calculation. The lattice constants obtained by the calculation of Li1.0-NCM523 and Li0.5-NCM523 are shown in Table 2. The results show good agreement with the results of other first principle calculations and experimental results. Schematic diagrams of the d electron arrangement of the transition metals Ni, Co, and Mn are shown in Fig. 2. As can be seen from Fig. 2, the valence of Ni, Co, and Mn in NCM523 can be determined by magnetic moment. In Ni, the magnetic moment of Ni2+ is 1.72 μB, Ni3+ is 1.15 μB, and Ni4+ is −0.11 μB. For Co, the magnetic moment of Co3+ is −0.04 μB, Co4+ is −1.32 μB, and Mn4+ is −3.32 μB. When the Li amount is 1.0, the valence state of Ni is Ni2+ and Ni3+; Ni2+ is 63.3%, and Ni3+ is 36.7%. This result agrees well with previous calculation results.9,32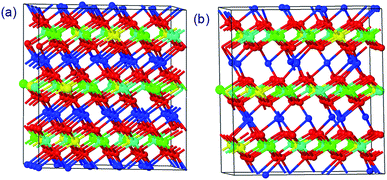 | ||
| Fig. 1 The structures of NCM523 with a Li amount of 1.0 and 0.5. (a) Li = 1.0 (b) Li = 0.5 (red: O, blue: Li, green: Ni, cyan: Mn, yellow: Co). | ||
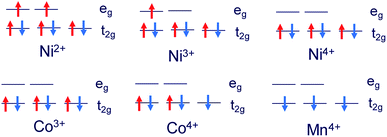 | ||
| Fig. 2 Schematic diagrams of the d electron arrangement of transition metals Ni, Co, and Mn in NCM523. | ||
For Li1.0-NCM523, Ni2+ has 3 nearest Mn4+, Ni3+ has 2 nearest Mn4+, and it was found that the difference in the Ni valence is a result of the number of nearest neighbor Mn. Because Mn is Mn4+, the Ni valence becomes Ni3+ for charge compensation when the number of the closest Mn is large. The valence number of Co was 100% for Co3+ and the valence number for Mn was 100% for Mn4+. In Li0.5-NCM523, the valence state of Ni was 6.6% for Ni2+, 56.7% for Ni3+, and 36.7% for Ni4+. This result also agrees well with the previous calculation results.9,32 In Li0.5-NCM523, a correlation between the Ni valence state and the number of nearest neighbor Mn was not evident. The valence of Co is 83.3% for Co3+ and 16.7% for Co4+, which is partly Co4+, but Mn does not change from 100% Mn4+ at Li1.0-NCM523. The reason that the Ni valence changes from Ni2+/Ni3+ to Ni2+/Ni3+/Ni4+ and the valence of Co changes from Co3+ to Co3+/Co4+ resulting from the decrease in the Li amount is that the state of the valence band maximum is mainly from Ni and Co 3d electrons. Because the d electrons of Mn4+ are in the deep level from the Fermi level, the Mn valence number does not change from Mn4+.9,32 The detailed charge compensation schemes with the change of Li amount are shown in ref. 9.
The oxidation state of Ni in Li1.0-NCM523 was determined to be 2.37 using the Ni2+ ratio of 63.3% and the Ni3+ ratio of 36.7%. On the other hand, the oxidation state of Ni in Li0.5-NCM523 was determined to be 3.30 using the Ni2+ ratio of 6.6%, the Ni3+ ratio of 56.7%, and the Ni4+ ratio of 36.7%. In the experiment, the oxidation state can be determined by linear combination fitting of the XANES spectra of reference materials.50,51 When the spectrum of Li1.0-NCM523 was linearly fitted using the XANES spectra of the experiments of Li0.5-NCM523 and Li1.0-NCM333 as reference spectra, it was determined the ratio as Li1.0-NCM333![[thin space (1/6-em)]](https://www.rsc.org/images/entities/char_2009.gif) :
:![[thin space (1/6-em)]](https://www.rsc.org/images/entities/char_2009.gif) Li0.5-NCM523 = 0.775
Li0.5-NCM523 = 0.775![[thin space (1/6-em)]](https://www.rsc.org/images/entities/char_2009.gif) :
:![[thin space (1/6-em)]](https://www.rsc.org/images/entities/char_2009.gif) 0.225. Assuming that the oxidation state of Li1.0-NCM333 is +2.00 and the oxidation state of Li0.5-NCM523 is +3.30, the oxidation state of Li1.0-NCM523 is determined 2.29 using a ratio of 0.775
0.225. Assuming that the oxidation state of Li1.0-NCM333 is +2.00 and the oxidation state of Li0.5-NCM523 is +3.30, the oxidation state of Li1.0-NCM523 is determined 2.29 using a ratio of 0.775![[thin space (1/6-em)]](https://www.rsc.org/images/entities/char_2009.gif) :
:![[thin space (1/6-em)]](https://www.rsc.org/images/entities/char_2009.gif) 0.225. This shows a good agreement with the calculated oxidation state of 2.37.
0.225. This shows a good agreement with the calculated oxidation state of 2.37.
The calculated bond length of Ni, Co, and Mn to O in NCM523 with Li1.0-NCM523 and Li0.5-NCM523 are shown in Table 3. In the case of Ni2+ with a Li amount 1.0, all six coordinates have bonding length longer than 2 Å. Ni2+/Ni4+, Co3+/Co4+, and Mn4+ are inactive for the Jahn–Teller distortion, but Ni3+ is active. In Ni3+, the occupation of eg and the degeneracy of the occupied and unoccupied levels can be resolved and the two bonds lengthen, such that the four bonds are shorter than 2 Å, whereas the two bonds are longer than 2 Å.38,39 In the case of Ni4+ with a Li amount of 0.5, all six bonds are shortened to approximately 1.9 Å; it is understood that the bond shortens as the Ni valence increases. Co3+/Co4+ and Mn4+ are all inactive for Jahn–Teller distortion, and six bonds are shorter than 2 Å.
| Li 1.0 | Ni2+ | 2.04 | 2.04 | 2.05 | 2.06 | 2.07 | 2.09 |
| Ni3+ | 1.92 | 1.92 | 1.92 | 1.97 | 2.07 | 2.09 | |
| Co3+ | 1.92 | 1.93 | 1.95 | 1.95 | 1.96 | 1.96 | |
| Mn4+ | 1.92 | 1.94 | 1.95 | 1.95 | 1.96 | 1.96 | |
| Li/Ni | Ni2+(NiLi) | 2.02 | 2.05 | 2.05 | 2.08 | 2.10 | 2.15 |
| Li0.5 | Ni2+ | 1.97 | 2.00 | 2.02 | 2.02 | 2.07 | 2.08 |
| Ni3+ | 1.89 | 1.92 | 1.93 | 1.94 | 2.08 | 2.08 | |
| Ni4+ | 1.86 | 1.86 | 1.88 | 1.89 | 1.89 | 1.91 | |
| Co3+ | 1.91 | 1.91 | 1.91 | 1.92 | 1.94 | 1.96 | |
| Co4+ | 1.84 | 1.89 | 1.90 | 1.90 | 1.94 | 1.97 | |
| Mn4+ | 1.90 | 1.93 | 1.94 | 1.96 | 1.96 | 1.99 | |
| Li/Ni | Ni2+(NiLi) | 2.05 | 2.06 | 2.07 | 2.09 | 2.12 | 2.21 |
We analyzed the bond distance of Ni–O from experiments by assuming six-coordinate oxygen around Ni by EXAFS. The bonding distance of Ni–O in Li1.0-NCM523 was 2.04 Å, and the bonding distance of Li0.5-NCM523Ni–O was 1.90 Å, which showed good agreement with the calculation results.
XANES spectrum of the Ni K-edge in NCM523
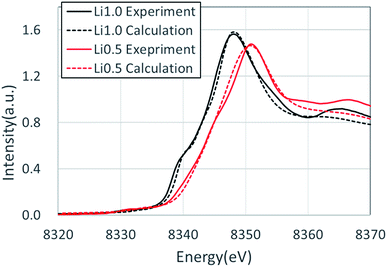
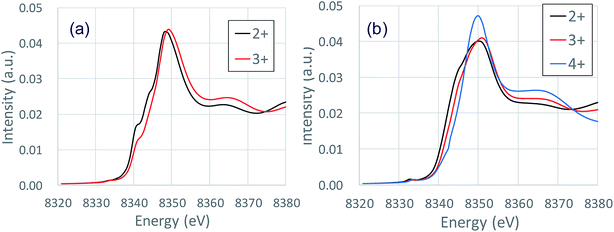
Fig. 3 shows the XANES spectra of the Ni K-edge of Li1.0-NCM523 and Li0.5-NCM523 via experiment and calculation. The XANES spectrum of the calculation is a superposition of spectra of all 30 Ni atom spectra in the supercell. The energy of the calculation spectrum shifts adjusting to the experimental spectrum. The spectra obtained via calculation for both Li1.0-NCM523 and Li0.5-NCM523 agree well with the experimental spectrum. This indicates that the ratio of Ni valence, bonding state, and coordination environment in the structure of NCM523 obtained by calculation well reproduces the experiment. In addition, XANES spectrum calculation by finite difference method using this structure is useful for analysis of such information. Because the spectrum of each Ni atom is calculated in the XANES spectrum simulation, the Ni Ni2+/Ni3+/Ni4+ spectrum can be individually shown. It is an advantage of calculation that information on the difference of valence and coordination environment can be obtained by calculating the spectrum of Ni2+/Ni3+/Ni4+ respectively. The K-edge spectra of Ni Ni2+/Ni3+/Ni4+ of NCM523 are shown in Fig. 4. In Li1.0-NCM523, the absorption edge and peak of Ni3+ are shifted to a higher energy than that of Ni2+. Furthermore Ni2+ has two shoulder peaks at the absorption edge whereas Ni3+ has one peak. The spectrum of Li1.0-NCM523 in the experiment is a superposition of absorption by all of the Ni atoms. At the Li amount of 0.5, the peak of the absorption edge shoulder is large in the Ni2+ spectrum. As the Ni valence increases, the absorption edge shoulder peak decreases and the absorption edge shifts to a higher energy.The Ni K-edge transitions from the 1s core electron to the conduction band 4p electron; the partial density of the state of the p electrons of Ni Ni2+/Ni3+/Ni3+ and the nearest Li, O, Mn, and Co at Li0.5-NCM523 are shown in Fig. 5. The peak of the XANES spectrum at approximately 8350 eV in Fig. 4 corresponds to the peak of the density of the states at approximately 18 eV in Fig. 5. Because there is a state density peak of the p electrons of Co and Mn at approximately 28 eV, it can be understood that this main peak is caused by hybridization of Ni p electrons with the nearest Ni, Mn, and Co p electrons. As the Ni valence increases from Ni2+ to Ni3+ and Ni3+, the size of the peak of the shoulder at approximately 18, 22, and 25 eV decreases. Fig. 5d shows the partial density of the state of the Ni p electrons of Ni3+ and the px, py, and pz electrons of Li. Because the z direction is the direction between the layers, pz electrons represent the bond between Li and Ni. The shoulder peaks at 8, 12, and 15 eV show large pz electron states for Li, indicating that these peaks are caused by hybridization of Ni p electrons and Li pz electrons. Because Ni3+ and Ni4+ have a short bond length with oxygen increasing the bond strength, hybridization with Li pz electrons is relatively decreased and the shoulder peak decreased.
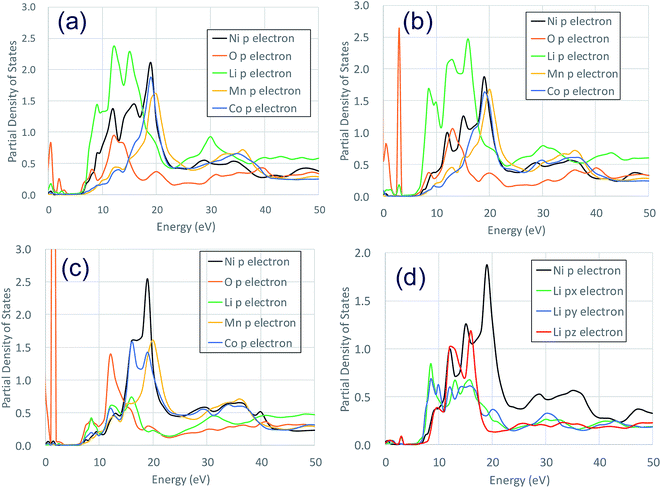 | ||
| Fig. 5 Partial density of the states of p electrons of Ni2+/Ni3+/Ni4+ and nearest Li, O, Mn, and Co at a Li amount 0.5 in NCM523: (a) Ni2+ (b)Ni3+ (c) Ni4+ (d) Ni2+ Li px, py, pz, electron. | ||
Li/Ni cation mixing
In NCM, Li/Ni cation mixing of in which Ni enters the Li site (NiLi) tends to occur as the Ni amount increases. The ratio of Li/Ni cation mixing is 8.7(6)% for NCM 613, 3.34% for NCM523, 2.97% for NCM424, and 1.56% for NCM333.6,35 In the NiLi K-edge of the XANES spectrum in Li0.89Ni1.11O2 with 11% Li/Ni cation mixing, a shift of the absorption edge does not occur and the Ni valence does not change when the Li amount decreases.54 The formation energies of Li/Ni, Li/Co, Li/Mn cation mixing in NCM523 are shown in Table 4. The formation energies of Li/Co and Li/Mn cation mixing are larger than that of Li/Ni. This shows Li/Ni cation mixing is more likely to occur than Li/Co and Li/Mn cation mixing. In Li1.0-NCM523, the formation energy of Li/Ni cation mixing is smaller than 0.4 eV; the formation energy in Li/Ni2+ is very small at 0.03 eV. As a result, it was found that Li/Ni cation mixing tends to occur more easily in Ni2+ than in Ni3+. However, the formation energy of the Li/Ni cation mixing at a Li amount 0.5 is as large as 0.7 eV, which shows that Li1.0-NCM523 more readily allows for Li/Ni cation mixing than Li0.5-NCM523. This is consistent with the experimental result that Li/Ni cation mixing occurs when the amount of Li is large.5 The formation energies of the site exchange between Ni and Li vacancies for the Li amount of 0.5 is larger than 2.50 eV, thus exchange with Li vacancies hardly occurs. NiLi was stable in Ni2+ antiferromagnetism. For Li/Ni cation mixing in NCM, it has been reported that Ni2+ antiferromagnetism is stable because of the super exchange interaction in NCM333, NCM424, NCM505, NCM622, and NCM71515 where the amounts of Ni and Mn are the same.16 In the case of NCM523, such as NCM, the 180° arrangement of the antiferromagnetic Ni2+–O–Ni2+ is stabilized by a strong super exchange interaction.| Ni2+ | Ni3+ | Ni4+ | |
|---|---|---|---|
| NCM523-Li 1.0 Li/Ni | 0.03–0.38 | 0.24–0.40 | — |
| NCM523-Li 0.5 Li/Ni | 0.72–1.11 | 0.95–1.29 | 0.66–1.52 |
| NCM523-Li 0.5 vacancy/Ni | 2.50–2.94 | 3.52–0.3.77 | 2.92–4.57 |
| Co2+ | Mn4+ | |
|---|---|---|
| NCM523-Li 1.0 Li/Co or Mn | 1.27–1.65 | 1.49–1.89 |
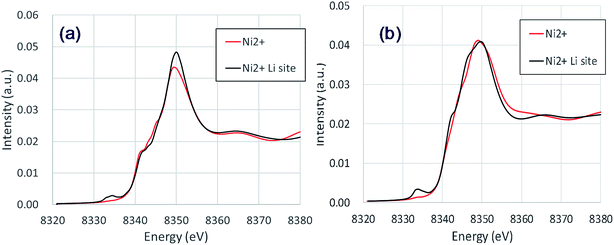
The NiLi K-edges of the XANES spectra of NCM523 are shown in Fig. 6. As shown in Table 3, the bond length between NiLi and O are longer than 2 Å, approximately the same as the bond length of Ni and O for Ni2+ at Ni site (NiNi2+). The NiLi2+ K-edge spectrum at Li1.0-NCM523 nearly agrees with the shape of the NiNi2+ spectrum, but a pre-edge peak is observed at approximately 8335 eV. The NiLi2+ K-edge spectrum at a Li amount of 0.5 was consistent with the NiNi2+ K-edge spectrum for the main peak, but the shape of the shoulder was different. This was because the bonding state with Li is different. The NiLi2+ K-edge spectrum at a Li amount of 0.5 also has a peak at the pre-edge. Partial density of the states of p electrons of NiLi and nearest O of Li0.5-NCM523 in pre-edge region were shown in Fig. S2.† It can be understood that pre-edge peak is caused by hybridization of Ni p electrons with the nearest O p electrons. The small peak at the pre-edge around 8330 eV in the experimental XANES spectrum of Fig. 3 is considered to be due to the occurrence of Li/Ni cation mixing.
Conclusions
Simulation of the Ni K-edge XANES spectra in NCM523 was performed. The structure of NCM523 was optimized by first-principles calculation based on density functional theory and performed XANES spectrum simulation via finite difference method. The Ni K-edge XANES spectral shape of Li1.0-NCM523 and Li0.5-NCM523 via calculation agreed well with the experiment. The bond between Ni and O shortened as the Ni valence increased. Distortion of the structure resulting from Jahn–Teller distortion was observed with Ni3+. The XANES spectra of the Ni K-edge of Ni2+, Ni3+, and Ni4+ were calculated. In Li1.0-NCM523, Ni3+ shifts towards the higher energy side compared to that of Ni2+, and at Li0.5-NCM523, the absorption edge of Ni2+, Ni3+, and Ni4+ shifts toward a higher energy as valence increases. Even at the same Ni valence number, the XANES spectrum shape is different in Li1.0-NCM523 and Li0.5-NCM523. The main peak is influenced by hybridization between Ni p and transition metal p electrons, and the shoulder peak is a result of the influence of hybridization between Ni p and Li p electrons. Li/Ni cation mixing more readily occurs at Li1.0-NCM523 compared to Li0.5-NCM523 because of the super exchange interaction. Li/Ni cation mixing becomes antiferromagnetic to Ni2+; the NiLi2+ K-edge XANES spectrum did not change the position of the absorption edge of NiLi2+. A difference in the shape of the shoulder and the pre-edge peaks appeared. From these results, the Ni valence, bonding state, and the effect of Li/Ni cation mixing on the Ni K-edge XANES spectrum in NCM523 were clarified.Conflicts of interest
The authors declare no conflicts of interest associated with this manuscript.Acknowledgements
The synchrotron X-ray absorption near-edge structure measurements were performed with the approval of the Japan Synchrotron Radiation Research Institute (JASRI) Program Advisory Committee (Proposal No. 2014A5570, 2014B5570, 2015A5570, 2015B5570, 2016A1567, 2016A5570, 2016B5570, 2018A1596, 2018A5570, 2018B1593, 2018B5570, and 2019A1818, 2019A5570).References
- J. M. Tarascon and M. Armand, Nature, 2001, 414, 359–367 CrossRef CAS.
- M. Armand and J. M. Tarascon, Nature, 2008, 451, 652–657 CrossRef CAS.
- V. Etacheri, R. Marom, R. Elazari, G. Salitra and D. Aurbach, Energy Environ. Sci., 2011, 4, 3243–3262 RSC.
- G. Ceder, MRS Bull., 2010, 35, 693–701 CrossRef CAS.
- O. Dolotko, A. Senyshyn, M. J. Mühlbauer, K. Nikolowski and H. Ehrenberg, J. Power Sources, 2014, 255, 197–203 CrossRef CAS.
- C. Julien, A. Mauger, K. Zaghib and H. Groult, Materials, 2016, 9, 595 CrossRef.
- J.-M. Kim and H.-T. Chung, Electrochim. Acta, 2004, 49, 937–944 CrossRef CAS.
- Y.-J. Gu, Y.-B. Chen, H.-Q. Liu, Y.-M. Wang, C.-L. Wang and H.-K. Wu, J. Alloys Compd., 2011, 509, 7915–7921 CrossRef CAS.
- M. Dixit, M. Kosa, O. S. Lavi, B. Markovsky, D. Aubach and D. T. Major, Phys. Chem. Chem. Phys., 2016, 18, 6799 RSC.
- Y. Koyama, I. Tanaka, H. Adachi, Y. Makimura and T. Ohzuku, J. Power Sources, 2003, 119–121, 644–648 CrossRef CAS.
- B. J. Hwang, Y. W. Tsai, D. Carlier and G. Ceder, Chem. Mater., 2003, 15, 3676–3682 CrossRef CAS.
- E. Björklund, D. Brandell, M. Hahlin, K. Edström and R. Younesi, J. Electrochem. Soc., 2017, 164, A3054–A3059 CrossRef.
- A. Deb, U. Bergmann, S. P. Cramer and E. J. Cairns, J. Appl. Phys., 2005, 97, 11523 CrossRef.
- A. Deb, U. Bergmann, S. P. Cramer and E. J. Cairns, J. Electrochem. Soc., 2007, 154, A534–A541 CrossRef CAS.
- J. Wandt, A. Freiberg, R. Thomas, Y. Gorlin, A. Siebel, R. Jung, H. A. Gasteigera and M. Tromp, J. Mater. Chem. A, 2016, 4, 18300 RSC.
- J. Zheng, G. Teng, C. Xin, Z. Zhuo, J. Liu, Q. Li, Z. Hu, M. Xu, S. Yan, W. Yang and F. Pan, J. Phys. Chem. Lett., 2017, 8, 5537–5542 CrossRef CAS.
- J. Bréger, Y. S. Meng, Y. Hinuma, S. Kumar, K. Kang, Y. S. Horn, G. Ceder and C. P. Grey, Chem. Mater., 2006, 18, 4768–4781 CrossRef.
- P. Y. Liao, J. G. Duh, J. F. Lee and H. S. Sheu, Electrochim. Acta, 2007, 53, 1850 CrossRef CAS.
- Y. J. Park, M. G. Kim, Y. S. Hong, X. Wu, K. S. Ryu and S. H. Chang, Solid State Commun., 2003, 127, 509 CrossRef CAS.
- M. G. Kim, H. J. Shin, J. H. Kim, S. H. Park and Y. K. Sun, J. Electrochem. Soc., 2005, 152, A1320–A1328 CrossRef CAS.
- R. Marom, S. F. Amalraj, N. Leifer, D. Jacob and D. Aurbach, J. Mater. Chem., 2011, 21, 9938–9954 RSC.
- Z. Li, N. A. Chernova, M. Roppolo, S. Upreti, C. Petersburg, F. M. Alamgir and M. S. Whittingham, J. Electrochem. Soc., 2011, 158, A516–A522 CrossRef CAS.
- H. Yu and H. Zhou, J. Phys. Chem. Lett., 2013, 4, 1268–1280 CrossRef CAS.
- S. M. Bak, E. Hu, Y. Zhou, X. Yu, S. D. Senanayake, S. J. Cho, K. B. Kim, K. Y. Chung, X. Q. Yang and K. W. Nam, ACS Appl. Mater. Interfaces, 2014, 6, 22594–22601 CrossRef CAS.
- R. Xu, H. Sun, L. S. de Vasconcelos and K. Zhao, J. Electrochem. Soc., 2017, 164, A3333–A3341 CrossRef CAS.
- H. Yu, Y. Qian, M. Otani, D. Tang, S. Guo, Y. Zhu and H. Zhon, Energy Environ. Sci., 2014, 7, 1068–1078 RSC.
- S.-K. Jung, H. Gwon, J. Hong, K.-Y. Park, D.-H. Seo, H. Kim, J. Hyun, W. Yang and K. Kang, Adv. Energy Mater., 2014, 4(1), 1300787, DOI:10.1002/aenm.201300787.
- M. Dixit, B. Markovsky, D. Aurbach and D. T. Major, J. Electrochem. Soc., 2017, 164(1), A6359–A6365 CrossRef CAS.
- J. Zheng, T. Liu, Z. Hu, Y. Wei, X. Song, Y. Ren, W. Wang, M. Rao, Y. Lin, Z. Chen, J. Lu, C. Wang, K. Amine and F. Pan, J. Am. Chem. Soc., 2016, 138, 13326–13334 CrossRef CAS.
- H. Sun and L. Zhao, J. Phys. Chem. C, 2017, 121, 6002–6010 CrossRef CAS.
- Y. Wei, J. Zheng, S. Cui, X. Song, Y. Su, W. Deng, Z. Wu, X. Wang, W. Wang, M. Rao, Y. Lin, C. Wang, K. Amine and F. Pan, J. Am. Chem. Soc., 2015, 137, 8364–8367 CrossRef CAS.
- H. Sun and K. Zhao, J. Phys. Chem. C, 2017, 121, 6002–6010 CrossRef CAS.
- M. D. Radin, S. Hy, M. Sina, C. Fang, H. Liu, J. Vinckeviciute, M. Zhang, M. S. Whittingham, Y. S. Meng and A. Van der Ven, Adv. Energy Mater., 2017, 7, 1602888 CrossRef.
- J. K. Ngala, N. A. Chernova, L. Matienzo, P. Y. Zavalij and M. S. Whittingham, Mater. Res. Soc. Symp. Proc., 2003, 756, 231–236 CAS.
- A. Manthiram, J. C. Knight, S. T. Myung, S. M. Oh and Y. K. Sun, Adv. Energy Mater., 2016, 6, 1501010 CrossRef.
- A. Juhin, F. De Groot, G. Vankó, M. Calandra and C. Brouder, Phys. Rev. B: Condens. Matter Mater. Phys., 2010, 81, 115115 CrossRef.
- Y. Koyama, H. Arai, Z. Ogumi, I. Tanaka and Y. Uchimoto, Phys. Rev. B: Condens. Matter Mater. Phys., 2012, 83, 075129 CrossRef.
- T. Tamura, T. Ohwaki, A. Ito, Y. Ohsawa, R. Kobayashi and S. Ogata, Modell. Simul. Mater. Sci. Eng., 2012, 20, 045006 CrossRef.
- K. Kubouchi, M. Mogi, M. Matsumoto, T. Baba, C. Yogi, C. Sato, T. Yamamoto, T. Mizoguchi and H. ImaiJ, J. Appl. Phys., 2016, 120, 142125 CrossRef.
- T. Tamura, M. Kohyama and S. Ogata, Phys. Rev. B, 2017, 96, 035107 CrossRef.
- J. Shirakawa, M. Nakayama, Y. Uchimoto and M. Wakihara, Electrochem. Solid-State Lett., 2006, 9, A200–A202 CrossRef CAS.
- O. Bunau and Y. Joly, J. Phys.: Condens. Matter, 2009, 21, 345501 CrossRef CAS.
- O. Šipr, W. Khan, Y. Joly and J. MinárJ, J. Synchrotron Radiat., 2019, 26, 152–158 CrossRef.
- G. Kresse and J. Furthmüller, Comput. Mater. Sci., 1996, 6, 15–50 CrossRef CAS.
- G. Kresse and D. Joubert, Phys. Rev. B: Condens. Matter Mater. Phys., 1999, 59, 1758–1775 CrossRef CAS.
- S. Dudarev, G. Botton, S. Savrasov, C. Humphreys and A. Sutton, Phys. Rev. B: Condens. Matter Mater. Phys., 1998, 57, 1505–1509 CrossRef CAS.
- P. Perdew, K. Burke and M. Ernzerhof, Phys. Rev. Lett., 1996, 77, 3865–3868 CrossRef.
- H. J. Monkhorst and J. D. Pack, Phys. Rev. B: Solid State, 1976, 13, 5188 CrossRef.
- T. Kobayashi, Y. Kobayashi and H. Miyashiro, J. Mater. Chem. A, 2017, 5, 8653–8661 RSC.
- D. Aurbach, O. Srur-Lavi, C. Ghanty, M. Dixit, O. Haik, M. Talianker, Y. Grinblat, N. Leifer, R. Lavi, D. T. Major, G. Goobes, E. Zinigrad, E. M. Erickson, M. Kosa, B. Markovsky, J. Lampert, A. Volkov, J.-Y. Shin and A. Garsuch, J. Electrochem. Soc., 2015, 162, A1014–A1027 CrossRef CAS.
- J. Z. Kong, X. Y. Yang, H. F. Zhai, C. Ren, H. Li, J. X. Li, Z. Tang and F. Zhou, J. Alloys Compd., 2013, 580, 491–496 CrossRef CAS.
- B. Ravel and M. Newville, Phys. Scr., 2005, 115, 1007–1010 CrossRef.
- T. E. Conry, A. Mehta, J. Cabana and M. M. Doeff, J. Electrochem. Soc., 2012, 159, A1562–A1571 CrossRef CAS.
- T. Kawaguchi, K. Fukuda, K. Tokuda, M. Sakaida, T. Ichitsubo, M. Oishi, J. Mizuki and E. Matsubara, Phys. Chem. Chem. Phys., 2015, 17, 14064–14070 RSC.
Footnote |
| † Electronic supplementary information (ESI) available. See DOI: 10.1039/c9ra03606g |
| This journal is © The Royal Society of Chemistry 2019 |

