 Open Access Article
Mesoporous NiCo2O4 nanoflower constructed from nanosheets as electroactive materials for dye-sensitized solar cells†
Fengxia Yanga,
Xueli Tiana,
Yanru Guc,
Keqiang Zhang*a and
Lu Liu *b
*b
aAgro-Environmental Protection Institute, Ministry of Agriculture and Rural Affairs, Tianjin 300191, China. E-mail: keqiangzhang68@163.com
bTianjin Key Laboratory of Environmental Remediation and Pollution Control, College of Environmental Science and Engineering, Nankai University, Tianjin 300071, P. R. China. E-mail: liul@nankai.edu.cn
cCollege of Resources and Environment, Northeast Agricultural University, Haerbin 150036, China
First published on 12th August 2019
Abstract
Binary metal compounds with a spinel structure could improve the electron transport, activating adsorption and active sites for electrocatalytic reaction. Furthermore, the electrocatalytic activity of electroactive materials also depends on their morphology and nanostructure. Herein, this work reported the fabrication of NiCo2O4 mesoporous nanoflowers and mesoporous nanospheres and their application as promising counter electrode (CE) electrocatalysts in dye-sensitized solar cells (DSSCs). The as-prepared NiCo2O4 mesoporous nanoflower contains abundant open space between nanosheets, generating the 3D porous nanostructure. When investigated as CE materials, NiCo2O4 nanoflowers exhibited high charge-transfer ability and intrinsic catalytic activity. The DSSC with NiCo2O4 nanoflowers displayed a much higher power conversion efficiency (PCE) of 7.32% than that based on the NiCo2O4 nanosphere CE (PCE = 5.58%), even comparable with that of commercial Pt CE (7.54%).
1. Introduction
Dye-sensitized solar cells (DSSCs) have received intensive attention as potential candidates for next-generation solar cells, since the significant breakthrough in 1991.1–4 As a crucial component of DSSCs, counter electrodes (CEs) play a vital role in obtaining outstanding photovoltaic performance.5,6 Typically, an efficient CE requires high electrical conductivity, superior catalytic activity and large specific surface area, for its functions of collecting electrons from the external circuit and catalyzing the injecting electrons into the electrolyte to reduce the redox species.7,8 Traditionally, platinum (Pt) and its alloys have been widely employed as CE electrocatalysts due to its superior electrocatalytic activity. However, the high cost and corrosion risk of Pt and its alloys are significant limitations to the large-scale commercialization of DSSCs technology. Therefore, to overcome these challenges and to potentially develop high-performance electrocatalysts, constructing non-noble metal catalysts with electrocatalytically active nanostructures has been growing intensively and has received great interest.9–11Cobalt and nickel-based chalcogenides have been found to be competitive CE electrocatalysts due to the intrinsic catalytic activity of cobalt and nickel for the reduction reaction of I3− to I−. Among them, sulfides and selenides of cobalt and nickel are one of the most prominent electrocatalysts to substitute Pt CE.5,12–14 For example, Liu's group and Yu's group demonstrated the excellent electrocatalytic performance of nickel selenides and cobalt selenides, they boosted the power conversion efficiency (PCE) of Co0.85Se, CoSe, Ni0.85Se and NiSe–Ni3Se2 to 8.30%, 7.75%, 7.82% and 7.87%, respectively.15–18 However, little study and progress has been achieved to explore cobalt and nickel oxides with high performance as CE electrocatalysts of DSSC. The problems associated with them are low electrical conductivity and lack of adsorption sites in their bulk form, which severely limit their performance in electrocatalytic reactions.19,20 Binary metal compounds with spinel structure have been investigated to enhance the electron transport and improve the activating adsorption. Recently bimetallic sulfides and selenides, such as NiCo2S4, NixCoySe and Ni0.5Fe0.5S2, have been developed for potential CE materials applications.21–23 Nonetheless, the design and application of binary metal oxides based on cobalt and nickel as high-performance CE electrocatalysts in DSSC is still rare.
As one of the bimetallic oxides with spinel structure, NiCo2O4 possess larger total ratio of Co3+ + Ni3+ to Co2+ + Ni2+ than that in single-phase nickel or cobalt oxides, and trivalent species in the spinel metal oxides are considered to be active sites for electrocatalytic reaction.24–26 On the other hand, NiCo2O4 possesses much better electrical conductivity, at least two orders of magnitude higher than single-phase nickel or cobalt oxides.27,28 Furthermore, the electrocatalytic activity of CE materials also depends on their morphology and nanostructure. In this work, NiCo2O4 (NCO) with favorable mesoporous structure was fabricated and applied as effective CE electrocatalysts of DSSC. Due to the attractively structural features of mesoporous nanoflower constructed from nanosheets, NCO nanoflower exhibited better charge-transfer ability and higher catalytic performance for reduction reaction of I3−/I− redox than NCO nanosphere assembled from nanoparticles. Especially, the power conversion efficiency (PCE = 7.32%) of NCO nanoflower was expressively higher than that of DSSCs based on NCO nanosphere CE (PCE = 5.58%), which was comparable to Pt CE (7.54%). This study indicated that NCO materials can be considered as a promising CE electrocatalysts to substitute the conventional Pt.
2. Experimental section
2.1 Synthesis of NCO nanoflower
In a typical synthesis, 20 ml deionized water and 20 ml ethanol are mixed and added to a Teflon-lined autoclave with a capacity of 50 ml. Then 2 mmol nickel chloride hexahydrate, 4 mmol cobalt chloride hexahydrate and 6 mmol hexamethylenetetramine was added into the above mixed solution. After stirring for about 30 min to form a homogenization, the autoclave was sealed and heated at 120 °C for 15 h. After reaction, the autoclave was naturally cooled to room temperature. The resulting precipitates were filtered and washed with deionized water and absolute ethanol, and finally dried in oven at 60 °C. After calcining the collected precursor at 400 °C for 1 h in air, the black final product was obtained.2.2 Synthesis of NCO nanosphere
NCO nanosphere was synthesized through the similar solvothermal method with NCO nanoflower. Several different details were listed as follows: the reaction solvent was mixed with 20 ml macrogol 400 and 20 ml ethylene glycol; nickel source and cobalt source were 0.5 g nickel acetate tetrahydrate and 1 g cobalt acetate tetrahydrate; 0.5 g ethylenediaminetetraacetic acid and 1 g NaOH replaced hexamethylenetetramine; reaction temperature and duration were changed to 180 °C for 20 h.2.3 Assembly of DSSCs
CE materials slurry was made in ethanol by mixing 0.1 g CE materials powder with 0.025 g PEG20000 which was used as dispersant as well as binder and stirred continuously. Then a film was made through using a doctor-blade to wipe CE materials slurry on FTO conductive glass (LOF, TEC-15, 15 W per square). After the film was steady, the conductive glass with film was heated at 400 °C for 1 h under the protection of argon, and the counter electrode with 0.25 cm2 effective area was gotten.A commercial TiO2 sol (Solaronix, Ti-Nanoxide T/SP) was used to prepare the TiO2 film on FTO also through the doctor-blade method, and the film was soaked in an N719 dye solution (in ethanol) for 24 h to obtain dye-sensitized TiO2 electrodes. DSSCs were assembled by injecting the electrolyte into the aperture between the dye-sensitized TiO2 electrode and the counter electrode. The liquid electrolyte composed of 0.05 M I2, 0.1 M LiI, 0.6 M 1,2-dimethyl-3-propylimidazolium iodide (DMPII), and 0.5 M 4-tert-butyl pyridine with acetonitrile as the solvent. Surlyn 1702 was used as the spacer between the two electrodes. The two electrodes were clipped together and solid paraffin was used as the sealant to prevent the electrolyte solution from leaking. The standard Pt CE was purchased from Dalian Heptachroma Solar Tech. Co., Ltd.
2.4 Electrochemical characterizations
All the electrochemical measurements were measured with the Zahner IM6 electrochemical workstation. Photocurrent–voltage curves were conducted in simulated AM 1.5 illumination (100 mW cm−2, Trusttech CHF-XM-500W) with a Keithley digital source meter (Keithley 2410, USA). Electrochemical impedance spectra (EIS) analysis was conducted at zero bias potential and the impedance data covered a frequency range of 0.1 Hz to 1 MHz. The amplitude of the sinusoidal AC voltage signal was 5 mV. The analyses of the resulting impedance spectra were conducted using the software Zview 2.0. Tafel-polarization measurements were employed in a symmetrical dummy cell which was used in the EIS experiments. The electrolyte was as the same of the electrolyte of DSSC. The scan rate was 20 mV s−1, and the voltage range is −1.0 to 1.0 V. Cyclic voltammetry (CV) was recorded with a three electrodes system on the electrochemical workstation. Pt was used as the counter electrode, and Ag/AgCl was used as the reference electrode. A solution of 10.0 mM LiI, 1.0 mM I2, and 0.1 M LiClO4 in acetonitrile served as the electrolyte.2.5 Other characterizations
The crystallinity and composition of the samples were characterized by X-ray diffraction (XRD, D/max-2500, Japan Science) with Cu Kα radiation (λ = 1.54056 Å). The morphology of samples was studied by field-emission scanning electron microscopy (FE-SEM, ZEISS MERLIN Compact) equipped with the energy dispersive spectroscopy (EDS) mapping to measure the elements in the samples. More detailed insight into the microstructure of the sample was given by high-resolution transmission electron microscopy (TEM, Tecnai G2 F20, operating at 200 kV, FEI). The Brunauer–Emmett–Teller (BET) specific surface area was analyzed by the BET equation using a Tristar 3000 nitrogen adsorption apparatus. The structural information of sample was then analyzed by using Raman spectra (Renishaw inVia spectrometer, 514.5 nm laser).3. Results and discussion
The structural information and purity of the obtained two NCO products were analyzed by X-ray diffraction (XRD). As shown in Fig. 1a, NCO nanoflower and NCO nanosphere both show obviously sharp peaks. Note that all the peaks in the XRD patterns of two products is in accord with the spinel NiCo2O4 (JCPDS no. 20-0781) and no extra peaks were detected, indicating the high purity of the samples. The diffraction peaks at 18.91°, 31.15°, 36.70°, 38.40°, 44.62°, 55.44°, 59.04° and 64.98° of NCO nanoflower and NCO nanosphere correspond to (111), (220), (311), (222), (400), (422), (511) and (440) of spinel NiCo2O4. In addition, Raman spectra was carried out to further analyze the structural information of the obtained NCO products. NCO nanoflower and NCO nanosphere both shows three intense peaks at 471, 515 and 651 cm−1, corresponding to the Eg, F2g and A1g modes of the NiCo2O4.29 Nitrogen-adsorption/-desorption isotherms were measured to investigate the specific surface area and porous structure of NCO products. Fig. 1c shows the isotherm curve, where NCO nanoflower and NCO nanosphere both show a typical IV with a hysteresis loop, indicating their mesoporous structure. The calculated specific surface area of NCO nanoflower (76.8 m2 g−1) is much higher than that of NCO nanosphere (36.9 m2 g−1), and this is owing to that the NCO nanoflower exhibit a flower-like structure from nanosheets, demonstrated in SEM and TEM. Additionally, the pore size distribution curves of NCO nanoflower in Fig. 1d indicates its maxima at about 2.71 nm and 14.82 nm.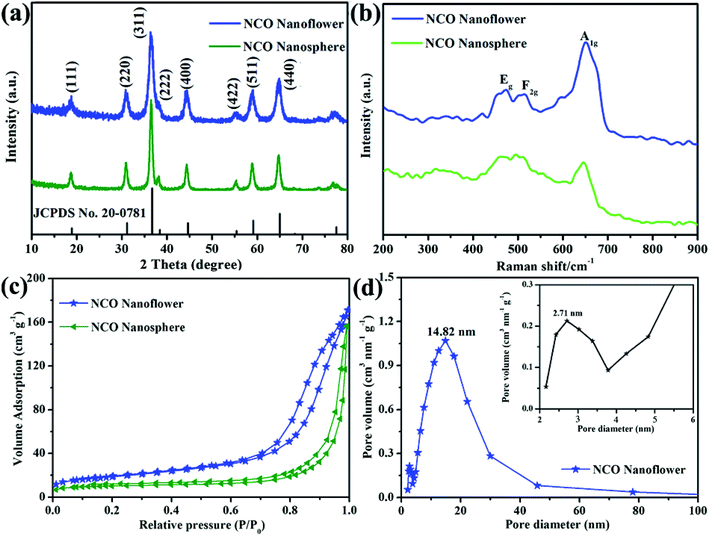 | ||
| Fig. 1 XRD patterns (a), Raman spectra (b), N2 adsorption–desorption isotherm (c) of NCO nanoflower and NCO nanosphere, pore size distribution (d) of NCO nanoflower. | ||
The morphology and microstructure of the obtained NCO products was examined by FESEM (Fig. 2). As shown in Fig. 2b and c that NCO nanoflower possesses the nanosheet structure and the nanosheets joint with each other to form a flower-like morphology, looks like Camellia sasanqua (Fig. 2a). The flower-like NCO products contain abundant open space between nanosheets, generating the 3D porous nanostructure. It is noteworthy that the 3D porous nanostructure is remarkably advantageous for electrocatalytic reaction by decreasing the mass transport resistance and allowing easy access of the electrolyte to the active surface sites.25 NCO nanosphere (Fig. 2e) shows a homogeneous nanosphere structure with average size about 800 nm. Furthermore, the surface (Fig. 2f) of NCO nanospheres is not smooth and composed of many nanoparticles, which looks like glass balls in Fig. 2d.
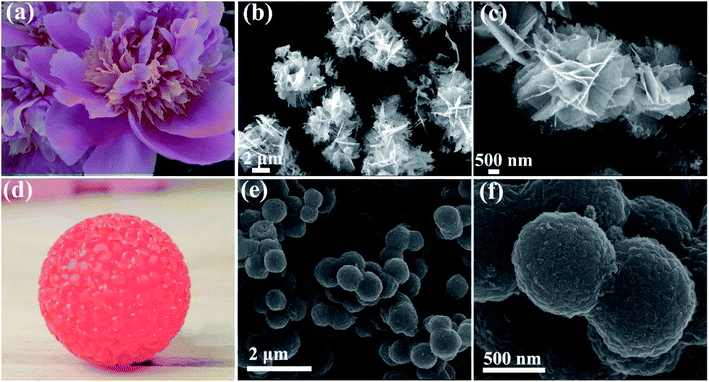 | ||
| Fig. 2 SEM images of NCO nanoflower (b and c) and NCO nanosphere (e and f); (a) and (d) are Camellia sasanqua and glass ball. | ||
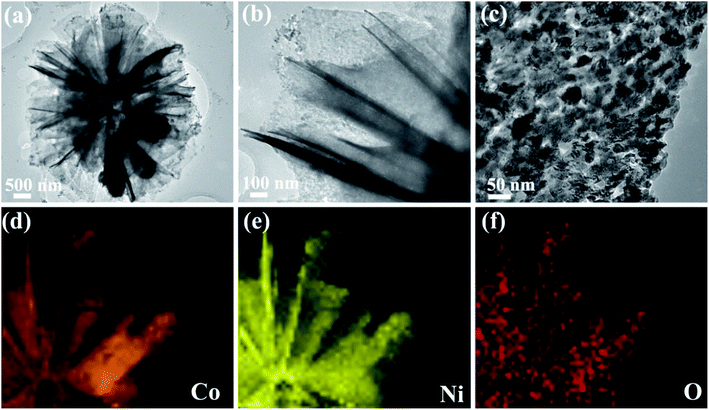
TEM and EDS mapping were applied to observe more structure information of NCO nanoflower and NCO nanosphere. The low magnified TEM image in Fig. 3a reveals that the prepared NCO nanoflower shows a flower-like nanostructure fabricated with nanosheets, which is in agreement with the SEM observations from Fig. 2c. The high-resolution TEM images in Fig. 3b and c clearly shows that abundant nanoholes distributed uniformly on the surface of nanosheets. The EDS mapping (Fig. 3d–f) of NCO nanoflower in the whole selected area (Fig. S1†) indicates the even distribution of Co, Ni, and O, suggesting the successful synthesis of NiCo2O4 structure and also proving the purity of prepared samples. More detailed TEM observations of CO nanoflower and NCO nanosphere are shown in ESI.†
To investigate the properties of various CE materials for collecting the electron from external circuit and charge transfer at the electrode/electrolyte interface, EIS measurements were carried out with a symmetric sandwich-like structure (CE/electrolyte/CE). In the Nyquist plots (Fig. 4) of NCO nanoflower, NCO nanosphere and Pt CEs, series resistance (Rs) obtained from the intercept on the real axis in the high-frequency region represents the interfacial resistance between CE materials and the FTO conducting glass substrate, while the high frequency semicircle denotes the charge-transfer resistance (Rct) inside CE materials and at the CE materials/electrolyte interface. As listed in Table 1, the lower Rs value of NCO nanoflower (15.09 Ω cm2) than NCO nanosphere (16.87 Ω cm2) indicates its better ability for the collection of electrons from external circuit. Due to the main functions of CE materials are collecting the electron from external circuit, transferring electron to electrolyte molecules at the electrode/electrolyte interface and catalyze the reduction of electrolyte molecules. Rct value is a very important factor to estimate the electrocatalytic activity of CE materials. The mesoporous structure of NCO nanoflower increased the contact area between NCO nanoflower CE and electrolyte, deservedly promoted efficient ion transportation.16,30 Thus, the Rct value of NCO nanoflower (5.78 Ω cm2) is much lower than NCO nanosphere (48.15 Ω cm2), just slightly higher than Pt CE (1.79 Ω cm2), implying the high electrocatalytic activity for the reduction of I3− and the fast charge transfer in CE system.31
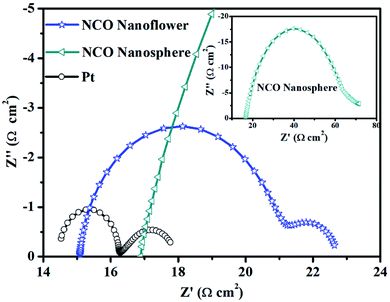 | ||
| Fig. 4 Nyquist plots of the symmetric sandwich-like cells based on NCO nanoflower, NCO nanosphere and Pt CEs. | ||
| CEs | Rs (Ω cm2) | Rct (Ω cm2) | Jlim![[thin space (1/6-em)]](https://www.rsc.org/images/entities/char_2009.gif) log (mA cm2) log (mA cm2) |
J0![[thin space (1/6-em)]](https://www.rsc.org/images/entities/char_2009.gif) log (mA cm2) log (mA cm2) |
Epp (mV) | JOx-1 (mA cm−2) |
|---|---|---|---|---|---|---|
| NCO nanoflower | 15.09 | 5.78 | 1.80 | 0.62 | 596 | 2.13 |
| NCO nanosphere | 16.87 | 48.15 | 1.74 | 0.31 | 727 | 1.92 |
| Pt | 14.46 | 1.79 | 1.84 | 0.75 | 496 | 2.24 |
Tafel polarization was performed with the same symmetric cells used in the EIS measurement to investigate the catalytic activity and diffusion coefficient for the reduction of I3− of the NCO nanoflower, NCO nanosphere and Pt CEs. As shown in Fig. 5, the limiting diffusion current density (Jlim) can be obtained at the intersection of the cathodic branch with the y-axis in the diffusion zone, additionally, the exchange current density (J0) can be obtained from intersecting the cathodic or anode branch and the equilibrium potential line.32 J0 is inversely proportional to Rct based on eqn (1) and has a positive correlation with the electrocatalytic activity, while Jlim is positively relevant to the diffusion co-efficient in the reduction of I3− in the redox couple derived from eqn (2).
| J0 = RT/nFRct | (1) |
| D = lJlim/2nFC | (2) |
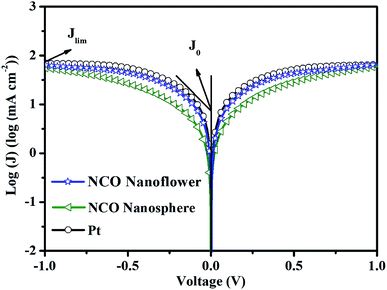 | ||
| Fig. 5 Tafel polarization curves at the scan rate based on the same symmetric cells used in the EIS. | ||
As summarized in Table 1, NCO nanoflower exhibited much higher J0 (0.62![[thin space (1/6-em)]](https://www.rsc.org/images/entities/char_2009.gif) log (mA cm2)) and Jlim value (1.80
log (mA cm2)) and Jlim value (1.80![[thin space (1/6-em)]](https://www.rsc.org/images/entities/char_2009.gif) log (mA cm2)) than NCO nanosphere (0.31 and 1.74
log (mA cm2)) than NCO nanosphere (0.31 and 1.74![[thin space (1/6-em)]](https://www.rsc.org/images/entities/char_2009.gif) log (mA cm2) of J0 and Jlim, respectively), just slightly lower than Pt CE (0.75 and 1.84
log (mA cm2) of J0 and Jlim, respectively), just slightly lower than Pt CE (0.75 and 1.84![[thin space (1/6-em)]](https://www.rsc.org/images/entities/char_2009.gif) log (mA cm2) of J0 and Jlim, respectively). The Tafel polarization performance of three CEs are in good accord with EIS, and further demonstrate the efficient electrocatalytic ability and application potential as CE materials of NCO nanoflower.
log (mA cm2) of J0 and Jlim, respectively). The Tafel polarization performance of three CEs are in good accord with EIS, and further demonstrate the efficient electrocatalytic ability and application potential as CE materials of NCO nanoflower.
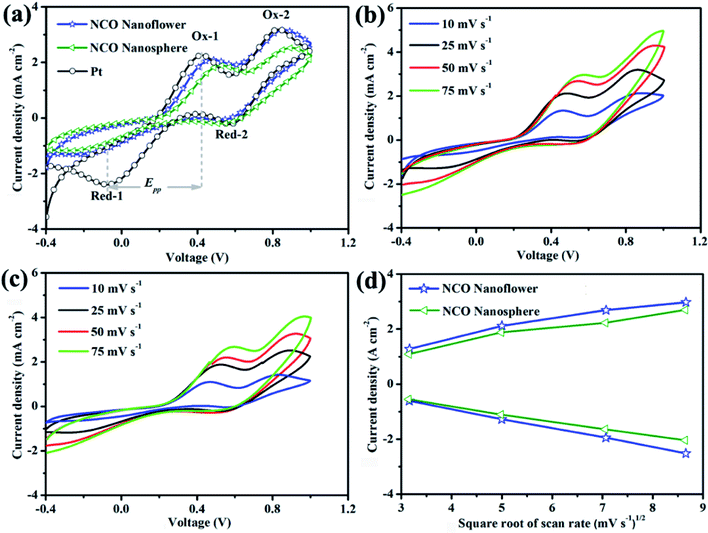
Cyclic voltammetry (CV) was a critical measurement to identify the electrocatalytic activity and reaction kinetics for reducing triiodide of prepared CE materials. CV curves at 25 mV s−1 (Fig. 6a) of NCO nanoflower, NCO nanosphere and Pt CEs exhibited similar two typical pairs of redox peaks. The relatively negative pair of peaks were corresponding to the redox reaction between I− and I3−. Thus, two parameters in negative pair of peaks, peak-to-peak separation (Epp) between Red-1/Ox-1 and the peak current density of Ox-1 (JOx-1), are critical to evaluate the electrocatalytic activity of different CEs. The lower Epp value indicates the better intrinsic electrocatalytic activity and standard electrochemical rate constant of the I−/I3− redox reaction.33,34 It is noteworthy that although NCO nanoflower owns a higher Epp value (596 mV) than Pt (496 mV), still much lower than NCO nanosphere (727 mV). On the other hand, JOx-1 value is positively with the oxidation and reduction reaction rate of I−/I3−. Due to the favorable structure features of nanoflower constructed from nanosheets, the availability of catalytic active sites and diffusion of electrons and reactants were improved. Remarkably, NCO nanoflower exhibits higher JOx-1 value (2.13 mA) than NCO nanosphere (1.92 mA), revealing its better electrocatalytic activity for reducing I3−.
Apart from measured at 25 mV s−1, CV curves of NCO nanoflower and NCO nanosphere at different scan rates were further performed to evaluate the relationship between the scanning rates and the peak current densities of Ox-1/Red-1. As shown in Fig. 6b and c, it can be found that two CE materials showed excellent reversible responses, and their peak current densities regularly increase with the scan rate increasing from 10 to 75 mV s−1. On the other hand, the peak current densities of NCO nanoflower are all higher than that of NCO nanosphere at different scan rates (Fig. 6d). At the same time, both two CE materials show nearly linear relationship between the peak current densities of Ox-1/Red-1 and the square root of the scanning rates. On the basis of Langmuir isotherms principle, this phenomenon reveals that the diffusion of iodide species on the surface of NCO nanoflower is faster than the NCO nanosphere, once again demonstrating the better electrocatalytic activity of NCO nanoflower.35,36
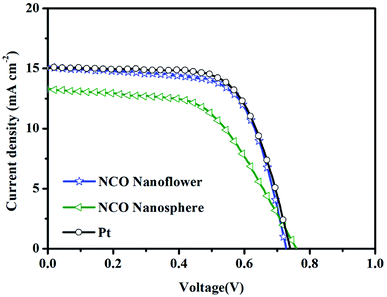
Photocurrent density–voltage (J–V) curves (Fig. 7 and S6†) of the DSSCs with NCO nanoflower, NCO nanosphere and Pt CEs were measured for three times under simulated sunlight irradiation (AM 1.5, 100 mW cm−2), and the corresponding photovoltaic parameters are listed in Table 2 (the bold parameters were summarized in Fig. 7). The DSSCs with NCO nanoflower displayed much higher power conversion efficiency (PCE) of 7.32% than that based on NCO nanosphere CE (PCE = 5.58%). According to the calculate relationship of PCE = (JSC C VOC C FF)/Pin, the better photovoltaic performance of NCO nanoflower mainly stemmed from its higher JSC (15.08 mA cm−2 for NCO nanoflower, 13.29 mA cm−2 for NCO nanosphere) and FF (66.47% for NCO nanoflower, 55.23% for NCO nanosphere). The improvement of JSC and FF is attributed to that the porous structure of NCO nanoflower enhance the electron/ion transport at the CE/electrolyte interface, and increase the availability and utilization efficiency of catalytic active sites, as demonstrated in EIS, Tafel and CV. Benefitting from the favorable structure features, the photovoltaic performance of NCO nanoflower approach closely to Pt CE (PCE = 7.54%, FF = 67.61%, JSC = 15.08 mA cm−2), revealing its promising application as CE electrocatalysts of DSSCs.
| CEs | JSC (mA cm−2) | VOC (V) | FF (%) | PCE (%) |
|---|---|---|---|---|
| NCO nanoflower | 14.32 | 0.75 | 67.78 | 7.28 |
| 14.98 | 0.74 | 66.39 | 7.36 | |
| 15.08 | 0.73 | 66.47 | 7.32 | |
| NCO nanosphere | 14.37 | 0.73 | 56.82 | 5.96 |
| 13.07 | 0.75 | 60.49 | 5.93 | |
| 13.29 | 0.76 | 55.23 | 5.58 | |
| Pt | 14.90 | 0.74 | 67.53 | 7.45 |
| 15.08 | 0.75 | 67.24 | 7.60 | |
| 15.08 | 0.74 | 67.61 | 7.54 |
Electrochemical impedance spectra, Tafel polarization curves, cyclic voltammetry and photocurrent density–voltage curves have been performed to characterize the electrocatalytic performance of NiCo2O4 nanoflower, NiCo2O4 nanosphere and Pt. These four electrochemical measurements are the most common and effective methods to evaluate the electrocatalytic performance of CE materials in DSSC. From the perspective of discussion/theory, 3D porous nanostructure of NCO nanoflower constructed from nanosheets is the main reason to facilitate its comparable electrocatalytic performance with Pt CE. In detail, this porous structure could enhance the electron/ion transport at the CE/electrolyte interface, and increase the availability and utilization efficiency of catalytic active sites. Furthermore, compared with the relative dense structure of NCO nanosphere, NCO nanoflower own larger internal reaction space and more exposed active sites. Therefore, NCO nanoflower exhibited more effectively intrinsic catalytic activity and charge-transfer ability than NCO nanosphere.
4. Conclusion
In summary, two kinds of binary NiCo2O4 electroactive materials with favorable mesoporous structure were successfully fabricated and applied as CE electrocatalysts of DSSC. The mesoporous nanostructure of NCO nanoflower increased the contact area between NCO nanoflower CE and electrolyte, the electron/ion transport at the CE/electrolyte interface, and the availability of catalytic active sites. Furthermore, the electrocatalytic performance of NCO nanosphere assembled from nanoparticles was also investigated. Due to the attractively structural features of mesoporous nanoflower constructed from nanosheets, NCO nanoflower exhibited better electrocatalytic performance for reduction reaction of I3−/I− redox than NCO nanosphere, and even comparable with Pt CE.Conflicts of interest
There are no conflicts of interest to declare.Acknowledgements
This work was financially supported by China Postdoctoral Science Foundation (2018M640209), the National Natural Science Foundation of China (NSFC; Grant No. 41807399) and the National Key Research and Development Program of China (2018YFD0800100).References
- M. G. Brian O'Regan, Nature, 1991, 353, 737–740 CrossRef.
- A. Yella, H. W. Lee, H. N. Tsao, C. Y. Yi, A. K. Chandiran, M. K. Nazeeruddin, E. W. G. Diau, C. Y. Yeh, S. M. Zakeeruddin and M. Gratzel, Science, 2011, 334, 629–634 CrossRef CAS PubMed.
- Y. Saygili, M. Soderberg, N. Pellet, F. Giordano, Y. M. Cao, A. B. Munoz-Garcia, S. M. Zakeeruddin, N. Vlachopoulos, M. Pavone, G. Boschloo, L. Kavan, J. E. Moser, M. Gratzel, A. Hagfeldt and M. Freitag, J. Am. Chem. Soc., 2016, 138, 15087–15096 CrossRef CAS PubMed.
- M. Freitag, J. Teuscher, Y. Saygili, X. Zhang, F. Giordano, P. Liska, J. Hua, S. M. Zakeeruddin, J. E. Moser, M. Gratzel and A. Hagfeldt, Nat. Photonics, 2017, 11, 372–378 CrossRef CAS.
- J. Wu, Z. Lan, J. Lin, M. Huang, Y. Huang, L. Fan, G. Luo, Y. Lin, Y. Xie and Y. Wei, Chem. Soc. Rev., 2017, 46, 5975–6023 RSC.
- S. Yun, A. Hagfeldt and T. Ma, Adv. Mater., 2014, 26, 6210–6237 CrossRef CAS.
- F. Yu, Y. Shi, X. J. Shen, W. H. Yao, S. Han and J. Ma, ACS Sustainable Chem. Eng., 2018, 6, 17427–17434 CrossRef CAS.
- S. C. Lim, M. C. Hsiao, M. D. Lu, Y. L. Tung and H. Y. Tuan, Nanoscale, 2018, 10, 16657–16666 RSC.
- K. Zhao, X. Zhang, M. Wang, W. Zhang, X. Li, H. Wang and L. Li, J. Alloys Compd., 2019, 786, 50–55 CrossRef CAS.
- M. S. Faber and S. Jin, Energy Environ. Sci., 2014, 7, 3519–3542 RSC.
- Z. T. Jin, M. R. Zhang, M. Wang, C. Q. Feng and Z. S. Wang, Acc. Chem. Res., 2017, 50, 895–904 CrossRef CAS PubMed.
- P. Kulkarni, S. K. Nataraj, R. G. Balakrishna, D. H. Nagaraju and M. V. Reddy, J. Mater. Chem. A, 2017, 5, 22040–22094 RSC.
- F. Gong, H. Wang, X. Xu, G. Zhou and Z. S. Wang, J. Am. Chem. Soc., 2012, 134, 10953–10958 CrossRef CAS PubMed.
- H. M. Li, X. Qian, C. L. Zhu, X. X. Jiang, L. Shao and L. X. Hou, J. Mater. Chem. A, 2017, 5, 4513–4526 RSC.
- X. Zhang, Y. X. Yang, S. Q. Guo, F. Z. Hu and L. Liu, ACS Appl. Mater. Interfaces, 2015, 7, 8457–8464 CrossRef CAS PubMed.
- X. Zhang, M. M. Zhen, J. W. Bai, S. W. Jin and L. Lie, ACS Appl. Mater. Interfaces, 2016, 8, 17187–17193 CrossRef CAS PubMed.
- Y. Y. Duan, Q. W. Tang, B. L. He, Z. Y. Zhao, L. Zhu and L. M. Yu, J. Power Sources, 2015, 284, 349–354 CrossRef CAS.
- Y. Y. Duan, Q. W. Tang, J. Liu, B. L. He and L. M. Yu, Angew. Chem., Int. Ed., 2014, 53, 14569–14574 CrossRef CAS PubMed.
- M. H. Shao, Q. W. Chang, J. P. Dodelet and R. Chenitz, Chem. Rev., 2016, 116, 3594–3657 CrossRef CAS PubMed.
- F. Du, X. Q. Zuo, Q. Yang, G. Li, Z. L. Ding, M. Z. Wu, Y. Q. Ma and K. R. Zhu, J. Mater. Chem. C, 2016, 4, 10323–10328 RSC.
- P. Wei, X. Li, J. Li, J. Bai, C. Jiang and L. Liu, Chem.–Eur. J., 2018, 24, 19032–19037 CrossRef CAS PubMed.
- Z. T. Jin, G. Y. Zhao and Z. S. Wang, J. Mater. Chem. C, 2018, 6, 3901–3909 RSC.
- Y. Q. Jiang, X. Qian, C. L. Zhu, H. Y. Liu and L. X. Hou, ACS Appl. Mater. Interfaces, 2018, 10, 9379–9389 CrossRef CAS PubMed.
- X. W. Xie, Y. Li, Z. Q. Liu, M. Haruta and W. J. Shen, Nature, 2009, 458, 746–749 CrossRef CAS PubMed.
- Y. Xiao, C. G. Hu, L. T. Qu, C. W. Hu and M. H. Cao, Chem.–Eur. J., 2013, 19, 14271–14278 CrossRef CAS PubMed.
- Y. Xue, T. Chen, S. Song, P. Kim and J. Bae, Nano Energy, 2019, 56, 751–758 CrossRef CAS.
- C. Z. Yuan, J. Y. Li, L. R. Hou, X. G. Zhang, L. F. Shen and X. W. Lou, Adv. Funct. Mater., 2012, 22, 4592–4597 CrossRef CAS.
- Y. Wang, K. Cheng, D. Cao, F. Yang, P. Yan, W. Zhang and G. Wang, Fuel Cells, 2015, 15, 298–305 CrossRef CAS.
- L. Huang, D. Chen, Y. Ding, S. Feng, Z. L. Wang and M. Liu, Nano Lett., 2013, 13, 3135–3139 CrossRef CAS PubMed.
- J. X. Yao, K. Zhang, W. Wang, X. Q. Zuo, Q. Yang, H. B. Tang, M. Z. Wu and G. Li, ACS Appl. Mater. Interfaces, 2018, 10, 19564–19572 CrossRef CAS PubMed.
- T. Liu, X. Mai, H. Chen, J. Ren, Z. Liu, Y. Li, L. Gao, N. Wang, J. Zhang, H. He and Z. Guo, Nanoscale, 2018, 10, 4194–4201 RSC.
- J. X. Yao, K. Zhang, W. Wang, X. Q. Zuo, Q. Yang, H. B. Tang, M. Z. Wu and G. Li, Nanoscale, 2018, 10, 7946–7956 RSC.
- A. Bora, K. Mohan, P. Phukan and S. K. Dolui, Electrochim. Acta, 2018, 259, 233–244 CrossRef CAS.
- X. Zhang, S. Q. Guo, M. M. Zhen, G. D. Gao and L. Liu, J. Electrochem. Soc., 2015, 162, H774–H779 CrossRef CAS.
- Y. Q. Jiang, X. Qian, Y. D. Niu, L. Shao, C. L. Zhu and L. X. Hou, J. Power Sources, 2017, 369, 35–41 CrossRef CAS.
- Y. H. Wu, B. Zhou, C. Yang, S. C. Liao, W. H. Zhang and C. Li, Chem. Commun., 2016, 52, 11712 RSC.
Footnote |
| † Electronic supplementary information (ESI) available. See DOI: 10.1039/c9ra03559a |
| This journal is © The Royal Society of Chemistry 2019 |

