 Open Access Article
Effect of heat treatment under vacuum on structure and visible-light photocatalytic activity of nano-TiO2
Zhengyuan
Gao
a,
Pengfei
Sun
a,
Yiliu
Fang
a,
Chuanqiang
Li
 *b,
Xiaoya
Yuan
b,
Xuxu
Zheng
ab and
Jiacheng
Gao
c
aSchool of Mechatronics and Automotive Engineering, Chongqing Jiaotong University, Chongqing, China 400074
bSchool of Materials Science and Engineering, Chongqing Jiaotong University, Chongqing, China 400074. E-mail: lichuanqiang_cn@163.com
cSchool of Materials Science and Engineering, Chongqing University, Chongqing, China 400044
First published on 14th October 2019
Abstract
Nano-TiO2 is known as a photocatalyst with high catalytic activity. However, it should be emphasized that the bandgap of nano-TiO2 is wide, which limits its photocatalytic efficiency in response to visible light and thus hinders its potential application. Improving the photocatalytic activity of nano-TiO2 under visible light by the strategy of heat treatment under vacuum was investigated in this study. The structure and photocatalytic activity of nano-TiO2 before and after heat treatment under vacuum were compared and analyzed by XRD, TEM, HRTEM, XPS and UV-Vis-NIR, respectively. The results show that oxygen vacancies were introduced into the crystal structure of nano-TiO2 to change its inherent energy band structure. Particularly, the samples after heat treatment under vacuum exhibited high photocatalytic activity under visible light. In addition, the formation mechanism of non-stoichiometric compound TiO2−x and the mechanism of oxygen vacancy defects to expand the wavelength of light that nano-TiO2 absorbs to the visible portion of the spectrum have also been addressed in this paper.
Introduction
The discovery made by Fujishima and Honda in 1972 indicated that water and other substances could be decomposed by a TiO2 single-crystal electrode under visible light.1 This finding provided a new application field for TiO2 based photocatalysts. In recent years, the research on photocatalysis technology of TiO2 has attracted increasing attention from scientific communities due to its appealing advantages such as the high catalytic oxidation activity, the fast photocatalysis degradation reaction, the high photocatalytic activity, and so on.2,3 Thus, TiO2 based photocatalysts have great potential for applications in a wide range of areas, for example, environmental management,4 development of new energy,5–9 air purification,10,11 sewage treatment,12 self-cleaning ceramics,13,14 sterilization material,15–18 photoelectric conversion,19,20etc. However, the application of TiO2 based photocatalysts is still limited due to the following two aspects. Firstly, the wide band gap of TiO2 limits its photocatalytic efficiency in response to solar radiation (only UV light, accounting for ∼5% of the solar spectrum can be utilized).21 Secondly, it is easy for photoinduced electron hole pairs to recombine, leading to low photocatalytic performance and then low rate of degradation to contaminants. To this end, considerable efforts have been made to improve the photocatalytic efficiency of TiO2 in response to visible light. The existing methods mainly include doping,22–29 compound semiconductor,30 noble metal deposition,31 dye sensitization,32 and surface pretreatment by introducing structural defects.33–35 The crystal structure and band structure of nano-TiO2 could be changed upon using ion doping by ion implantation and chemical doping, and also the photocatalytic activity of TiO2 can be improved by the methods of dye sensitization or compound semiconductor. However, those methods have many disadvantages, for example, the thermal stability is poor, the doped ion is easy to become the composite center of electron hole pairs, and the optical absorption efficiency is low.36 It is thus highly desired to develop an effective method to improve the photocatalytic efficiency of TiO2 in response to visible light, but not with the drawbacks inherent in the aforementioned existing methods. The effort in this paper is to provide an effective solution to such problem.Of particular interest in this paper is to improve the photocatalytic efficiency of TiO2 in response to visible light by heat treatment in vacuum. On the basis of non-stoichiometric compounds, we tried to introduce the oxygen vacancy into the crystal structure of nano-TiO2 to change its inherent energy band structure. As a result, it can absorb visible light over a certain range of wavelength. In addition, we also investigated the mechanism of photocatalytic activity under visible light on the basis of lattice imperfections and energy band of semiconductor to propose a modified technology that is effective to improve the photocatalytic efficiency of TiO2 in response to visible light.
Experimental
To study the effect of heat treatment in vacuum on structure and photocatalytic activity of nano-TiO2 under visible light, the nano-TiO2 anatase powders (MTI, ∼6.40 nm in size, 99.99% purity) was taken as the test subjects. The TiO2 (0.5 g) nanoparticles were placed into corundum crucible to be annealed in VSFV-30 type vacuum furnace. Heat treatment temperatures in this process were taken as 400 °C and 1000 °C, respectively, with a holding time of 40 min. The samples were naturally cooled to room temperature in furnace. Before the TiO2 nanoparticles were heated, the vacuum furnace was pumped below the degree of ∼1.0 × 10⁻¹ Pa. During the whole heating, heat preservation, and cooling process, the vacuum of furnace was maintained at ∼1.0 × 10⁻¹ Pa by pumping vacuum continuously. Then the samples of TiO2 nanoparticles was taken out until the temperature is cooled to room temperature.The phase purity of the samples was verified by powder X-ray diffraction (PXRD) (Bruker D8 ADVANCE AXS) using CuKα radiation (λ = 1.5418 Å) in the range 2θ = 10–90°. The size and crystal structure of TiO2 samples analyzed using transmission electron microscopy (TEM) (Tecnai G2 F20) at an acceleration voltage of 200 kV. Future analysis was carried out using high-resolution X-ray photoelectron spectroscopy (XPS) (Gammadata-Scienta SES 2002) and UV-Vis-NIR Spectrophotometer (Model UV-3101PC Shimadzu) with wavelength ranging from 200 to 700 nm.
The photocatalytic performance of the catalysts were assessed by photo-degradation of methyl orange (MO) solution under visible light. All the experiments were carried out using a BILON-CHX-V photoreactor (Shanghai Bilon Instruments Manufacture Co., Ltd., Shanghai, China) and a 500 W xenon lamp with working current 5 A. The intensity of irradiation was 100 mW cm−2 5 mg of catalysts were mixed with 40 mL of MO solution (20 mg L−1) and kept stirring in the dark for 1 h to establish the adsorption equilibrium. During the irradiation, 3 mL of the reaction solution was withdrawn at certain time intervals and centrifuged to remove the catalysts. The decolorization efficiency was determined by the concentration of MO studied by the spectrophotometer (AOE, Shanghai, China) at the maximum absorption wavelength of 464 nm.37–39 The degradation rate was calculated by the following formula: degradation rate (%) = 100 × (C0 − Ct)/C0. Where C0 is the initial concentration of MO (mg L−1); Ct is the concentration of MO in another given irradiation time (mg L−1).
Results and discussion
The effects of heat treatment in vacuum on structure of nano-TiO2
The XRD pattern of nano-TiO2 after treatment in vacuum is represented in Fig. 1. Analysis of testing results shows that the structure of TiO2 nanoparticles still belongs to anatase after heat treatment in vacuum at 400 °C, with the grain size being about 8.30 nm. The structure of nano-TiO2 is transferred to the structure of rutile after heat treatment in vacuum at 1000 °C, with the grain size being about 50 nm. Compared with the general heat treatment process not in vacuum, where the grain sizes of nano-TiO2 after heat treatment in box-type furnace at 400 °C and 1000 °C are 12.6 nm and 63.7 nm respectively, under the same temperature condition the growth tendency of grain can be decreased with the heat treatment in vacuum.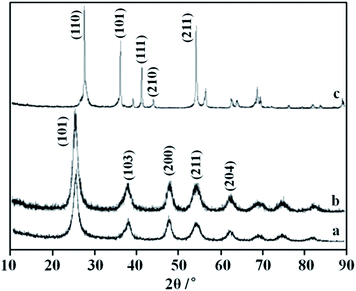 | ||
| Fig. 1 XRD pattern of nano-TiO2 after treatment in vacuum ((a) original anatase, (b) 400 °C × 40 min, (c) 1000 °C × 40 min). | ||
The TEM pictures of nano-TiO2 samples after heat treatment in vacuum under 400 °C and 1000 °C are shown in Fig. 2(b) and (c), respectively. It indicates that the TiO2 nanoparticles after heat treatment in vacuum at 400 °C consist of particles with grain size of 10 nm and the particles treated at 1000 °C have a grain size of 50 nm. Both nanoparticles heat treated in vacuum are nearly spherical and homogenous.
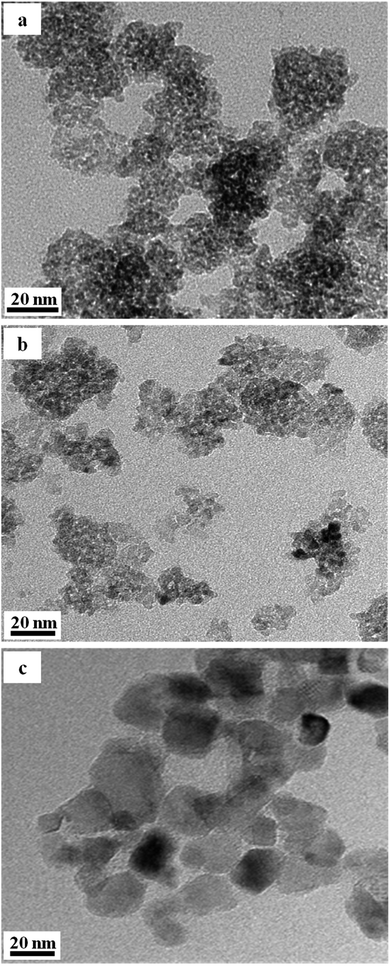 | ||
| Fig. 2 TEM pictures of sample treated in vacuum ((a) original anatase, (b) 400 °C × 40 min, (c) 1000 °C × 40 min). | ||
The main text of the article should appear here with headings as appropriate.
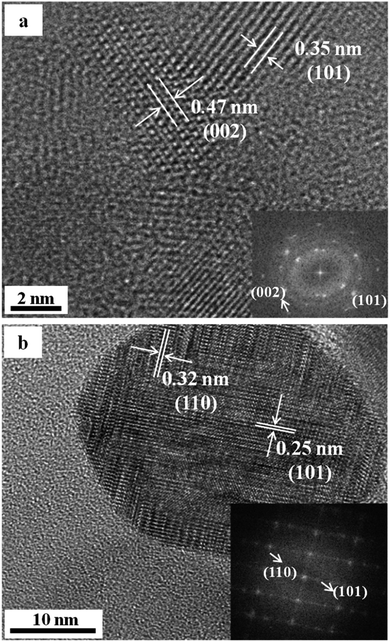
The HRTEM pictures of nano-TiO2 samples after heat treatment in vacuum at 400 °C and 1000 °C are shown in Fig. 3(a) and (b) respectively. The diffraction spots after Fourier transformation at 400 °C and 1000 °C are shown in the bottom right corner of Fig. 3(a) and (b) respectively. The results in Fig. 3 have been listed in Table 1.
| d 1 (Å) | d 2 (Å) | Ratio (d1/d2) | Angle (°) | Temperature (°C) | |
|---|---|---|---|---|---|
| Measured values | 4.69 | 3.5 | 1.34 | 68.7 | |
| Anatase TiO2 (hkl) | 4.75 (002) | 3.51 (101) | 1.35 | 68.3 | 400 |
| Measured values | 3.25 | 2.485 | 1.308 | 90 | |
| Rutile TiO2 (hkl) | 3.248 (110) | 2.487 (101) | 1.306 | 90 | 1000 |
The comparison between the experimental data and the theoretical values of anatase TiO2, which can be seen from Table 1, shows that the experimental results basically agree with theoretical values. Combined with XRD analysis, one can see that the samples after heat treatment in vacuum at 400 °C are anatase TiO2, in which the crystal face involved in the experiment is (002) facet and (101) facet, respectively. Note that the anatase type TiO2 has tetragonal crystal structure, according to the formula of the interplanar spacing of tetragonal system in crystal, namely,
 | (1) |
Analysis of X-ray photoelectron spectroscopy (XPS)
The composition of the surface element was obtained by full-spectrum scanning on the nano-TiO2 samples before and after heat treatment in vacuum. The XPS spectrum results are represented in Fig. 4. It can be seen from Fig. 4 that the elements Ti and O are mainly contained in the nano-TiO2 samples before and after heat treatment in vacuum, as well as some small amounts of elements N and C. The atomic percentage of O 1s and Ti 2P of raw TiO2 and heat treated TiO2 in vacuum is listed in Table 2. The results show that the atomic ratio of O/Ti is less than 2 after the heat treatment in vacuum, which confirms that oxygen vacancies were formed in the lattice as the oxygen atoms in the lattice of TiO2 diffuse to the vacuum. Furthermore, the intensity of the peak located at the binding energy of 531.1 eV are increased obviously for the TiO2 samples after heat treatment in vacuum, indicating that the content of O2− ions in the oxygen-deficient regions were increased.20 The result also demonstrate that the oxygen vacancies were formed in the TiO2 matrix after heat treatment in vacuum.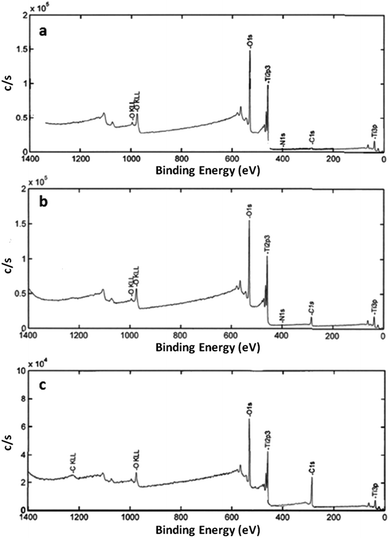 | ||
| Fig. 4 XPS spectra for nano-TiO2 before and after treatment in vacuum ((a) raw anatase, (b) 400 °C × 40 min, (c) 1000 °C × 40 min). | ||
| O 1s | Ti 2P | O/Ti | |
|---|---|---|---|
| Original anatase TiO2 | 54.12 | 27.06 | 2 |
| TiO2 modified at 400 °C | 49.077 | 25.38 | 1.9337 |
| TiO2 modified at 1000 °C | 32.227 | 16.62 | 1.9390 |
To further study the chemical valence of element Ti, the Ti 2p of the samples before and after heat treatment in vacuum was scanned in narrow zone. The XPS spectrum result is represented in Fig. 5. In the XPS database, for Ti4+ ions the binding energies corresponding to the photoelectron spectrums of Ti 2p1/2 and Ti 2p3/2 are 464.5 eV and 458.8 eV, respectively. For the compounds of Ti in different valence state, there is no change in the values of binding energy of Ti 2p1/2, while the values of binding energy of Ti 2p3/2 are different. For example, the binding energy values corresponding to the Ti 2p3/2 lines of TiO1.5, TiO, and Ti are 456.1 eV, 455.1 eV, and 454 eV, respectively.40 It thus can be concluded that the lower the chemical valence of Ti ions, the smaller the binding energy of corresponding Ti 2p3/2 lines. From Fig. 5 we see that the binding energy value of Ti 2p3/2 lines of nano-TiO2 before heat treatment in vacuum is 459.01 eV. The binding energy values of Ti 2p3/2 lines of nano-TiO2 after heat treatment in vacuum at 400 °C and 1000 °C are reduced to 457.6 eV and 458.2 eV, respectively. The decrease in binding energy indicates that the chemical valence of some atoms Ti in the modified samples has been changed, and there exist the Ti3+ ions.
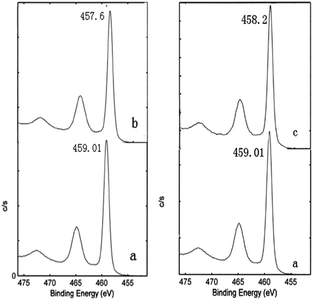 | ||
| Fig. 5 XPS spectra of Ti 2p for nano-TiO2 before and after treatment in vacuum ((a) raw anatase TiO2, (b) 400 °C, (c) 1000 °C). | ||
Analysis of ultraviolet-visible diffuse reflectance absorption spectrum
The diffuse reflectance absorption spectrum results of nano-TiO2 powders before and after heat treatment in vacuum are represented in Fig. 6. From Fig. 6 we see that the light region of the absorption of the nano-TiO2 powders before heat treatment in vacuum is limited to the ultraviolet region (10–400 nm). On the contrary, the nano-TiO2 powders after the heat treatment in vacuum is extended to the visible light region. Specifically, after heat treatment in vacuum the optical absorption threshold wavelength of the samples modified at 400 °C was shifted to 480 nm, and that modified at 1000 °C was shifted to 600 nm, indicating that the wavelengths of light the nano-TiO2 absorbs was shifted to the visible portion (380–780 nm) of the spectrum after heat treatment in vacuum.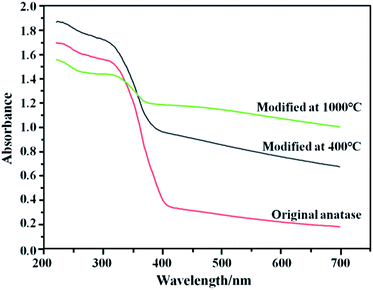 | ||
| Fig. 6 UV-Vis diffusive reflectance absorption spectra of samples before and after treatment in vacuum. | ||
The effect of heat treatment in vacuum on photocatalytic activity of nano-TiO2 under visible light
The relationship between the time and the degradation rate of methyl orange solution degraded by samples before and after heat treatment in vacuum is shown in Fig. 7(a). It can be seen from Fig. 7(a) that the nano-TiO2 after heat treatment in vacuum has photocatalytic activity under visible light. Besides, the nano-TiO2 powders treated at 400 °C exhibited the best photocatalytic activity under visible light. The degradation rate of nano-TiO2 powders treated at 400 °C after 3 h of light reaches 81.233%, the degradation rate of the samples heat treated in vacuum at 1000 °C is only 40.055% after 3 h of light. This is likely related to particle size and crystal structural difference.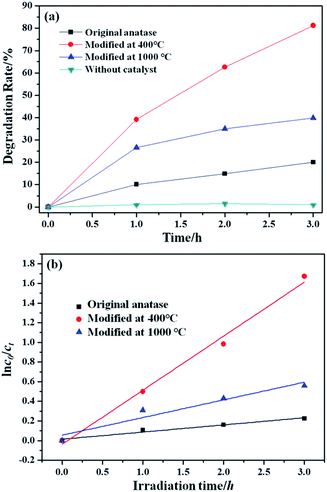 | ||
| Fig. 7 (a) Degradation rate of samples before and after heat treatment in vacuum; (b) photocatalytic degradation kinetics of MO. | ||
The photocatalytic data was future analyzed by the first-order kinetic model. As shown in Fig. 7(b), the first-order kinetic model fitted well with experimental data. The values of rate constant (ke) and regression coefficients (R2) were listed in Table 3. The values of R2 were all higher than 0.900, which indicated the photocatalytic degradation reaction was in accorded with first-order kinetic. The TiO2 treated at 400 °C had the highest ke, where the value of 0.550 h−1 was acquired.
| Catalysts | k e (h−1) | R 2 |
|---|---|---|
| Anatase | 0.073 | 0.964 |
| Modified at 400 °C | 0.550 | 0.989 |
| Modified at 1000 °C | 0.180 | 0.912 |
Formation mechanism of non-stoichiometric compound TiO2−x
Both the HRTEM analysis and XPS analysis show that the oxygen vacancy defects were introduced into the lattice of nano-TiO2 after heat treatment in vacuum. The atomic ratios of O/Ti in samples modified at 400 °C and 1000 °C, respectively, were 1.9337 and 1.9390, implying that the non-stoichiometric compound TiO2−x was formed. This section focuses on the mechanism of the formation of the non-stoichiometric compound TiO2−x.By the non-stoichiometric compound, it refers to the compound in which the proportion between the negative ions and positive ions is not constant. Such non-stoichiometric compound can be considered as a solid solution of a high-valence compound and a low-valence compound, it could also be considered as a point defect.41 In general, the formation of non-stoichiometric compounds is related to the atmosphere, pressure, and temperature. During the heat treatment in vacuum, not only the oxygen adsorbed on the surface of TiO2 was desorbed but also the oxygen atoms in the lattice of TiO2 diffused to the vacuum due to the lack of oxygen in the environment, leading to the formation of the oxygen vacancies and some Ti4+ ions were reduced to Ti3+ ions to keep the electric neutrality. The narrow scanning on element Ti also confirms the formation of Ti3+ ions. The specific reaction of the formation of TiO2−x can be expressed as follows. Note that in oxygen-free environments, the reaction of TiO2 is:
 | (2) |
 | (3) |
Since  , we then derive from (2) and (3) that
 | (4) |
This defect reaction can be divided into the following types:
 denotes the condition of electrical neutrality.
Case 1: suppose that  , it then holds that
Case 2: suppose that  , then the condition of electrical neutrality is approximately equal to
  , and further, it holds that
Case 3: suppose that  , then the condition of electrical neutrality is approximately equal to
  , and further, it holds that
It is worth mentioning that the oxygen partial pressure is relatively low and the corresponding is relatively large under the heat treatment in vacuum. As a result, defect reaction belongs to the third case. Hence, the concentration of the oxygen vacancy is inversely proportional to the power of the oxygen partial pressure.
The mechanism of the effect of oxygen vacancy defects on the application of nano-TiO2 under visible light.
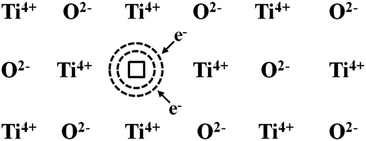
The oxygen vacancies of the anatase nano-TiO2 obtained by the heat treatment in vacuum are positively charged, and two electrons are bounded nearly to the oxygen vacancy. The two electrons are different from the general free electrons in that they are quasi-free electrons bounded by the oxygen vacancies. If they associated with the Ti4+ nearby, this kind of electrons would make Ti4+ ions into Ti3+ ions. If in an electric field, this kind of electron may migrate from one Ti4+ ion to another Ti4+ ion nearby such that electronic conductivity is formed. The material with such a defect is called a n-type semiconductor. This kind of negative-ion vacancy together with the surrounding bounded excess electrons is called the color structure, in the center of which the electrons can absorb light of a certain wavelength, as illustrated in Fig. 8.
In the existing work, the introduction of the oxygen vacancy defects to the crystal structure of nano-TiO2 is mainly by nonmetallic elements doping. By introducing the oxygen vacancy to the crystal structure of TiO2, the non-metallic elements then can substitute the oxygen vacancy, such that TiO2−xAx (A denotes the nonmetallic element) crystal is formed. In this case, the band gap of the nonmetallic elements doped TiO2 is narrow and an obvious redshift of the threshold of optical absorption will occur. The obvious redshift then results in extended the response range of absorbed light.
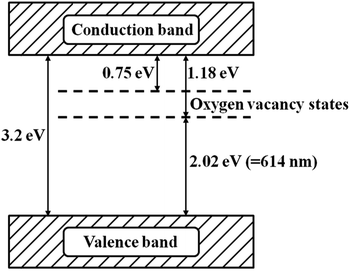
In this work, the oxygen vacancies formed in the crystal structure of TiO2 do not introduce other elements into the lattice of TiO2. In regard to the existence of oxygen vacancies in the band structure of TiO2, some scholars have measured the energy of the electron detaching from the oxygen vacancy in TiO2. They claimed that the energy value is between 0.75 and 1.8 eV,42 and the oxygen vacancy of anatase TiO2 is located at 2.02–2.45 eV above the valence band. In addition, the isolated oxygen vacancy in the band structure of TiO2 is between the valence band and conduction band, as can be seen from Fig. 9. Generally, photoexcitation process in light is only one step. However, for the TiO2 with oxygen vacancy, the oxygen vacancy state would be involved in a new photoexcitation process in light. That is, the electrons on the valence band are excited with the low energy provided by visible light. The excited electrons jump to the oxygen vacant state and then to the conduction band of TiO2 such that the visible light is absorbed.
Conclusions
(1) The oxygen vacancy and Ti3+ were formed in the crystal structure of nano-TiO2 after heat treatment in vacuum, in which the oxygen vacancy located between the valence band and the conduction band of the energy band structure of nano-TiO2. This makes the photo-generated electrons first jump into the state of oxygen vacancy under the effect of lower energy and then to the conduction band, such that the visible-light absorption is improved.(2) The nano-TiO2 samples can absorb the visible light of certain wavelength after heat treatment in vacuum. The wavelengths of light the nano-TiO2 absorbs is shifted to the visible portion of the spectrum. Specifically, the optical absorption threshold wavelength of the samples modified at 400 °C and 1000 °C were shifted to 480 nm and 600 nm, respectively, after the heat treatment in vacuum.
(3) The modified samples possess visible light catalytic activity, and the degradation rate of the powders after heat treatment in vacuum at 400 °C is 81.233% after 3 hour light exposure.
Conflicts of interest
There are no conflicts to declare.Acknowledgements
This work was supported by the Project of Basic Science and Frontier Technology Research Project of Chongqing (cstc2017jcyjAX0310, cstc2016jcyjA0561, cstc2014jcyjA50025); Scientific and Technological Research Program of Nanchuan in Chongqing (CX201407); Science and Technology Research Program of Chongqing Municipal Education Commission (KJ1705124); Research Program of Chongqing Jiaotong University (16JDKJC-A005).Notes and references
- A. Fujishima and K. Honda, J. Nat., 1972, 238, 37 CrossRef CAS PubMed.
- I. Ali, M. Suhail, Z. A. Alothman and A. Alwarthan, RSC Adv., 2018, 8, 30125 RSC.
- Y.-W. Su, W.-H. Lin, Y.-J. Hsu and K.-H. Wei, Small, 2014, 10, 4427 CrossRef CAS PubMed.
- Y.-H. Chiu and Y.-J. Hsu, Nano Energy, 2017, 31, 286 CrossRef CAS.
- P.-Y. Hsieh, Y.-H. Chiu, T.-H. Lai, M.-J. Fang, Y.-T. Wang and Y.-J. Hsu, ACS Appl. Mater. Interfaces, 2019, 11, 3006 CrossRef CAS.
- Y.-H. Chiu, T.-H. Lai, C.-Y. Chen, P.-Y. Hsieh, K. Ozasa, M. Niinomi, K. Okada, T.-F. M. Chang, N. Matsushita, M. Sone and Y.-J. Hsu, ACS Appl. Mater. Interfaces, 2018, 10, 22997 CrossRef CAS PubMed.
- Y.-S. Chang, M. Choi, M. Baek, P.-Y. Hsieh, K. Yong and Y.-J. Hsu, Appl. Catal., B, 2018, 225, 379 CrossRef CAS.
- Y.-C. Pu, Y. Ling, K.-D. Chang, C.-M. Liu, J. Z. Zhang, Y.-J. Hsu and Y. Li, J. Phys. Chem. C, 2014, 118, 15086 CrossRef CAS.
- Y.-C. Pu, G. Wang, K.-D. Chang, Y. Ling, Y.-K. Lin, B. C. Fitzmorris, C.-M. Liu, X. Lu, Y. Tong, J. Z. Zhang, Y.-J. Hsu and Y. Li, Nano Lett., 2013, 13, 3817 CrossRef CAS.
- A. A. Valeeva, I. B. Dorosheva, E. A. Kozlova, R. V. Kamalov, A. S. Vokhmintsev, D. S. Selishchev, A. A. Saraev, E. Y. Gerasimov, I. A. Weinstein and A. A. Rempel, J. Alloys Compd., 2019, 796, 293 CrossRef CAS.
- R. Huang, S. Zhang, J. Ding, Y. Meng, Q. Zhong, D. Kong and C. Gu, J. Colloid Interface Sci., 2019, 553, 647 CrossRef CAS.
- Y.-H. Chiu, T.-F. M. Chang, C.-Y. Chen, M. Sone and Y.-J. Hsu, Catalysts, 2019, 9, 430 CrossRef CAS.
- J.-B. Chemin, S. Bulou, K. Baba, C. Fontaine, T. Sindzingre, N. D. Boscher and P. Choquet, Sci. Rep., 2018, 8, 9603 CrossRef PubMed.
- G. Chen, S. Ouyang, Y. Deng, M. Chen, Y. Zhao, W. Zou and Q. Zhao, RSC Adv., 2019, 9, 18652 RSC.
- X. Shen, F. Zhang, K. Li, C. Qin, P. Ma, L. Dai and K. Cai, Mater. Des., 2016, 92, 1007 CrossRef CAS.
- Z. Yuan, S. Huang, S. Lan, H. Xiong, B. Tao, Y. Ding, Y. Liu, P. Liu and K. Cai, J. Mater. Chem. B, 2018, 6, 8090 RSC.
- L. Sutrisno, Y. Hu, X. Shen, M. Li, Z. Luo, L. Dai, S. Wang, J. L. Zhong and K. Cai, Mater. Sci. Eng., C, 2018, 89, 95 CrossRef CAS.
- B. Tao, Y. Deng, L. Song, W. Ma, Y. Qian, C. Lin, Z. Yuan, L. Lu, M. Chen, X. Yang and K. Cai, Colloids Surf., B, 2019, 177, 242 CrossRef CAS PubMed.
- J.-M. Li, C.-W. Tsao, M.-J. Fang, C.-C. Chen, C.-W. Liu and Y.-J. Hsu, ACS Appl. Nano Mater., 2018, 1, 6843 CrossRef CAS.
- J.-M. Li, Y.-T. Wang and Y.-J. Hsu, Electrochim. Acta, 2018, 267, 141 CrossRef CAS.
- M. Samiee and J. Luo, Mater. Lett., 2013, 98, 205 CrossRef CAS.
- H. Yamashita, M. Harada, J. Misaka, M. Takeuchi, B. Neppolian and M. Anpo, Catal. Today, 2003, 84, 191 CrossRef CAS.
- S. Sato, R. Nakamura and S. Abe, Appl. Catal., A, 2005, 284, 131 CrossRef CAS.
- D. Li, H. Haneda, S. Hishita, N. Ohashi and N. K. Labhsetwar, J. Fluorine Chem., 2005, 126, 69 CrossRef CAS.
- D. Li, H. Haneda, N. K. Labhsetwar, S. Hishita and N. Ohashi, Chem. Phys. Lett., 2005, 401, 579 CrossRef CAS.
- J. Zhang, L. J. Xu, Z. Q. Zhu and Q. J. Liu, Mater. Res. Bull., 2015, 70, 358 CrossRef CAS.
- D. R. Zhang, H. L. Liu, S. Y. Han and W. X. Piao, J. Ind. Eng. Chem., 2013, 19, 1838 CrossRef CAS.
- W. H. Cheng, C. D. Li, X. Ma, L. M. Yu and G. Y. Liu, Mater. Des., 2017, 126, 155 CrossRef CAS.
- Y. Q. Zhang and P. J. Li, Mater. Des., 2015, 88, 1250 CrossRef CAS.
- V. Subramanian, E. Wolf and P. V. Kamat, J. Phys. Chem. B, 2001, 105, 11439 CrossRef CAS.
- Y. X. Zhang, H. Ma, M. Yi, Z. G. Shen, X. Z. Yu and X. J. Zhang, Mater. Des., 2017, 125, 94 CrossRef CAS.
- G. L. Zhao, H. Kozuka and T. Yoko, J. Ceram. Soc. Jpn., 1996, 104, 164 CrossRef CAS.
- G. Colon, M. C. Hidalgo, G. Munuera, I. Ferino, M. G. Cutrufello and J. A. Navío, Appl. Catal., B, 2006, 63, 45 CrossRef CAS.
- G. Colon, M. C. Hidalgo and J. A. Navio, Appl. Catal., B, 2009, 90, 633 CrossRef CAS.
- L. L. Lai, W. Wen, B. Fu, X. Y. Qian, J. B. Liu and J. M. Wu, Mater. Des., 2016, 108, 581 CrossRef CAS.
- R. Asahi, T. Morikawa, T. Ohwaki, K. Aoki and Y. Taga, Science, 2001, 293, 269 CrossRef CAS.
- R. Saravanan, D. Manoj, J. Qin, M. Naushad, F. Gracia, A. F. Lee, M. M. Khan and M. A. Gracia-Pinilla, Process Saf. Environ. Prot., 2018, 120, 339 CrossRef CAS.
- L. Lu, R. Shan, Y. Shi, S. Wang and H. Yuan, Chemosphere, 2019, 222, 391 CrossRef CAS.
- X. Yuan, X. Wu, Z. Feng, W. Jia, X. Zheng and C. Li, Catalysts, 2019, 9, 624 CrossRef CAS.
- W. J. Yin, B. Wen, C. Zhou, A. Selloni and L. M. Liu, Surf. Sci. Rep., 2018, 73, 58 CrossRef CAS.
- L. M. Zhang, X. H. Huang and X. L. Song, Materials science foundation, Wuhan University Press, Wuhan, 2004, p. 155 Search PubMed.
- D. C. Cronemeyer, Phys. Rev., 1959, 113, 1222 CrossRef CAS.
| This journal is © The Royal Society of Chemistry 2019 |

