
 Open Access Article
 This Open Access Article is licensed under a Creative Commons Attribution-Non Commercial 3.0 Unported Licence
Effects of deacetylation of konjac glucomannan on the physico-chemical properties of surimi gels from silver carp (Hypophthalmichthys molitrix)
Li Yuan†
ab,
Jiamei Yu†a,
Jianlou Muc,
Tong Shia,
Quancai Sun a,
Wengang Jin*b and
Ruichang Gao*ab
a,
Wengang Jin*b and
Ruichang Gao*ab
aSchool of Food and Biological Engineering, Jiangsu University, No. 301, Xuefu Road, Zhenjiang, Jiangsu Province 212013, China. E-mail: xiyuan2008@ujs.edu.cn; Fax: +86-511-88780201; Tel: +86-511-88780201
bBio-resources Key Laboratory of Shaanxi Province, School of Biological Science and Engineering, Shaanxi University of Technology, Hanzhong 723001, P R China. E-mail: jinwengang@nwafu.edu.cn
cCollege of Food Science and Technology, Agriculture University of Hebei Province, Baoding, Hebei Province 071000, China
First published on 25th June 2019
Abstract
This work studied the effects of KGM with different degrees of deacetylation (DDs) on the physicochemical properties of silver carp (Hypophthalmichthys molitrix) surimi gels. Compared with KGM, deacetylated KGM (DKGM) weakened the water-holding capacity, but increased the gel strength of surimi gels. The storage modulus (G′) and loss modulus (G′′) of surimi showed an upward trend, and the aggregation rate of surimi with DKGM changed. The number of ionic bonds of mixed surimi gels increased on the whole, but those of hydrogen bonds declined; a hydrophobic interaction was the main driving force, and improved with the DDs of DKGM. FT-IR results indicated that the deacetylation of KGM had a slight influence on the secondary structure of the proteins. SDS-PAGE results showed that DKGM enhanced the intensity of the main heavy chains of myosin and actin. Examination of the network structure of the surimi gels revealed that DKGM might combine around the filaments of myofibrillar proteins like a rosary through hydrophobic interactions and hydrogen bonding. As a consequence, the myfibrillar protein aggregation was changed and the microstructures of the surimi became more compact and fibrous. The results indicated that the deacetylation of KGM led to an increase in hydrophobicity, which influenced the hydrophobic interaction of the myofibrillar proteins. As a result, the aggregation of the myofibrillar proteins was promoted and the physico-chemical properties of the surimi gel were improved.
1. Introduction
Marine fish is the best raw material for the production of surimi, however, with the rapid growth in global demand for surimi products, marine fish have been overfished. As a result, marine fish resources are decreasing,1,2 while freshwater fish resources remain abundant. This lends urgency to the use of freshwater fish as raw materials to produce surimi products of high quality. Yet, freshwater surimi gels have disadvantages, such as poor gel strength, gel degradation, and a lack of elasticity during processing.3,4 To help overcome these disadvantages, exogenous substances such as polysaccharides may be added to improve gel-forming capacity and gel properties.5–7Konjac glucomannan (KGM), as a water-soluble neutral polysaccharide, is derived from konjac tubers.8,9 It is widely believed that the acetyl group is closely related to the properties of KGM, such as its gelling and thickening properties. A mild alkali was added in the KGM sol to carry out the deacetylation reaction during heating, resulting in the formation of a thermal irreversible gel.10–12 Therefore, KGM was used as an additive in surimi products to enhance the quality of surimi.13–15 The KGM degradation product, which was obtained by γ-irradiation with a 100 kGy dosage of 60Co, interacted with Tilapia myofibrillar proteins and prevented the network structure of gels from deterioration.16 Liu et al. (2017) suggested that konjac oligo-glucomannan (KOG) had a positive effect on the conformational and functional properties of myosin.7 The deacetylation of KGM tempered changes in protein structure, and strengthened the gel network under high temperature (120 °C) treatment.17 Liu et al. (2019a; 2019b) studied the deacetylation of konjac oligo-glucomannan on the physico-chemical and structural properties of silver carp myosin as well.18,19
Although a few studies of KGM-protein gels exist, the fundamental mechanism was not clear at the structural level of the molecule itself. As well known, the removal of acetyl groups changes the interaction force and structure of KGM itself. However, the effect of deacetylated KGM on the proteins unfolding and aggregation within surimi remains unclear. Therefore, the aim of this study was to research the effect of KGM with different degrees of acetylation (DDs) on the physicochemical properties of surimi gels, and to illustrate the fundamental mechanism between KGM with DDs and proteins.
2. Materials and methods
2.1. Materials and chemicals
Frozen silver carp surimi (grade AAA) was obtained from Honghu Hongye Aquatic Food Co., Ltd (Honghu, China). The surimi was stored at −20 °C until use. Konjac glucomannan (KGM) was purchased from Zhengzhou Zhengya Chemical products Co., Ltd (Zhengzhou, China). All of the chemicals used were of analytical grade and were purchased from Sinopharm Chemical Reagent Co., Ltd. (Shanghai, China).2.2. Preparation of deacetylated konjac glucomannan (DKGM) samples
KGM samples with different degrees of deacetylation (DDs) were prepared according to the method of Du et al. (2012) with some modification.10 KGM (45 g) added 300 mL of 50% ethanol solution, and the mixture was swelled in a 40 °C constant temperature oscillator for 30 min. A certain amount of NaOH was added into it to react at 40 °C for 24 h. After the deacetylation reaction had completed, the samples were washed with different gradients of ethanol (50%, 75%, 95% and 100%) to remove excess alkali. The final samples of KGM with DDs were obtained by vacuum drying at 40 °C. DKGM samples were obtained by changing the amount of NaOH, and the deacetylation degree (DD) was determined by hydrochloric acid titration according to the method of Chen, Zong and Li (2006),20 which were labeled as DKGM1 (DD% = 63.29% ± 0.46) and DKGM2 (DD% = 94.50 ± 0.41), respectively.2.3. Preparation of mixed surimi gels
The frozen surimi was thawed at 4 °C in a refrigerator for 12 h, and then grounded for 5 min in a chopping bowel in order to obtain a homogeneous paste. Sodium chloride (3 wt%) was added into the paste, which was grounded another 15 min. Then, 2 wt% KGM, DKGM1 and DKGM2 were mixed with the paste, respectively. The three mixtures were blended for 5 min, then was placed in the plastic casings. All the samples were heated under 40 °C for 60 min, then heated under 90 °C in a water bath for 30 min, followed by immediately cooled in ice water. Finally, the gels were set at 4 °C overnight before the determination.2.4. Determination of water-holding capacity
The water-holding capacity (WHC) of the KGM gels was determined by centrifugation according to the method of Wu, Xiong, Chen, Tang and Zhou (2009).21 Briefly, the gels were cut into 5 mm cubes, weighed (recorded as X1), placed in a centrifuge tube with some filter at the bottom, and centrifuged (10![[thin space (1/6-em)]](https://www.rsc.org/images/entities/char_2009.gif) 000g, 15 min and 4 °C). Afterwards, the samples were weighed (recorded as X2). The WHC was calculated using the following equation:
000g, 15 min and 4 °C). Afterwards, the samples were weighed (recorded as X2). The WHC was calculated using the following equation: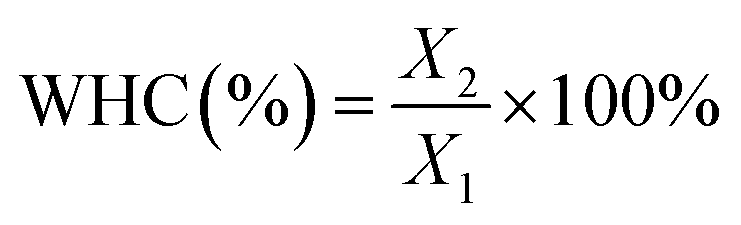
2.5. Determination of gel strength
The gel strength of the KGM gels was carried out using a TA-XT Plus Texture analyzer (Stable Micro Systems Co., England) following the method of Phatcharat, Benjakul, and Visessanguan (2006),22 with minor adjustment. Cylindrical gel samples (2.5 cm in length) were pierced to breaking point with a spherical plunger (5 mm diameter, 60 mm min−1 depression speed). The breaking force was recorded as the value of the first force peak (g) and the breaking deformation (cm) represented the distance between the start point and the first peak force point. Gel strength was calculated by multiplying breaking force by deformation (g × cm).2.6. Rheological measurement
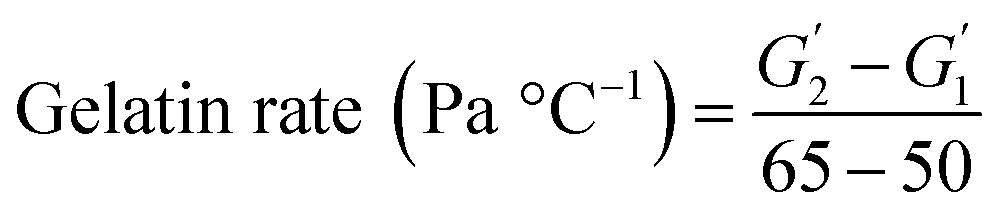
Following the method of Liu et al., (2010),23 with slight adjustment, dynamic rheological studies were carried out on a DISCOVERY HR-1 TA rheometer (TA Co., Ltd., New Castle DE, USA) using a parallel steel plate geometry (40 mm and 1 mm gap). The mixed surimi sol was placed on the platform and any excess sample was removed. The plate was covered in silicone oil to limit moisture evaporation. The samples were heated from 20 to 90 °C at 1 °C min−1 (1 Hz oscillation frequency, 1% stress). During the temperature scanning process, the storage modulus (G′), loss modulus (G′′) and viscoelasticity (tanδ) were recorded. The slope of G′ versus temperature (50–65 °C) represented the gelation rate. The gelation rate was estimated using the following equation:where
 and
and  are the storage modulus G′ (Pa) at 65 °C and 50 °C respectively.
2.7. Determination of protein solubility
The solubility of proteins was determined by different chemical reagents that could destroy the internal chemical forces of molecules: 0.6 M NaCl for breaking electrostatic force and hydrogen bonds, 1.5 M urea for breaking hydrogen bonds, 8 M urea for breaking hydrogen bonds and hydrophobic interactions.24 The chemical force of the surimi gels was determined according to the method of Gómez-Guillén et al., (1997) with the following solutions: 0.05 M NaCl (SA), 0.6 M NaCl (SB), 0.6 M NaCl + 1.5 M urea (SC), and 0.6 M NaCl + 8 M urea (SD).25 The existence of ionic bonds (difference between SB and SA), hydrogen bonds (difference between SC and SB), hydrophobic interactions (difference between SD and SC) was measured by dissolving proteins in these solutions. 2 g of surimi gel samples mixed with 10 mL of the above solution was homogenized and allowed to stand for 1 h at 4 °C, then centrifuged at 10000g for 15 min. The content of protein (g L−1) in the supernatant was determined by the Lowry method.26
2.8. FT-IR spectroscopy
The infrared absorption spectrums of the freeze-dried surimi gels were measured in KBr pellets by WQF-510A Fourier transform infrared (FT-IR) spectrometer (Bei Fen Rayleigh Instruments Co., Ltd. Beijing, China). The wavenumber range was 4000 to 400 cm−1 at a resolution of 4 cm−1 and the number of scans was 32.2.9. Electrophoresis
Protein changes in mixed gels were examined by sodium dodecyl sulfate polyacrylamide gel electrophoresis (SDS-PAGE) under denaturing conditions according to the method of Laemmli (1970) with minor modifications, using a 10% acrylamide separating gel and a 4% acrylamide stacking gel.27 Protein samples (2 mg mL−1) were mixed with the loading buffer at a 4:1 ratio (v/v) and boiled for 5 min. Per lane was loaded with 20 μL protein. Gels were performed at 80 V, then at 120 V after getting into the separation gel. Coomassie Brilliant Blue R250 was used for staining the gel for 30 min, then the gel was discolored by a solution of methanol and acetic acid for 2–3 h.
2.10. Scanning electron microscopy (SEM)
The microstructure of mixed surimi gel was examined by SEM according to the method of Hayakawa et al. (2012) with some modification.28 The gels, cut into 2–3 mm cubes, were fixed with 5% glutaraldehyde solution at 4 °C, then rinsed by 0.1 M phosphate buffer several times. The gels were fixed with 1% osmium tetroxide, followed by further washes with 0.1 M phosphate buffer. The samples were subjected to critical point drying and ion sputtering before being dehydrated with a gradient ethanol, namely, 30%, 50%, 70%, 90%, and 100%. The specimens were observed using a Quanta-200 scanning electron microscope (FEI Co., Hillsboro, OR, USA) at an acceleration voltage of 10 kV.2.11. Statistical analysis
Tests were performed at least three times. Analysis of variance (ANOVA) and mean comparisons were carried out using the Statistical Analysis System (SAS Institute Inc, Cary, NC, USA). The significance of comparisons between samples was analysed by one-way ANOVA with a significance level of p < 0.05.3. Results and discussion
3.1. WHC and of gel strength of the surimi gels
The effects of KGM with DDs on WHC are shown in Fig. 1A. Compared with the control group, KGM significantly increased the WHC, however, that of gels with DKGM with higher DDs decreased. The results were similar to those reported in Zhang, Xue, Li, Wang and Xue (2015).29 KGM had good water solubility, strong ability to bind water, and may block the binding of hydrophobic sites between protein molecules,30 thereby increasing water holding capacity. Chen, Li and Li (2011) suggested that acetyl group imparted water solubility to KGM,31 and the steric hindrance effect of acetyl groups hindered the formation of intermolecular forces of KGM itself. With increasing DDs, the solubility of DKGM decreased, while the hydrophobicity of proteins increased. KGM containing partial acetyl groups has a weaker hydrophobic interaction and a better ability to combine with water and enhance hydrogen bonding.32 However, the DKGM with all acetyl groups removed reduced the water holding capacity of the surimi gel due to the strong hydrophobic interactions. Hydrophobic forces play an important role in the water holding capacity of surimi gel, and forced out the second layer of water (semi-bound water), resulting in a loss of the water of surimi gel.33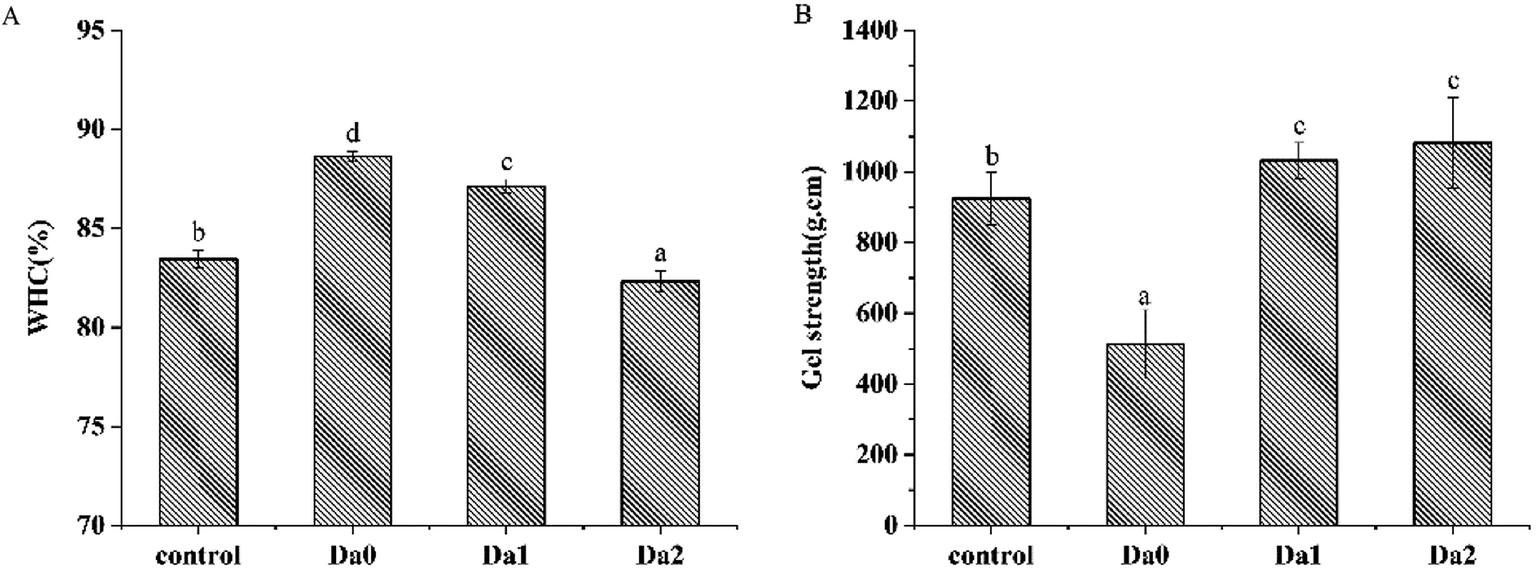 | ||
| Fig. 1 Effects of KGM with DDs on the water-holding capacity (A) and gel strength (B) of the surimi gels. Means with different letters were significantly different at P < 0.05. Da0: KGM; Da1: DKGM1, DD% = 63.29% ± 0.46; Da2: DKGM2, DD% = 94.50 ± 0.41. | ||
Fig. 1B shows that KGM with DDs had certain influence on the gel strength of surimi gels. KGM significantly reduced the gel strength of the surimi gels (P < 0.05), while the addition of DKGM resulted in a significant increase in the gel strength. The protein denatured and formed a three-dimensional network structure during heating.34,35 The effective elastic deformation could not improve the gel strength with the addition of KGM. Furthermore, the surimi gel contained more water inside because of the strong ability of KGM to bind water, leading to the decrease of surimi gel strength. However, Xiong et al. (2009) reported that KGM increased the breaking force and deformation of the surimi gel of grass carp,36 and increased the gel-forming ability. In KGM with the acetyl group removed, the order of KGM molecular chains enhanced, and gel-forming stability improved, promoting the polymerization of protein molecules and the gel strength. DKGM can form gel due to the strong hydrophobic interactions, therefore, the gel strength of mixed surimi gel depends on the myofibrillar proteins gel and the DKGM gel. As the degree of deacetylation increases, the magical domain glycan is more likely to form a well-structured gel. Therefore, the gel strength of mixed surimi gels increased.
3.2. Dynamic rheology of the surimi samples
The effects of KGM with DDs on the dynamic rheological properties of surimi are shown in Fig. 2. As seen from Fig. 2A, the G′ of the surimi increased significantly with the addition of the DKGM, and reached the maximum at DKGM1, indicating better gelling capacity. Changes in G′ show three main transitions during heating. G′ increased at the beginning, decreased from 32 °C, reached a minimum at 48 °C, rose rapidly to 80 °C, and then finally rose more slowly. This is due to the dissociation of the myosin light chain subunit S1 at 20–35 °C, resulting in cross-linking and an increase in G′.37 Then the myosin tail denatures and separates, which enhances molecular movement. After 48 °C, the myosin further denatures and aggregates, finally forming a stable gel.38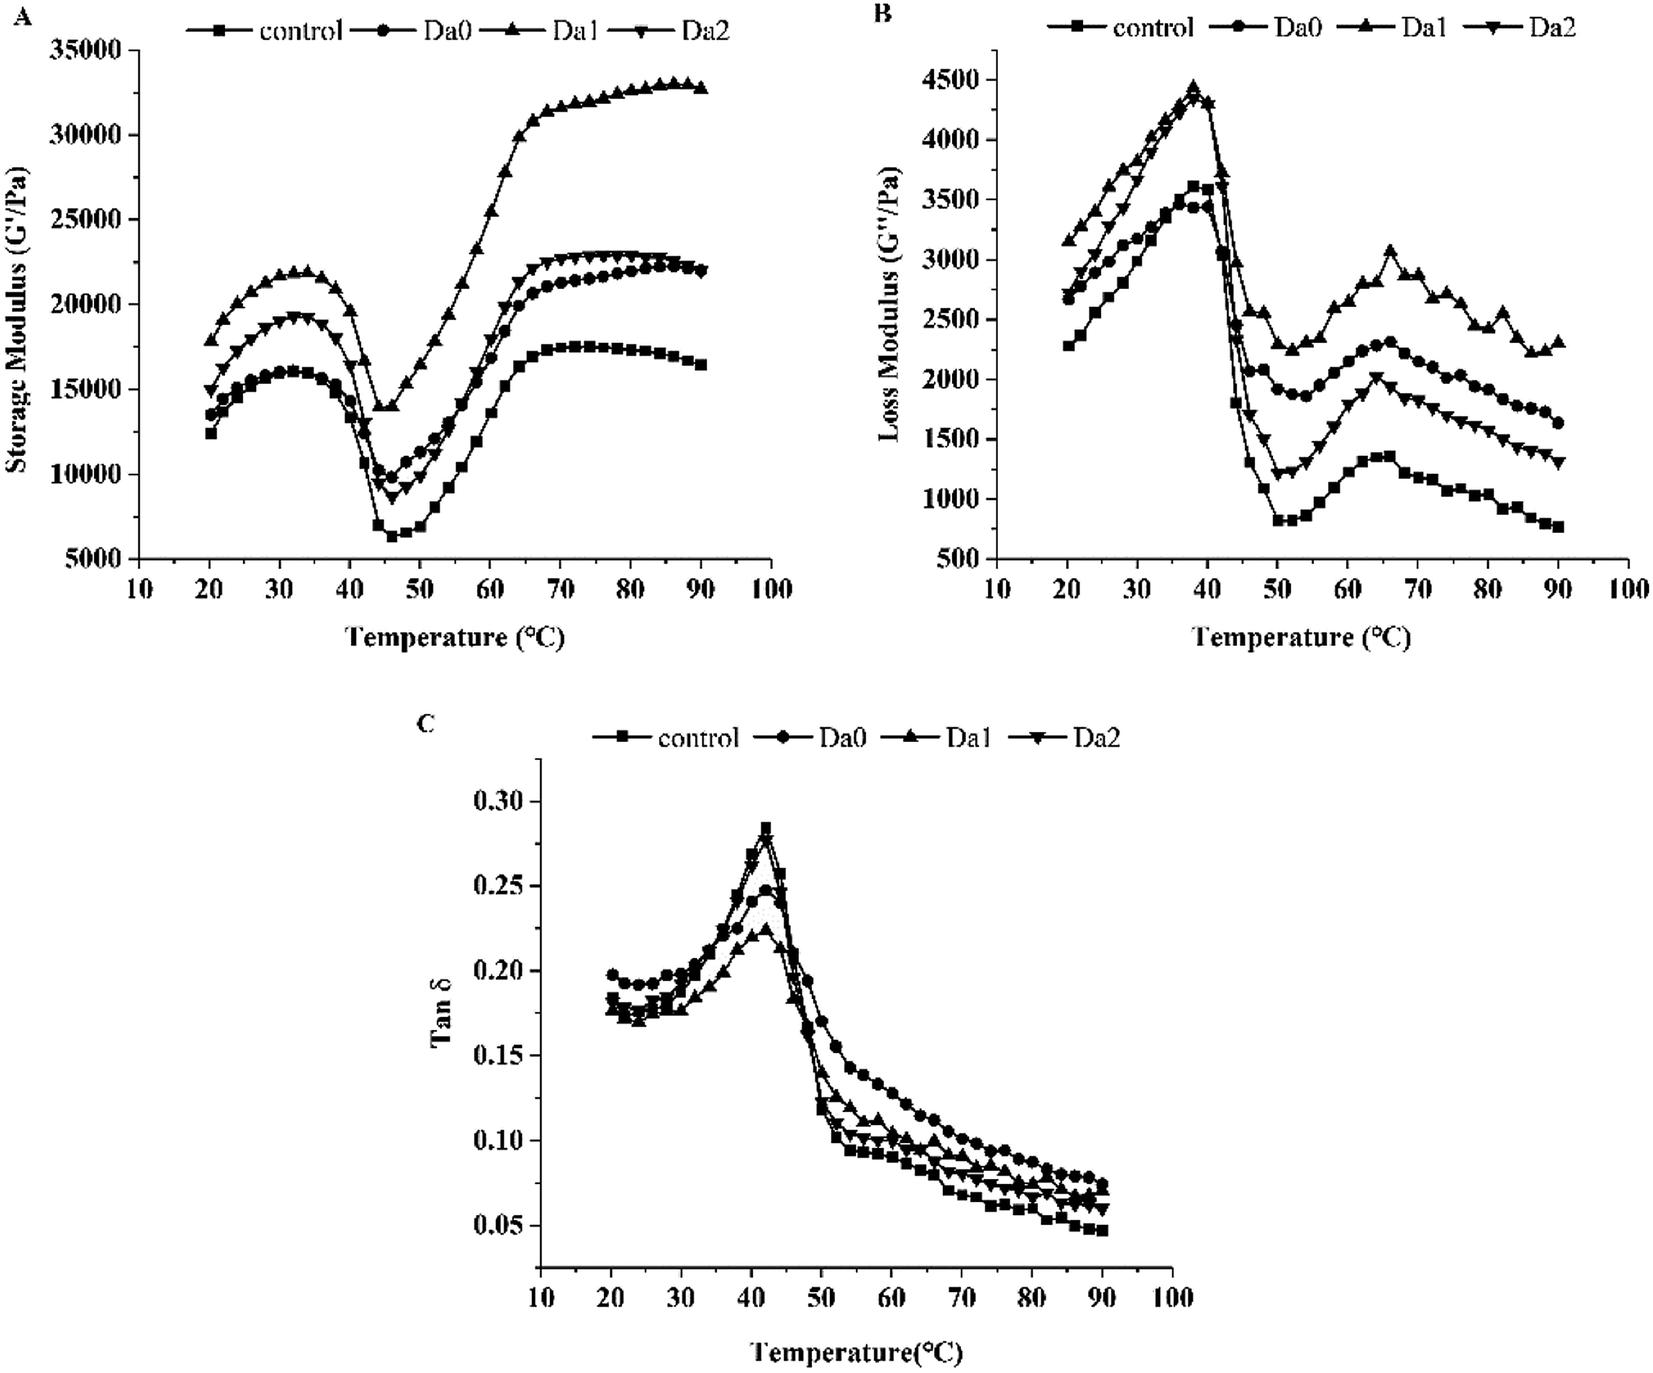 | ||
| Fig. 2 Effect of KGM with DDs on the rheological behavior of surimi. (A) Changes of G′ with temperature; (B) changes of G′′ with temperature; (C) changes of tanδ with temperature. Da0: KGM; Da1: DKGM1, DD% = 63.29% ± 0.46; Da2: DKGM2, DD% = 94.50 ± 0.41. | ||
In general, the curves of G′′ of the surimi were similar with G′ (Fig. 2B). The G′′ increased until 38 °C, then decreased sharply to the minimum at 50 °C. Subsequently, G′′ increased continually up to 65 °C before declining again owing to cross-linking.39
Besides G′ and G′′, KGM with different DDs also improved the tanδ. As depicted in Fig. 2C, the tanδ of the mixed surimi were less than 1.0, because G′ values were higher than G′′ values. Therefore, the surimi exhibited as an elastic fluid, with better gelation properties. The tanδ increased rapidly up to 45 °C, then dropped, which may be caused enhanced unfolding of the proteins and interaction between unfolded proteins with water molecules at low temperature (before 45 °C). Moreover, the protein structure rearranged with further denaturation and aggregation of protein during higher temperature heating, which resulted in enhanced rigidity and intensity, but weakened mobility. Consequently, the tanδ decreased.35
The slope of G′ versus temperature (50–65 °C) indicates the gelation rate of the surimi with KGM or DKGM. The gelation rates of the control, KGM, DKGM1 and DKGM2 were 667, 624, 958 and 814 Pa °C−1, respectively. Compared with the control, KGM decreased the gelation rate of surimi, however, the gelation rate of surimi with DKGM increased, meaning an increase in the aggregation rate of protein. When added into the surimi, KGM was dissolved in water and the molecular chains of KGM were intertwined, which strengthened the interaction between KGM chains. At the same time, the interactions between KGM and water molecules were strengthened, leading to an increase in the internal water content of the surimi gel. KGM might delay protein denaturation and change the relative rate of proteins denaturation and aggregation due to an increase in the bound water of the proteins. The increase of G′ and G′′ indicated that the KGM was beneficial to protein molecular cross-linking and the formation of surimi gel. With the removal of acetyl groups, the DKGM molecules intertwined strongly and became orderly, which made the stability of DKGM increase. In addition, compared to that of KGM, the internal water content of the surimi gel decreased with the addition of DKGM, which relatively weakened the rate of delaying the proteins denaturation because the bond water decreased., DKGM1 affected the rate of protein unfolding and aggregation with increasing temperature, and promoted the elastic deformation and cross-linking of the mixed gel. Finally, G′ and G′′ of the mixed sample of surimi and DKGM1 reached the maximum. This result indicated that the DKGM1 made the protein unfold and aggregate at a suitable speed, which was more conducive to the formation of a good three-dimensional network. Meanwhile, DKGM2 relatively decreased the G′ and G′′ of the surimi owing to the strong hydrophobic interaction of DKGM, and thereby affected the viscoelasticity and gel structure of the surimi proteins. Jia, You, Hu, Liu and Xiong (2015) reported that 60 mM CaCl2 improved the gelation rate of myosin, and allowed myosin to have suitable denaturation and aggregation, resulting in the formation of a good gel.40
3.3. Protein solubility of the surimi gels
Fig. 3 shows the effects of KGM with DDs on the solubility of surimi proteins, ionic bonds, hydrogen bonds and hydrophobic interactions. The ionic bonds of the surimi gels with KGM and DKGM1 were higher than that of the pure surimi, but the ionic bonds within the surimi gel with DKGM2 were not. Meanwhile, hydrogen bonds within the surimi with KGM or DKGM were lower than that of pure surimi. Hydrophobic interactions within surimi gels were influenced by KGM or DKGM. The hydrophobic interactions of the surimi gel with KGM was the lowest, however, that of the surimi gel with added DKGM increased with the increase of DD of KGM.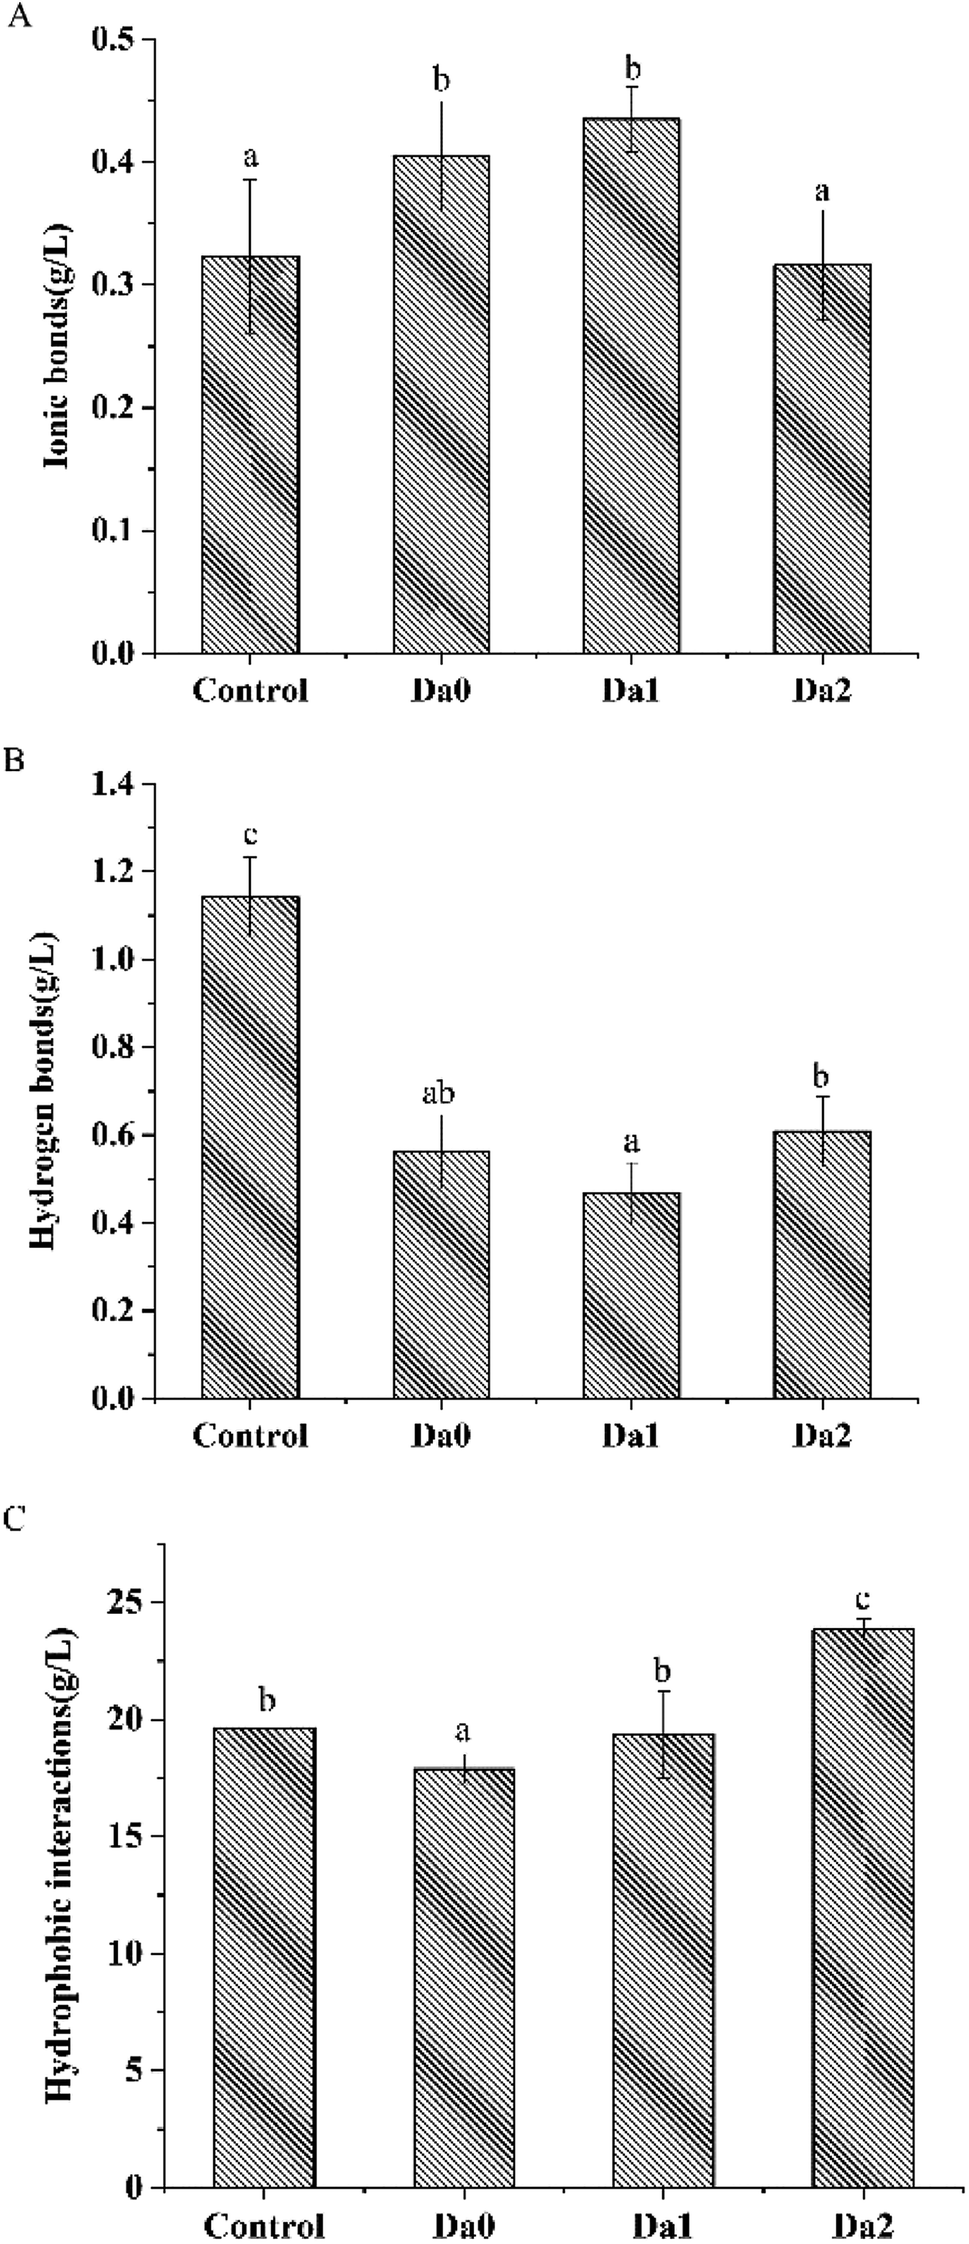 | ||
| Fig. 3 Effect of KGM with DDs on ionic bonds (A), hydrogen bonds (B), hydrophobic interactions (C) of the surimi gels. Means with different letters were significantly different at P < 0.05. Da0: KGM; Da1: DKGM1, DD% = 63.29% ± 0.46; Da2: DKGM2, DD% = 94.50 ± 0.41. | ||
The positively- and negatively-charged amino acid residues in adjacent protein molecules form ionic bonds due to charge anisotropy. An increase in ionic bonds suggested the KGM with DDs might change the charge distribution sites of amino acids. Hydrogen bonds are an important force in maintaining the folding structure of the protein.41 During heating, the hydrogen bonds between the carbonyl group and the amino group within the protein chain were destroyed, consequently the helical structure of protein unwound. The KGM had a stronger ability to bind water due to the presence of acetyl groups, so that the protein could not fully expand to form hydrogen bonds with water, eventually leading to a decrease in hydrogen bonds. DKGM may affect the destruction of hydrogen bonds between the carbonyl group and the amino acid residues of protein. Hydrophobic interactions were the main driving force to induce the aggregation of proteins. On one hand, the binding of KGM with DDs and water changed the water environment around the proteins, or KGM might behave as a filler in composite gel that affected the exposure and aggregation of the hydrophobic amino acid residues of the proteins.29 On the other hand, KGM could form an irreversible gel after the removal of the acetyl group, and improved hydrophobic interactions between DKGM molecules. The increasing hydrophobic interactions of KGM had an influence on the relative rate of the proteins unfolding and aggregation, especially DKGM. The results indicated that the deacetylation of KGM lead to an increase in hydrophobicity, which increased the hydrophobic interaction of proteins and contributed to promoting the aggregation of proteins.
3.4. FT-IR spectroscopy
The infrared spectrums of the surimi gels with different deacetylation KGM are shown in Fig. 4. Normally, the amide bands are located in the range 1700–1500 cm−1, including the amide I band (1700–1600 cm−1) arising from C![[double bond, length as m-dash]](https://www.rsc.org/images/entities/char_e001.gif) O stretching vibration, and the amide II band (1600–1500 cm−1) assigned to N–H bending vibration and C–N stretching vibration. Secondary structure changes of myofibrillar protein are extremely sensitive in the amide I band. Bands near 1650–1660 cm−1, 1600–1640 cm−1 and 1640–1650 cm−1 represent α-helical structures, β-sheet structures, and random coil structures, respectively. In Fig. 4, the absorption peak of the control in the amide region was at 1654 cm−1, and shifted to 1655 cm−1, 1650 cm−1, and 1652 cm−1 with the addition of KGM, DKGM1 and DKGM2, respectively. This indicates that the DKGM changed the secondary structure of the proteins and made α-helical structure convert to random coil structure. This result suggests that DKGM enhanced the unfolding of proteins, which may promote the exposure of hydrophobic residues and intermolecular hydrophobic interactions of proteins.42 As a result, the rate of protein aggregation increased.
O stretching vibration, and the amide II band (1600–1500 cm−1) assigned to N–H bending vibration and C–N stretching vibration. Secondary structure changes of myofibrillar protein are extremely sensitive in the amide I band. Bands near 1650–1660 cm−1, 1600–1640 cm−1 and 1640–1650 cm−1 represent α-helical structures, β-sheet structures, and random coil structures, respectively. In Fig. 4, the absorption peak of the control in the amide region was at 1654 cm−1, and shifted to 1655 cm−1, 1650 cm−1, and 1652 cm−1 with the addition of KGM, DKGM1 and DKGM2, respectively. This indicates that the DKGM changed the secondary structure of the proteins and made α-helical structure convert to random coil structure. This result suggests that DKGM enhanced the unfolding of proteins, which may promote the exposure of hydrophobic residues and intermolecular hydrophobic interactions of proteins.42 As a result, the rate of protein aggregation increased.
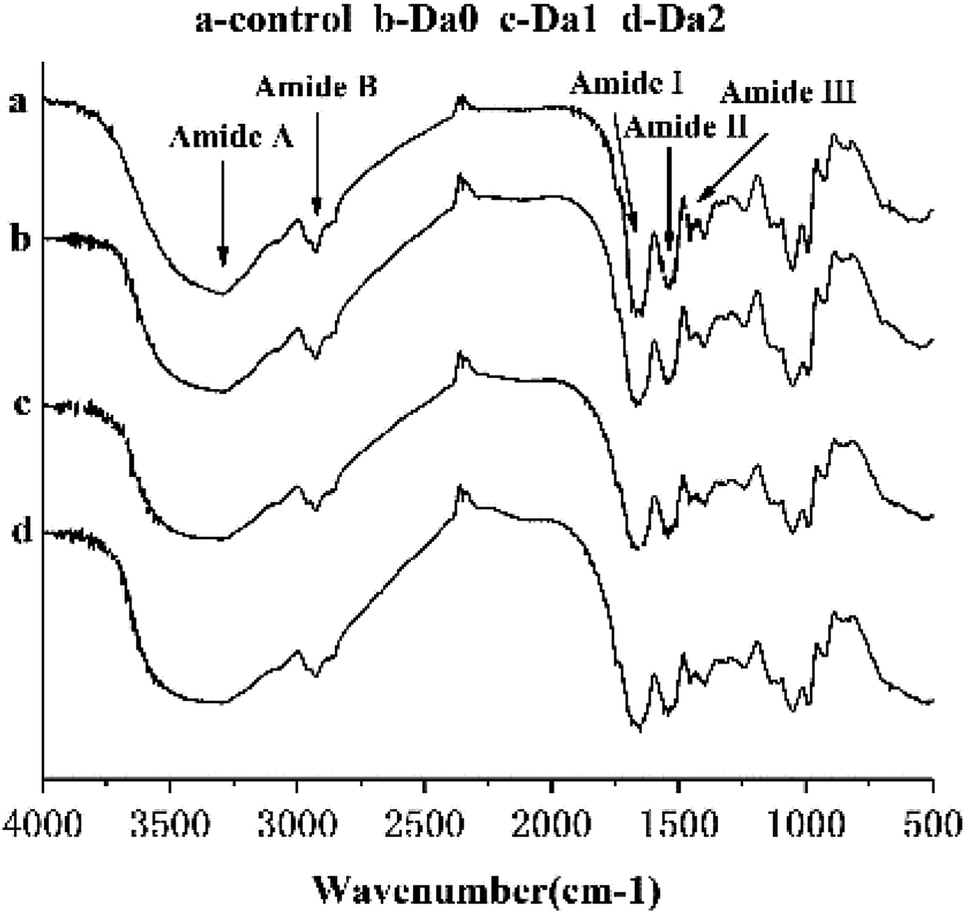 | ||
| Fig. 4 FT-IR spectra of surimi gels with the addition of KGM with DDs. Da0: KGM; Da1: DKGM1, DD% = 63.29% ± 0.46; Da2: DKGM2, DD% = 94.50 ± 0.41. | ||
Tyrosine residues have characteristic absorption peaks at 830 cm−1 and 850 cm−1, and are affected by the environment and hydroxyl groups.43 The ratio of the two peak intensities (I850/830) can indicate the state of tyrosine in the protein molecule. Compared with control, the I850/830 ratios of mixed gels with DKGM1 and DKGM2 increased, and were in the range of 0.9 and 1.45, which suggests that tyrosine residues were exposed in a polar environment or as donors and receptors of weak hydrogen bonds.44
In general, the addition of KGM with DDs slightly changed the characteristic absorption peaks of surimi gels, but did not produce new absorption peaks.
3.5. SDS-PAGE
The salt-soluble protein components of mixed surimi gels were analyzed by SDS-PAGE, including myosin heavy chains (MHC, 200 kDa), actin (44 kDa), and myosin light chains (MLC, 20 kDa) in myofibrillar protein.45 Myosin is the key protein in the formation of network structures in surimi gels. The crosslinking of MHC through covalent bonds is able to promote the formation of surimi gels. The effects of KGM with DDs on protein components are shown in Fig. 5. In comparison with the control (lane 1), the molecular weights of MHC and actin had no significant changes with the increasing DDs of KGM (lane 2, 3 and 4), but MHC band intensity increased with the addition of KGM with DDs. Furthermore, the band intensity of actin clearly increased. Zhang et al. (2016) reported the MHC band intensity of deacetylated KGM samples improved after 120 °C heating owing to the cross-linking between KGM and protein.17 Yasui and Samejima (1990) suggested a heat-induced gel strength of a myosin–actin system (typical of meat or surimi).46 Actin was reported to have a synergistic role in the gelation of myofibrillar proteins.47,48 The optimal weight ratio of myosin to actin that yields the highest shear modulus (rigidity) is 15:1. The complex formed between F-actin and myosin seemed to behave as a cross-link between the rods of myosin molecules, and consequently increased the rigidity of the gel. Therefore, the aggregation and the three-dimensional network structure of proteins in surimi with DKGM were influenced by the denaturation of proteins and the ratio of undenatured myosin to natural actin.
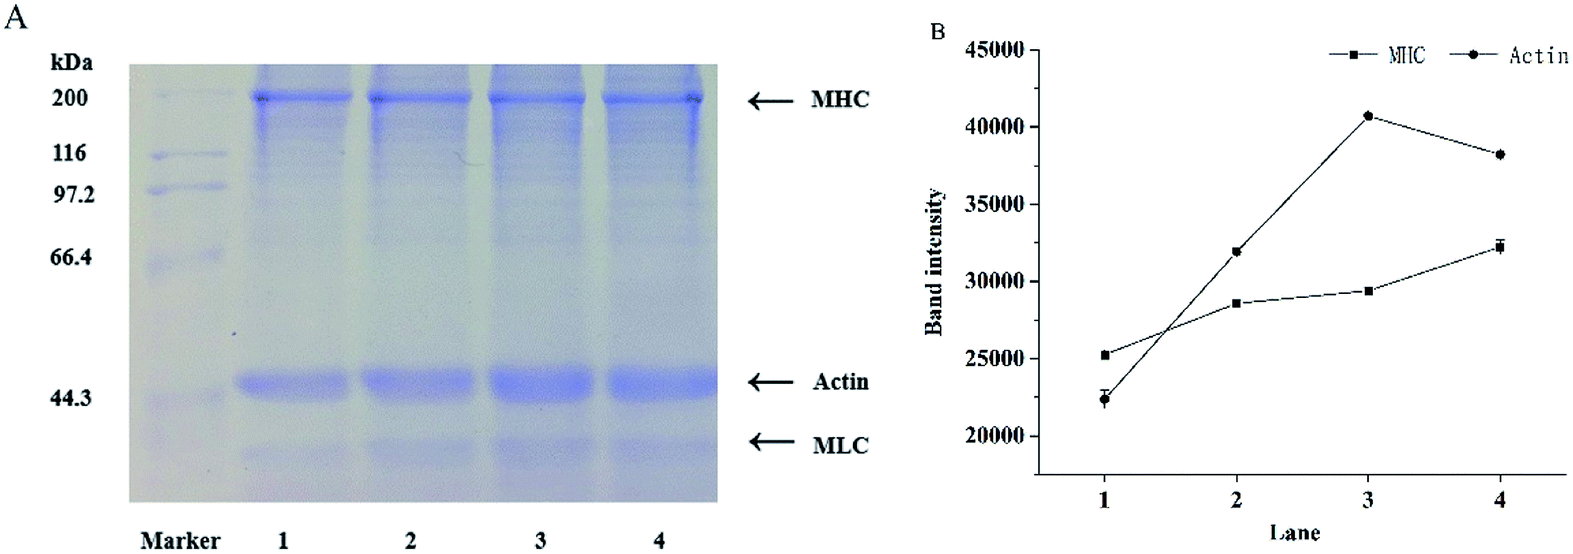 | ||
| Fig. 5 SDS-PAGE patterns (A) and corresponding bond intensity (B) of surimi gels with the addition of KGM with DDs. Lane 1: control; 2: Da0, KGM; 3: Da1, DKGM1, DD% = 63.29% ± 0.46; 4: Da2, DKGM2, DD% = 94.50 ± 0.41. MHC: myosin heavy chains; MLC: myosin light chains. | ||
3.6. Microstructure of mixed gels
The microstructures of the mixed gels with the DDs of KGM are shown in Fig. 6. All the samples had a network structure, indicating that the gels possessed elastic characteristics. These results were consistent with those reported in Lin et al.49 However, the morphologies of the mixed gels were different and related to the degrees of deacetylation of KGM. The gel structure of the control was loose and rough. Moreover, the sizes of holes were not uniform, and the distribution was irregular. The mean pore diameter of the control was 3.85 ± 0.06 μm. With the increasing DDs of KGM, the mean pore diameters of KGM and DKGM1 were 2.95 ± 0.13 μm and 3.19 ± 0.13 μm, respectively. Compared with the control, the mean pore diameter of the gels with KGM and DKGM1 decreased and the frames of the gels became more compact and dense. While, the gel containing DKGM2 had more sizable holes, and the mean pore diameter was 4.00 ± 0.27 μm. The mean pore diameter of the gel with DKGM2 increased, but the gel exhibited more cascaded mesh structures, and the structure became more fibrous and fragile. The water-holding capacity of the gel was related to the pore size in the network, and smaller pores tended to retain water held mainly by capillary pressure.50 This result of SEM was consistent with that for WHC. The proteins denatured and unfolded, then the interaction forces changed during heating, resulting in the formation of aggregates.51,52 The size, distribution and shape of the aggregates constituted the microstructure of the surimi gels. Therefore, this result suggested that the DKGM influenced protein unfolding and changed the interaction force, resulting in the formation of better aggregates and network structure. Fig. 6 shows that KGM and DKGM combined around the filaments of myofibrillar proteins like rosary. As above discussion, under alkaline conditions, after removal of the acetyl group, KGM can form a gel. Therefore, during the gel formation of myofibrillar proteins, KGM combined around the myofibrillar proteins primarily through hydrogen bonds. However, DKGM1 might interact with myofibrillar proteins through hydrogen bonds and hydrophobic interaction. Meanwhile, DKGM2 mainly interact with myofibrillar proteins through hydrophobic interaction.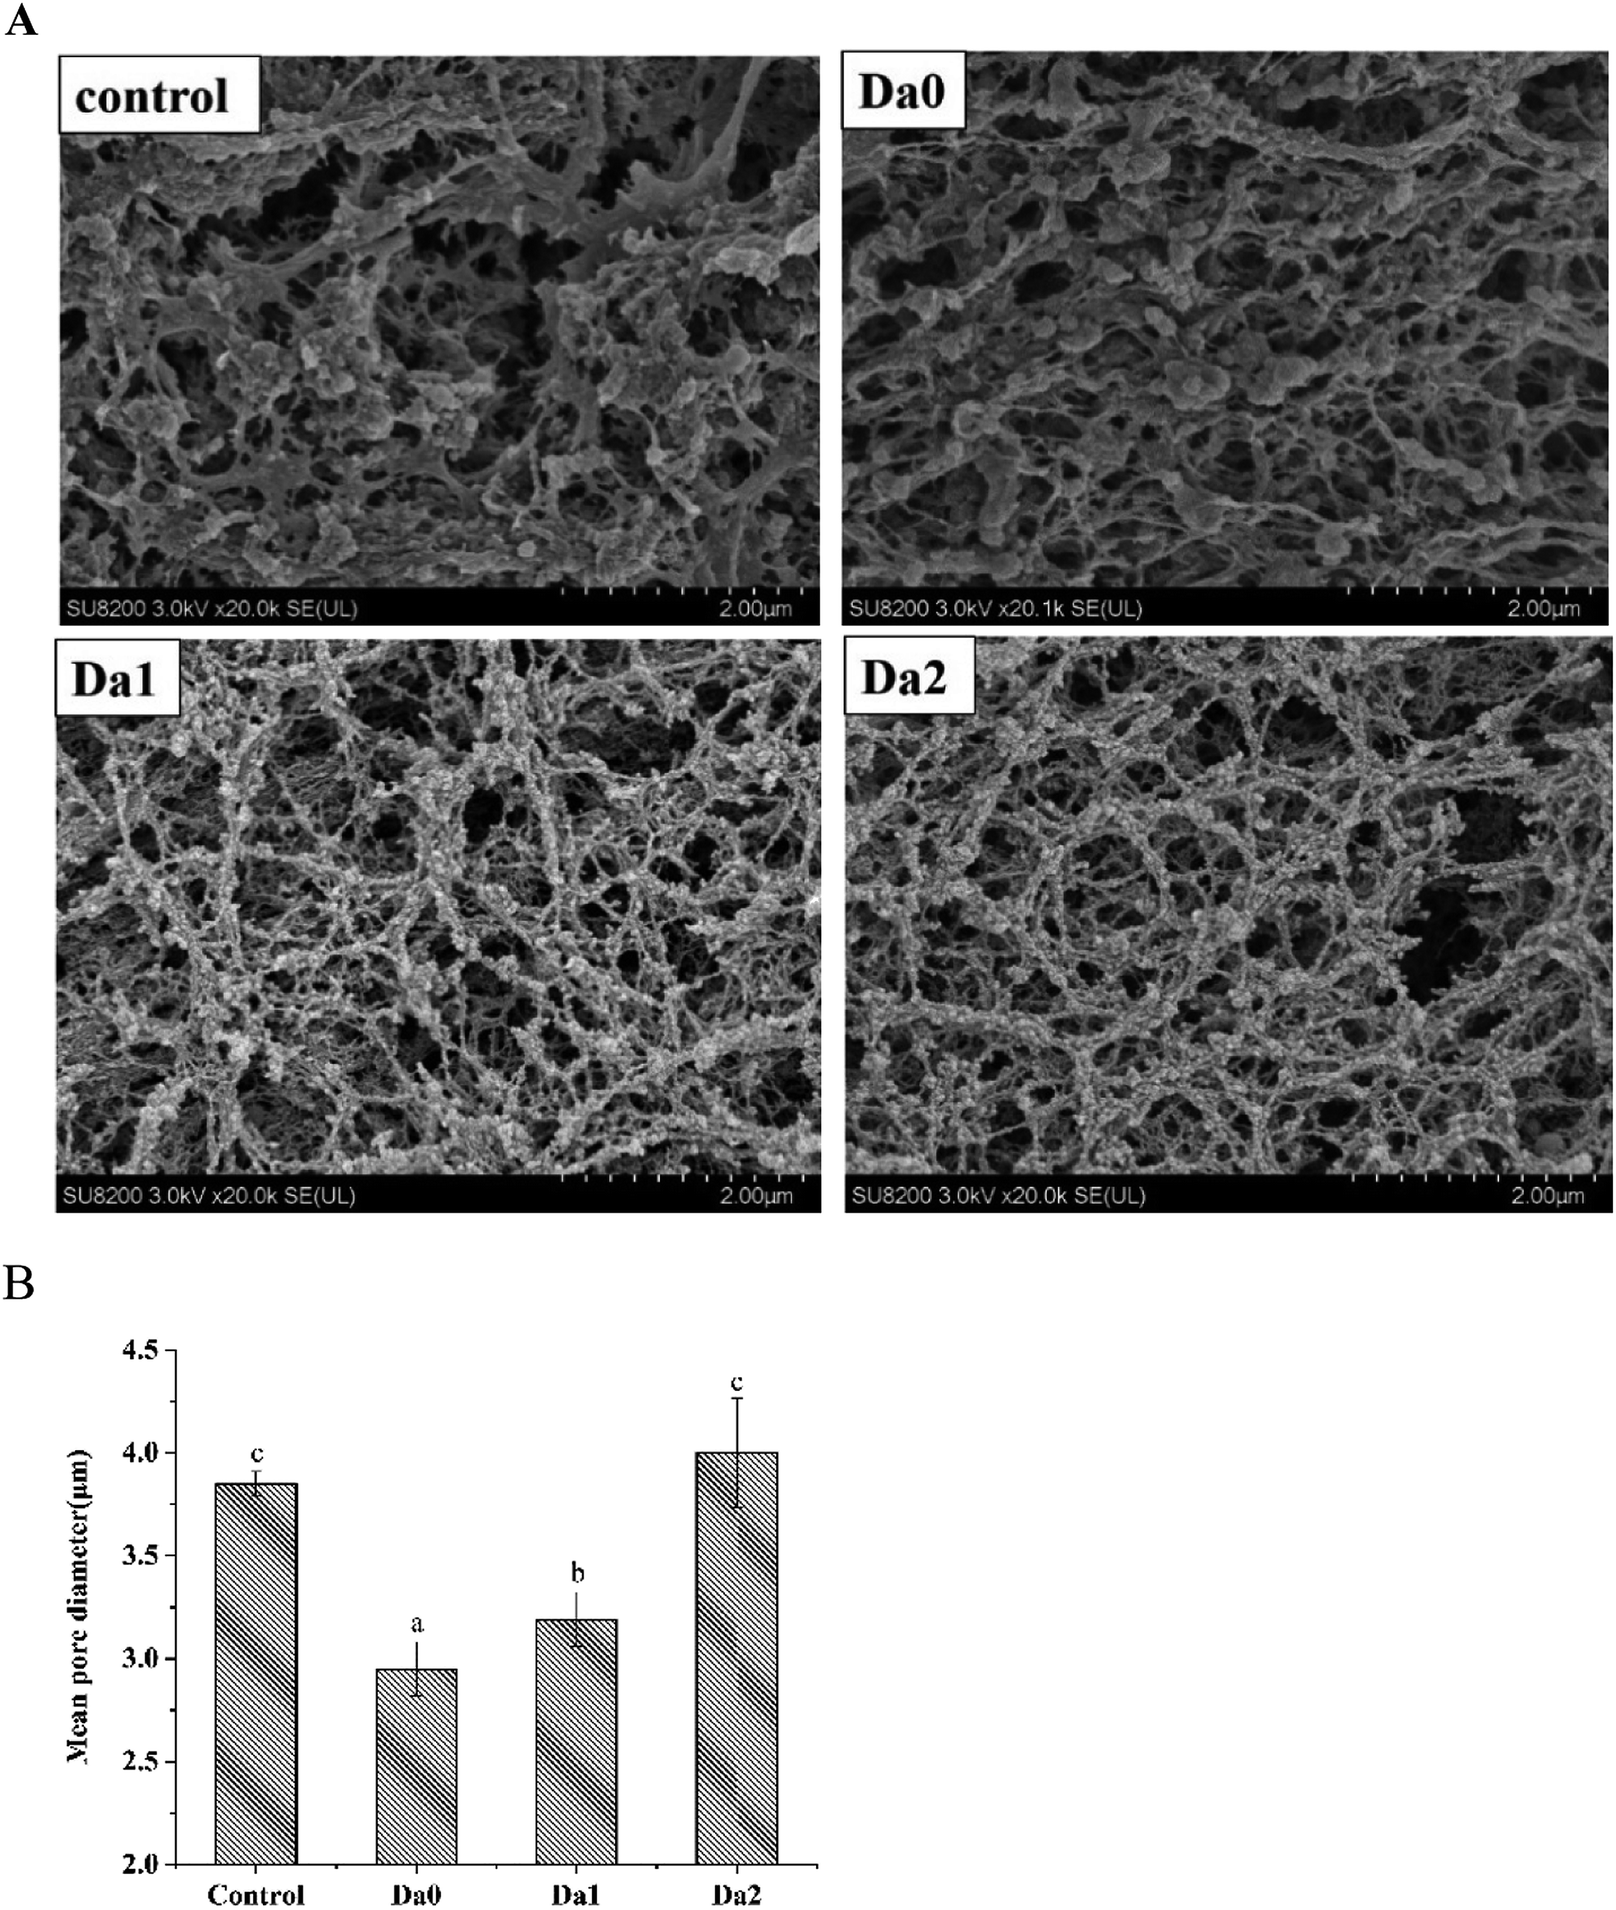 | ||
| Fig. 6 Effect of KGM with DDs on the microstructure (A) observed by SEM and mean pore diameter (B) of surimi gels measured by image analysis. Means with different letters were significantly different at P < 0.05. Da0: KGM; Da1: DKGM1, DD% = 63.29% ± 0.46; Da2: DKGM2, DD% = 94.50 ± 0.41. | ||
4. Conclusion
DKGM significantly increased the gel strength and viscoelasticity of silver carp surimi. Compared with KGM, the deacetylation of KGM weakened water-holding capacity due to the increased hydrophobic interaction of the mixed surimi gels. The removal of acetyl groups had an influence on the combination between of KGM/DKGM and proteins. DKGM enhanced the hydrophobic interaction of proteins, which resulted in a more compact and denser network structure of gels. These results indicated that the interactions and the cross-linking between protein molecules were promoted by DKGM through altering proteins aggregation. Moreover, these results also showed that DKGM may be applied to freshwater fish surimi products for high-quality.Conflicts of interest
There are no conflicts to declare.Acknowledgements
This study was funded by the National Natural Science Foundation of China [No. 31671882, 31471611].References
- C. A. Bentis, A. Zotos and D. Petridis, J. Food Eng., 2005, 68, 303–308 CrossRef.
- H. M. Moreno, B. Herranz, M. Pérez-Mateos, I. Sánchez-Alonso and J. A. Borderías, Crit. Rev. Food Sci. Nutr., 2016, 56, 237–248 CrossRef CAS PubMed.
- Y. K. Luo, R. Kuwahara, M. Kaneniwa, Y. Murata and M. Yokoyama, J. Food Sci., 2001, 66, 548–554 CrossRef CAS.
- R. Liu, S. M. Zhao, B. J. Xie and S. B. Xiong, Food Hydrocolloids, 2011, 25, 898–906 CrossRef CAS.
- H. J. Alipour, M. Rezaei, B. Shabanpour and M. Tabarsa, Food Hydrocolloids, 2018, 74, 87–96 CrossRef CAS.
- M. A. Iglesias-Otero, J. Borderías and C. A. Tovar, J. Food Eng., 2010, 101, 281–288 CrossRef CAS.
- J. H. Liu, Y. H. Luo, S. Q. Gu, Q. H. Xu, J. J. Zhang, P. C. Zhao and Y. T. Ding, Food Hydrocolloids, 2017, 72, 136–144 CrossRef CAS.
- J. Chen, W. Zhang and X. Li, Polym. Bull., 2015, 73, 1965–1984 CrossRef.
- K. Kato and K. Matsuda, Agric. Biol. Chem., 1972, 36, 639–644 CAS.
- X. Z. Du, J. Li, J. Chen and B. Li, Food Res. Int., 2012, 46, 270–278 CrossRef CAS.
- L. Huang, R. Takahashi, S. Kobayashi, T. Kawase and K. Nishinari, Biomacromolecules, 2002, 3, 1296–1303 CrossRef CAS PubMed.
- M. A. Williams, T. J. Foster, D. R. Martin, I. T. Norton, M. Yoshimura and K. Nishinari, Biomacromolecules, 2000, 1, 440–450 CrossRef CAS PubMed.
- W. J. Jian, K. C. Siu and J. Y. Wu, Carbohydr. Polym., 2015, 134, 285–292 CrossRef CAS PubMed.
- J. Liu, X. Wang and Y. Ding, Carbohydr. Polym., 2013, 92, 484–489 CrossRef CAS PubMed.
- D. Yang, Y. Yuan, L. Wang, X. S. Wang, R. J. Mu, J. Pang, J. B. Xiao and Y. F. Zheng, Int. J. Mol. Sci., 2017, 18, 2250 CrossRef PubMed.
- W. Jian, H. Y. Wu, L. L. Wu, Y. H. Wu, L. N. Jia, J. Pang and Y. M. Sun, Carbohydr. Polym., 2016, 150, 21–31 CrossRef CAS PubMed.
- T. Zhang, Z. J. Li, Y. M. Wang, Y. Xue and C. H. Xue, Food Res. Int., 2016, 83, 152–161 CrossRef CAS.
- J. H. Liu, C. H. Fang, X. Xu, Q. Su, P. C. Zhao and Y. T. Ding, Food Chem., 2019a, 291, 223–230 Search PubMed.
- J. H. Liu, C. H. Fang, X. Xu, Q. Su, P. C. Zhao and Y. T. Ding, Food Hydrocolloids, 2019b, 91, 275–282 Search PubMed.
- Z. G. Chen, M. H. Zong and G. J. Li, Process Biochem., 2006, 41, 1514–1520 CrossRef CAS.
- M. Wu, Y. L. Xiong, J. Chen, X. Tang and G. Zhou, J. Food Sci., 2009, 74, E207–E217 CrossRef CAS PubMed.
- S. Phatcharat, S. Benjakul and W. Visessanguan, Food Chem., 2006, 98, 431–439 CrossRef CAS.
- R. Liu, S. M. Zhao, Y. M. Liu, H. Yang, S. B. Xiong, B. J. Xie and L. H. Qin, Food Chem., 2010, 121, 196–202 CrossRef CAS.
- W. Kauzmann, Adv. Protein Chem., 1959, 14, 1–63 CrossRef CAS PubMed.
- M. C. Gómez-Guillén, A. J. Borderías and P. Montero, LWT--Food Sci. Technol., 1997, 30, 602–608 CrossRef.
- O. H. Lowry, N. J. Rosebrough, A. L. Farr and R. J. Randall, J. Biol. Chem., 1951, 193, 265–275 CAS.
- U. K. Laemmli, Nature, 1970, 227, 680–685 CrossRef CAS PubMed.
- T. Hayakawa, Y. Yoshida, M. Yasui, T. Ito, T. Iwasaki, J. Wakamatsu, A. Hattori and T. Nishimura, Meat Sci., 2012, 90, 77–80 CrossRef CAS PubMed.
- T. Zhang, Y. Xue, Z. J. Li, Y. M. Wang and C. H. Xue, Food Hydrocolloids, 2015, 43, 125–131 CrossRef CAS.
- J. T. Tobin, S. M. Fitzsimons, C. Valérie, A. L. Kelly and M. A. Fenelon, Food Hydrocolloids, 2012, 27, 201–207 CrossRef CAS.
- J. Chen, J. Li and B. Li, Carbohydr. Polym., 2011, 86, 865–871 CrossRef CAS.
- S. J. Gao and K. Nishinari, Colloids Surf., B, 2004, 38, 241–249 CrossRef CAS PubMed.
- L. Yuan, Q. L. Dang, J. L. Mu, X. P. Feng and R. C. Gao, Int. J. Food Prop., 2018, 21, 834–848 CAS.
- M. Ogawa, T. Ehara, T. Tamiya and T. Tsuchiya, Comparative Biochemistry and Physiology Part B: Comparative Biochemistry, 1993, 106, 517–521 CrossRef.
- J. A. Ramírez, R. M. Uresti, G. Velazquez and M. Vazquez, Food Hydrocolloids, 2011, 25, 1842–1852 CrossRef.
- G. Q. Xiong, W. Cheng, L. X. Ye, X. Du, M. Zhou, R. T. Lin, S. R. Geng, M. Chen, H. Corkecet and Y. Z. Cai, Food Chem., 2009, 116, 413–418 CrossRef CAS.
- M. J. Cao, L. L. Wu, K. Hara, L. Weng and W. J. Su, J. Food Biochem., 2005, 29, 533–546 CrossRef CAS.
- R. Liu, S. M. Zhao, S. B. Xiong, B. J. Xie and H. M. Liu, J. Food Sci., 2007, 72, E399–E403 CrossRef CAS PubMed.
- L. Shi, X. F. Wang, T. Chang, C. J. Wang, H. Yang and M. Cui, LWT--Food Sci. Technol., 2014, 57, 586–593 CrossRef CAS.
- D. Jia, J. You, Y. Hu, R. Liu and S. B. Xiong, Food Chem., 2015, 185, 212–218 CrossRef CAS PubMed.
- T. Sano, T. Ohno, H. Otsuka-Fuchino, J. J. Matsumoto and T. Tsuchiya, J. Food Sci., 1994, 59, 1002–1008 CrossRef CAS.
- L. Yuan, Y. A. Liu, J. Ge, X. P. Feng and R. C. Gao, CyTA--J. Food, 2017, 15, 574–581 CrossRef CAS.
- E. Li-Chan, S. Nakai and M. Hirotsuka, Protein Structure-Function Relationships in Foods, Springer, 1994, pp. 163–197 Search PubMed.
- F. Badii and N. K. Howell, Food Hydrocolloids, 2006, 20, 630–640 CrossRef CAS.
- N. Blanco-Pascual, F. Fernández-Martín and M. P. Montero, Food Hydrocolloids, 2013, 33, 118–131 CrossRef CAS.
- T. Yasui and K. Samejima, Jpn. Agric. Res. Q., 1990, 24, 131–137 CAS.
- M. Ishioroshi, K. Samejima, Y. Arie and T. Yasui, Agric. Biol. Chem., 1980, 44, 2185–2194 CAS.
- T. Yasui, M. Ishioroshi and K. Samejima, Agric. Biol. Chem., 1982, 46, 1049–1059 CAS.
- X. P. Lin, W. G. Yang, D. L. Xu, Z. Jie and W. Liu, Radiat. Phys. Chem., 2015, 110, 1–5 CrossRef CAS.
- W. Liu, T. C. Laniera and J. A. Osborne, Meat Sci., 2016, 111, 67–77 CrossRef CAS PubMed.
- T. Kaewmanee, S. Benjakul and W. Visessanguan, J. Food Sci., 2011, 76, S139–S147 CrossRef CAS PubMed.
- A. Totosaus, G. José Montejano, J. A. Salazar and I. Guerrero, Int. J. Food Sci. Technol., 2010, 37, 589–601 CrossRef.
Footnote |
| † These authors contributed equally to this work. |
| This journal is © The Royal Society of Chemistry 2019 |