 Open Access Article
Indium sulfide nanotubes with sulfur vacancies as an efficient photocatalyst for nitrogen fixation
Zhiyi He,
Yu Wang*,
Xiaoli Dong *,
Nan Zheng,
Hongchao Ma and
Xiufang Zhang
School of Light Industry and Chemical Engineering, Dalian Polytechnic University, #1 Qinggongyuan, Dalian 116034, P. R. China. E-mail: wang_yu@dlpu.edu.cn; dongxiaoli65@163.com
First published on 12th July 2019
Abstract
We have designed and manufactured In2S3 nanotubes containing sulfur vacancies as effective and stable photocatalysts for nitrogen fixation and ammonia production. In the preparation process of In2S3, a self-templated strategy was used to obtain the nanotubes. The sulfur vacancies were then manufactured by calcination under a nitrogen atmosphere. The existence of sulfur vacancies enhances the light absorption and promotes the separation and migration of the photoinduced charge carriers. In addition, sulfur vacancies can serve as the active sites to achieve strong N2 adsorption and activation. Thus the obtained samples show enhanced photocatalytic performance with a high NH3 generation rate (52.49 μmol h−1 g−1) and excellent stability under UV-vis light.
Introduction
Ammonia (NH3), as an extremely important raw material for synthesis of chemicals and fertilizers, is widely used in both industry and agriculture.1,2 From the outset, the traditional method of NH3 generation in industry has been the Haber–Bosch process, which is usually conducted under harsh reaction conditions (high temperature and high pressure).3–5 This process has a high energy consumption and hampers efforts toward energy conservation and environmental protection. Therefore, it is necessary to develop a method that can convert nitrogen into ammonia with low energy consumption and in a clean and safe manner.6,7 Among the many methods available at present, photocatalytic technology has received particular attention from researchers for its simplicity, efficiency and environment-friendly nature. Therefore, it is urgent to establish a catalytic reaction system using an efficient and green catalyst to convert N2 into NH3 at room temperature and pressure.Recently, photocatalytic nitrogen fixation has become the most favorable alternative technology to traditional industrial nitrogen fixation methods due to its merits of environmental friendliness, mild reaction conditions and low energy consumption.8–10 In 1977, Schrauzer et al. first reported that N2 could be reduced to NH3 over Fe-doped TiO2 under UV light.11 During the reaction, high-energy electrons generated by the semiconductor can activate N![[triple bond, length as m-dash]](https://www.rsc.org/images/entities/char_e002.gif) N and facilitate its dissociation, making the process of fixing N2 to NH3 feasible.12 Unfortunately, photocatalytic nitrogen fixation techniques using TiO2 are still dissatisfactory. On the one hand, TiO2 can only take advantage of the ultraviolet range of sunlight.13–15 On the other hand, the recombination of photogenerated electrons and holes makes it difficult to achieve higher photocatalytic efficiency. These disadvantages make it difficult to put photocatalytic nitrogen fixation into large-scale application. In order to solve these problems, a promising method is to synthesize visible light responsive photocatalysts and improve the generation and migration rate of carriers.16
N and facilitate its dissociation, making the process of fixing N2 to NH3 feasible.12 Unfortunately, photocatalytic nitrogen fixation techniques using TiO2 are still dissatisfactory. On the one hand, TiO2 can only take advantage of the ultraviolet range of sunlight.13–15 On the other hand, the recombination of photogenerated electrons and holes makes it difficult to achieve higher photocatalytic efficiency. These disadvantages make it difficult to put photocatalytic nitrogen fixation into large-scale application. In order to solve these problems, a promising method is to synthesize visible light responsive photocatalysts and improve the generation and migration rate of carriers.16
Among many materials with visible light response, indium sulfide (In2S3) has gained wide attention because of its high responsiveness, excellent photoelectric sensitivity and low toxicity.17–22 However, single-metal sulfides do not have satisfactory catalytic properties, mainly due to the separation of charge carriers, slow migration kinetics of charge carriers and low quantum efficiency.23,24 In order to solve these problems, one possible approach is to carry out surface defect engineering.25 Extensive research has been conducted on surface defect engineering, in which surface vacancy defects provide more active sites for materials and facilitate the chemical adsorption and activation of N2, thus improving the photocatalytic activity.26–28 There are many examples of sulfur vacancies and oxygen vacancies used in photocatalysts (e.g. MoS2, TiO2), which confirm that the presence of vacancies can significantly improve the photocatalytic properties of catalysts. After being modified, materials usually possess more hole–electron pairs, faster carrier transmission rates, and better photocatalytic performance. Therefore, it should be feasible to create sulfur vacancies in In2S3 to improve its photocatalytic properties.
To improve the photocatalytic performance, another effective method is to change the morphology of the material to improve its specific surface area and to increase the contact area with the reaction medium.29 Two-dimensional hollow nanotubes with high surface area are beneficial to reduce the diffusion distance of carriers and increase the contact area with the water medium in the reaction. In addition, the hollow space can also enhance the capture of photons by internal light scattering and reflection.30–33 As a new type of porous crystal materials, metal–organic frameworks (MOFs) are the preferred template.34,35 Because of their unique composition of metal clusters and organic bridges, they are promising templates for vulcanization in situ to obtain In2S3 catalysts that retain their 2D morphology. At the same time, due to the loss of organic linkers in the process of solvothermal treatment, a hollow structure is formed.
In this article, In2S3 hollow nanotubes were successfully prepared using MIL-68 (In) prism as a precursor via self-assembly technology. Subsequently, the as-prepared In2S3 nanotubes were annealed in a nitrogen atmosphere under different temperatures to form sulfur vacancies. The nitrogen fixation performance of the obtained samples was determined using deionized water as the medium under mild reaction conditions. The crystal structure, morphology, chemical element composition, optical and electrochemical properties of the as-obtained sulfide-vacancy-decorated In2S3 nanotubes were investigated. In the presence of sulfur vacancies, the photocatalytic properties show a significant improvement. Therefore, this work may indicate new directions and useful insights for the design of metal sulfide photocatalysts and their application for nitrogen fixation.
Experimental
Materials and reagents
Indium nitrate (In(NO3)3·xH2O) and 1,4-benzenedicarboxylic acid (H2BDC) were supplied by Aladdin Reagent Co., Ltd. (Shanghai, China). Thiourea was obtained from Tianjin Bodi Chemical Co., Ltd. N,N-Dimethylformamide (DMF) was supplied by Sinopharm Chemical Reagent Co., Ltd. (Shanghai, China), and absolute ethanol (EtOH, 99.7%) was obtained from Tianli Chemical Reagent Co., Ltd. (Tianjin, China). All reagents and solvents were used as received without further purification.Materials characterization
The transmission electron microscopy (TEM) analyses were performed by a JEOL JEM-2100F transmission electron microscope. Scanning electron microscopy (SEM) images were taken using a field emission scanning electron microscope (JSM-7800F, JEOL). The crystallinity and the purity of the as-prepared samples were characterized by powder X-ray diffraction (XRD) analysis on a Shimadzu XRD-6100 diffractometer at 40 kV and 40 mA with Cu Kα radiation. Light absorption properties were evaluated by UV-vis diffuse reflectance spectroscopy (UV-vis DRS, CARY 100&300, VARIAN), for which BaSO4 was used as a reflectance standard. The photoluminescence (PL) spectra of the photocatalysts were acquired using a Hitachi F-7000 fluorescence spectrophotometer. Electron spin resonance (ESR) spectra were recorded on a JES-FA200 electron spin resonance spectrometer operating at room temperature. Nitrogen temperature-programmed desorption experiments (N2-TPD) were performed by a NOVA 2000e Surface Area & Pore Size Analyzer. X-ray photoelectron spectroscopy (XPS) spectra were conducted on a VG Scientific ESCALAB 250 XPS instrument.Photocatalytic activity measurements
All the photocatalytic N2 fixation experiments were conducted in a sealed quartz reactor under UV-vis light irradiation by a 300 W Xe lamp (PLS-SXE 300, Beijing Perfect Light Co., Ltd.). Typically, 20 mg of catalysts was dispersed in 100 mL of ultrapure water in a quartz reactor, which was equipped with a water circulator. The mixture solution was stirred in the dark with pure N2 bubbled at a flow rate of 80 mL min−1 for 30 min to reach adsorption equilibrium. In the reaction process, 5 mL of reaction solution was taken out every 30 min and the catalyst was further removed through centrifugation. Throughout this reaction, the temperature of the reaction system was kept at 15 °C. The concentration of product was detected using the Nessler's reagent method at 420 nm with an optical power meter (SDPTOP, UV2800S).Electrode preparation and electrochemical characterization
Electrochemical and photochemical measurements of the samples were performed with a standard three-electrode setup (CHI760E Instruments). For working electrode modification, 5 mg catalyst and 10 μL Nafion solution (5 wt%) were dispersed in a 3 mL volume ratio of 1![[thin space (1/6-em)]](https://www.rsc.org/images/entities/char_2009.gif) :
:![[thin space (1/6-em)]](https://www.rsc.org/images/entities/char_2009.gif) 3 water–ethanol solution. After 20 minutes of ultrasonication, a 5 μL aliquot of the mixture solution was pipetted onto the glassy carbon electrode to achieve catalyst loading, and finally dried at room temperature. Before the measurements, the Na2SO4 solution was purged with Ar gas for 30 min to remove the dissolved molecular oxygen, and purging was continued during the measurements.
3 water–ethanol solution. After 20 minutes of ultrasonication, a 5 μL aliquot of the mixture solution was pipetted onto the glassy carbon electrode to achieve catalyst loading, and finally dried at room temperature. Before the measurements, the Na2SO4 solution was purged with Ar gas for 30 min to remove the dissolved molecular oxygen, and purging was continued during the measurements.
Results and discussion
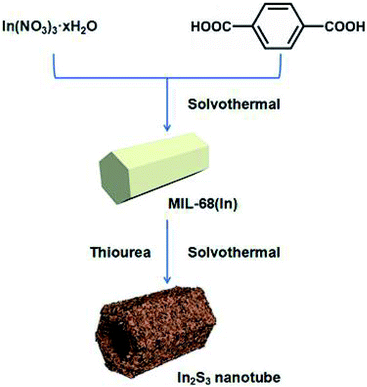
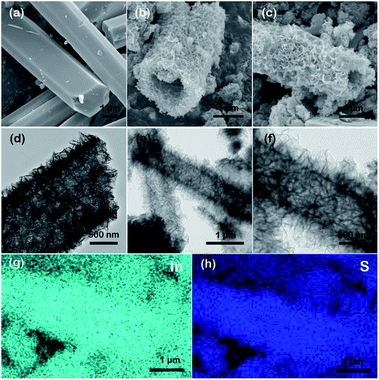
As shown in Scheme 1, In2S3 nanotubes were prepared in two steps. First of all, MIL-68 (In) was prepared as a precursor via the solvothermal method using In(NO3)3·xH2O and H2BDC as reactants. Afterward, through a liquid phase sulfidation process, the as-prepared sample was transformed into In2S3 nanotubes with thiourea as a reactant. Finally, the In2S3 nanotubes were calcined in a nitrogen atmosphere to produce sulfur vacancies.The morphologies and structures of the prepared samples were illuminated by SEM, TEM and energy dispersive spectroscopy (EDS). As shown in Fig. 1a, the uniform MIL-68 (In) precursor was a hexagonal prism with a smooth surface, and its average length and average diameter were about 4–5 μm and 2 μm, respectively. After sulfidation by the solvothermal method, the synthesized In2S3 material perfectly maintained its 1D morphology with ultrathin nanosheets evenly distributed on the surface (Fig. 1b and c). TEM images show that the hexagonal prism was transformed into a hollow structure with a shell thickness of 100 nm after the solvothermal reaction (Fig. 1d–f). After calcination at various temperatures, no significant changes were found in the morphology and size of the samples through SEM and TEM imaging.
Elemental mappings of an individual SV-In2S3-200 nanotube show a uniform distribution of S and In elements across the whole nanostructure. EDS analysis reveals that the In2S3 sample possesses an In/S molar ratio of 1![[thin space (1/6-em)]](https://www.rsc.org/images/entities/char_2009.gif) :
:![[thin space (1/6-em)]](https://www.rsc.org/images/entities/char_2009.gif) 1.3. In comparison, the In/S molar ratio of SV-In2S3-200 is 1
1.3. In comparison, the In/S molar ratio of SV-In2S3-200 is 1![[thin space (1/6-em)]](https://www.rsc.org/images/entities/char_2009.gif) :
:![[thin space (1/6-em)]](https://www.rsc.org/images/entities/char_2009.gif) 1.17, which can be attributed to the escape of sulfur atoms.
1.17, which can be attributed to the escape of sulfur atoms.
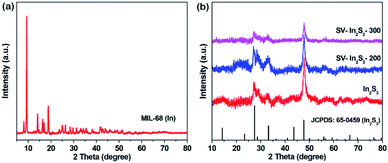
The XRD patterns of MIL-68 (In), In2S3, SV-In2S3-200 and SV-In2S3-300 are shown in Fig. 2. First, MIL-68 (In) was synthesized as a precursor, and its successful synthesis was confirmed by XRD analysis as shown in Fig. 2a.38 The XRD patterns of In2S3, SV-In2S3-200 and SV-In2S3-300 are shown in Fig. 2b. In the XRD pattern of In2S3, the diffraction peaks located at 28.7°, 33.2° and 47.7° perfectly correspond to the (222), (400) and (440) planes of In2S3 (well matched with JCPDS card no. 65-0459). No diffraction peaks of MIL-68 (In) were found, indicating that MIL-68 (In) was completely converted into In2S3. Moreover, it can be seen that after annealing, the peaks of In2S3 were not changed, and no other impurities, such as In2O3 or InS, were detected, indicating the phase purity of the sample. It is worth noting that the peak positions of the samples did not change after calcination, but the strength of the peaks was reduced, which is due to the production of sulfur vacancies.
The optical properties of the samples were also evaluated by DRS. As shown in Fig. 3a, In2S3 responded to visible light, with an absorption edge at about 587 nm. Compared to pure In2S3, SV-In2S3-200 and SV-In2S3-300 exhibit enhanced absorption in the visible light region. The absorption edge values of the SV-In2S3-200 and SV-In2S3-300 are 590 nm and 608 nm, respectively. The absorption intensity is proportional to the calcination temperature in nitrogen, indicating an increase in the number of sulfur vacancies with increasing calcination temperature. The estimated band gap energies of In2S3, SV-In2S3-200 and SV-In2S3-300 are 2.17, 2.14 and 2.10 eV, respectively, corresponding to the Tauc plots shown in Fig. 3b.
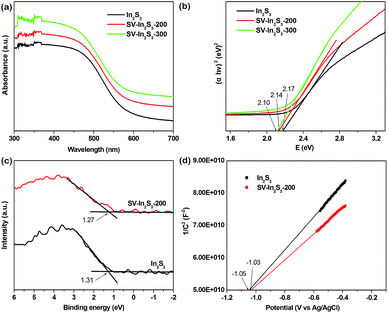 | ||
| Fig. 3 (a) UV-vis diffuse reflectance spectra and (b) Tauc plots of In2S3, SV-In2S3-200 and SV-In2S3-300, and (c) XPS VB spectra and (d) Mott–Schottky plots of In2S3 and SV-In2S3-200. | ||
In order to further investigate the mechanism of photocatalytic activity, the relative band positions of these materials were calculated, because the edge positions play key roles in determining the transmission of photoinduced charge carriers. The X-ray photoelectron spectroscopy (XPS) VB spectra (Fig. 3c) show that the valence bands (VB) of In2S3 and SV-In2S3-200 are 1.31 eV and 1.27 eV, respectively. Furthermore, the conduction bands (CB) of the materials were determined from the Mott–Schottky plots (Fig. 3d). The corresponding flat band potentials of the In2S3 and SV-In2S3-200 samples are estimated to be −1.05 V and −1.03 V versus Ag/AgCl, respectively. If the obtained flat band potential values are converted to normal hydrogen electrode (NHE) potentials, the values are equal to −0.85 V and −0.83 V versus the NHE. The CB potential (ECB) is very close to the flat band potential for n-type semiconductors. Thus, the ECB values are −0.85 V and −0.83 V vs. NHE for the In2S3 and SV-In2S3-200.
Meanwhile, to further study the surface composition and chemical state of the samples, XPS measurements were carried out. As shown in Fig. 4a, the XPS spectra of the In2S3 and SV-In2S3-200 samples are consistent with the previously reported In2S3 spectra. The only elements for which peaks were detected were In, S, O and C. The peaks of C and O possibly arose from the adsorption of gas molecules and partial oxidation of the sample due to their exposure to the atmosphere. High-resolution XPS spectra of In 3d for In2S3 and SV-In2S3-200 samples are shown in Fig. 4b. For the In2S3, the two strong peaks at 444.5 eV and 452.1 eV are attributed to bonding energies of In 3d5/2 and In 3d3/2, respectively. These results indicated that the valence state of In was +3. Meanwhile, for the SV-In2S3-200 the two peaks shifted to lower binding energies, i.e. 444.3 eV for In 3d5/2 and 451.8 eV for In 3d3/2. Fig. 4c shows the S 2p spectra of In2S3 and SV-In2S3-200 samples. For the In2S3, two peaks at 161.1 eV and 162.1 eV can be assigned to the bonding energy of S 2p3/2 and S 2p1/2. Meanwhile, for the SV-In2S3-200, the peak positions shifted to lower binding energies, demonstrating the existence of sulfur vacancies. The combined energy values of the detected In 3d and S 2p are consistent with the previously reported In2S3 data.
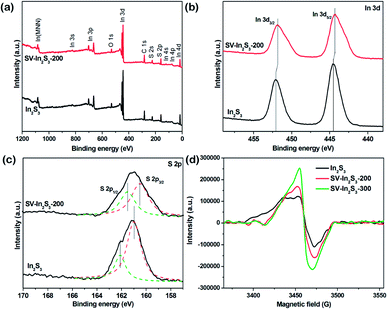 | ||
| Fig. 4 (a) XPS survey spectra, and (b) In 3d and (c) S 2p XPS spectra of In2S3 and SV-In2S3-200 and (d) ESR spectra of In2S3, SV-In2S3-200 and SV-In2S3-300. | ||
ESR spectroscopy is considered as a powerful tool to probe the presence and the concentration of vacancies.39 As shown in the ESR spectra (Fig. 4d), the two calcined samples display stronger ESR signals than the original In2S3, wherein the SV-In2S3-300 sample exhibits the highest peak among all three samples, suggesting the greatest number of unpaired electrons. This indicated that the amount of sulfur atoms in the material decreased when the calcination temperature was increased. Vacancies not only improve the photoabsorption ability of semiconductors, but also act as traps for photogenerated electrons to constrain the recombination of electron/hole pairs, thereby enhancing the photoreactivity.
The N2 adsorption–desorption measurements revealed that the In2S3 possessed a high BET surface area of 110.42 m2 g−1, while the SV-In2S3-200 nanotubes had a BET surface area of 82.97 m2 g−1 (Fig. 5a). Thus, after calcination of indium sulfide, the specific surface area decreased to a certain extent. This can be attributed to the partial collapse of the structure during the calcination process, after which the material structure was no longer completely hollow. The N2 sorption isotherm shows a hysteresis loop, indicating the existence of mesopores in the structure. This mesoporous characteristic is beneficial to the adsorption of nitrogen in the photocatalytic nitrogen fixation reaction. Moreover, the presence of mesopores in the catalyst can provide more active sites for the reaction and accelerate charge transfer to promote the occurrence of photocatalytic reactions.
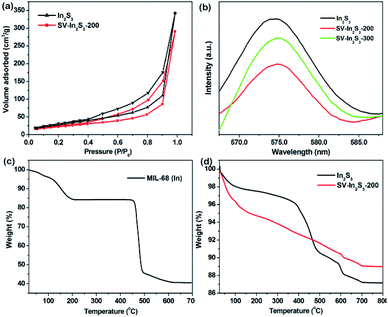 | ||
| Fig. 5 (a) N2 adsorption isotherms of In2S3 and SV-In2S3-200, (b) PL spectra of In2S3, SV-In2S3-200 and SV-In2S3-300, (c) TGA curve of MIL-68 (In), and (d) TGA curves of In2S3 and SV-In2S3-200. | ||
The separation–recombination rate of photogenerated charge carriers in these materials was estimated by PL characterization (Fig. 5b). The results demonstrated that the SV-In2S3-200 sample exhibited a remarkable fluorescence quenching compared with the In2S3 and SV-In2S3-300 samples. This result confirms that electron–hole recombination in materials containing the appropriate amount of vacancies is greatly inhibited, which is beneficial to the photocatalytic reaction.40
The thermal gravimetric analysis (TGA) curves under N2 atmosphere are shown in Fig. 5c and d. For MIL-68 (In), as seen in Fig. 5c, there is a weight loss before 200 °C, which can be attributed to the loss of the guest molecules in the micropores. Then, the MIL-68 (In) completely decomposes at 500 °C. For In2S3 and the SV-In2S3-300, the first weight loss is attributed to the adsorbed water and solvent molecules in the sample (Fig. 5d). With the increase of temperature, the sulfur atoms in the materials escape, and the weight of the material is finally stabilized at temperatures above 700 °C. This shows that the catalyst has good thermal stability and is not easily decomposed at high temperature.
In order to investigate the charge separation efficiencies of the samples, the photocurrent responses of the as-obtained samples were tested. As can be seen from Fig. 6a, In2S3 shows the lowest transient photocurrent responses, indicating the highest recombination rate of photogenerated electron–hole pairs in the In2S3 crystal. Comparatively, SV-In2S3-200 shows the strongest photo-current densities, indicating the separation efficiency of photogenerated charges is notably strengthened. This may be because the appropriate amount of sulfur vacancies can facilitate the trapping of electrons from the CB of In2S3 and result in enhanced charge separation ability. However, SV-In2S3-300 shows a lower photocurrent response than that of SV-In2S3-200, which suggests that excessive sulfur vacancies can act as recombination centers to inhibit the separation of the electron and hole pairs. On the other hand, as Fig. 6b shows, the electrochemical impedance spectra (EIS) reveal that SV-In2S3-200 manifests the smallest arc radius, demonstrating the most desirable interfacial charge transfer ability among the as-obtained samples. The existence of sulfur vacancies causes a reduction in impedance, attributed to the transportation of photogenerated electron–hole pairs, which could be beneficial for enhancing the photocatalytic performance of the SV-In2S3-200.
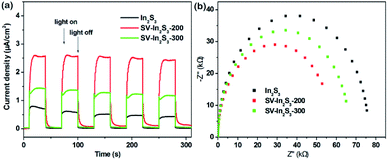 | ||
| Fig. 6 (a) Transient photocurrent spectra, and (b) EIS spectra of In2S3, SV-In2S3-200 and SV-In2S3-300. | ||
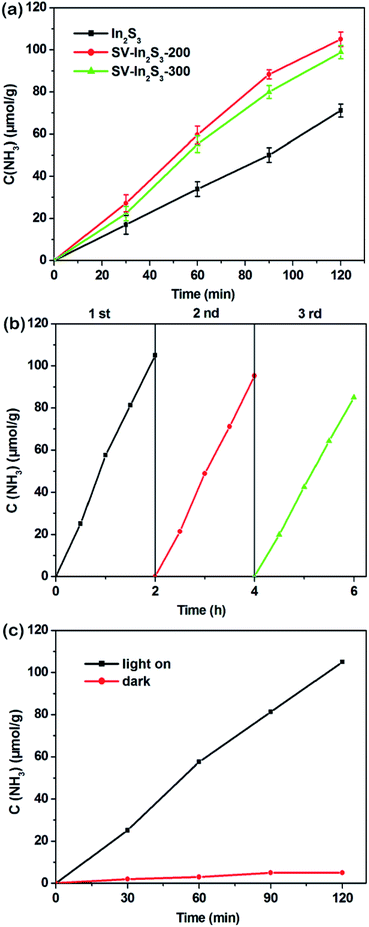
The photocatalytic nitrogen fixation properties of the In2S3, SV-In2S3-200 and SV-In2S3-300 were tested under UV-vis light, and the results are shown in Fig. 7a. It can be seen that In2S3 shows a lower nitrogen fixation ability, with the photocatalytic nitrogen fixation rate of 35.56 μmol h−1 g−1. However, the samples containing sulfur vacancies behave better than the original In2S3, which confirmed that sulfur vacancies can improve the photocatalytic properties of materials. SV-In2S3-200 exhibits a remarkable performance for nitrogen fixation of 52.49 μmol h−1 g−1. The high nitrogen fixation rate is mainly due to an appropriate number of sulfur vacancies. In contrast, the nitrogen fixation efficiency of SV-In2S3-300 is 47.41 μmol h−1 g−1. The lower N2 fixation performance of SV-In2S3-300 may be due to the excessive sulfur vacancies, which can act as recombination centers to inhibit the separation of the electron and hole pairs, inhibiting the photocatalytic properties. The calcination-optimized SV-In2S3-200 catalyst has excellent stability of nitrogen fixation and ammonia production performance under UV-vis light (Fig. 7b). After three cycles, SV-In2S3-200 still exhibits an excellent photo-nitrogen fixation rate with only a slight change. The used SV-In2S3-200 samples were repeatedly tested by XRD and SEM (Fig. 8), and no obvious changes were detected, indicating the stability and recyclable properties of the material. Besides, a blank experiment, shown in Fig. 7c, revealed that ammonia was not produced in the solution without light irradiation, confirming that the carrier generation is excited by light irradiation.
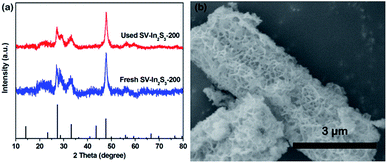 | ||
| Fig. 8 (a) XRD patterns of fresh SV-In2S3-200 and used SV-In2S3-200, and (b) an SEM image of used SV-In2S3-200. | ||
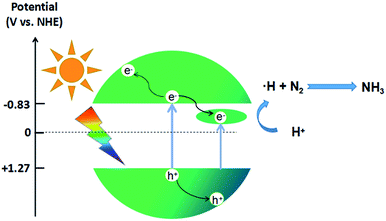
In the photocatalytic nitrogen fixation reaction, the sulfur vacancies can serve as the active sites to capture and activate N2 molecules. Due to the large amount of S vacancies in the SV-In2S3, the N2 molecules are most probably captured by these S vacancies and activated by donating electrons from their bonding orbitals and accepting electrons into their three antibonding orbitals. From the crystal structure in Scheme 2, it can be seen that the adsorbed N2 molecules on the S vacancies are most likely surrounded by In atoms. Under solar light irradiation, the photogenerated charged excitons on these In atoms may cooperate with the center-adsorbed N2 molecule and result in a possible redox reaction. The mechanism of the nitrogen fixation reaction is shown in Scheme 3. Due to the existence of sulfur vacancies, an impurity energy level between the CB and the VB is introduced into the catalyst. Consequently, the as-obtained SV-In2S3-200 sample displays a narrower band gap and better utilization of visible light than pure In2S3. Besides, SV-In2S3-200 is excited by light with an energy higher than the band gap, i.e., the energy needed to excite electrons from the VB to the CB or into the sulfur vacancies to form photogenerated electron–hole pairs. As active sites, sulfur vacancies accelerate the separation efficiency of photogenerated electron–hole pairs. Moreover, sulfur vacancies can also promote the adsorption and activation of N2 molecules and increase the efficiency of photocatalytic nitrogen fixation.
Conclusions
In summary, In2S3 hollow nanotubes were synthesized by using a self-templated strategy, and then sulfur vacancies were introduced by calcination. The obtained samples were used as an efficient and stable photocatalyst to synthesize ammonia under UV-vis light. In the process of photocatalysis, sulfur vacancies not only enhance the visible-light harvesting ability, but also facilitate the separation and transfer efficiency of the photogenerated electron/hole pairs. In addition, the sulfur vacancies play a key role in photocatalytic nitrogen fixation. As a result, the In2S3 photocatalyst with optimized sulfur vacancies exhibits remarkable performance and outstanding stability for N2 fixation, with a stable NH3 generation rate of 52.49 μmol h−1 g−1, which is 1.48 and 1.1 times higher than those of In2S3 and SV-In2S3-300. Besides, the unique structure and composition of these layered tubular nanostructures reduces the diffusion distance of charge carrier separation and migration, and provides a large surface area for N2 adsorption and abundant catalytically active sites for photochemical reactions. This work may provide guidelines for the design and construction of complex semiconductor-based photocatalysts for solar energy-related applications.Conflicts of interest
There are no conflicts to declare.Acknowledgements
This work was financially supported by the Natural Science Foundation of China (No. 21878031), the Liaoning Province Natural Science Foundation (No. 20180550770) and the Liaoning Revitalization Talents Program (No. XLYC1802124).Notes and references
- V. Rosca, M. Duca, M. T. de Groot and M. T. M. Koper, Chem. Rev., 2009, 109, 2209–2244 CrossRef CAS.
- H.-P. Jia and E. A. Quadrelli, Chem. Soc. Rev., 2014, 43, 547–564 RSC.
- P. Schwerdtfeger, J. Gierlich and T. Bollwein, Angew. Chem., Int. Ed., 2003, 42, 1183 CrossRef.
- N. Zhang, A. Jalil, D. Wu, S. Chen, Y. Liu, C. Gao, W. Ye, Z. Qi, H. Ju, C. Wang, X. Wu, L. Song, J. Zhu and Y. Xiong, J. Am. Chem. Soc., 2018, 140, 9434–9443 CrossRef CAS PubMed.
- B. M. Hoffman, D. Lukoyanov, Z.-Y. Yang, D. R. Dean and L. C. Seefeldt, Chem. Rev., 2014, 114, 4041–4062 CrossRef CAS.
- T. Oshikiri, K. Ueno and H. Misawa, Angew. Chem., Int. Ed., 2014, 53, 9802–9805 CrossRef CAS.
- X. Chen, N. Li, Z. Kong, W.-J. Ong and X. Zhao, Mater. Horiz., 2018, 5, 9–27 RSC.
- J. M. P. Martirez and E. A. Carter, J. Am. Chem. Soc., 2017, 139, 4390–4398 CrossRef CAS PubMed.
- A. Kudo and Y. Miseki, Chem. Soc. Rev., 2009, 38, 253–278 RSC.
- W.-J. Ong, L.-L. Tan, S.-P. Chai, S.-T. Yong and A. R. Mohamed, Nanoscale, 2014, 6, 1946–2008 RSC.
- G. N. Schrauzer and T. D. Guth, J. Am. Chem. Soc., 1977, 99, 7189–7193 CrossRef CAS.
- H. Li, J. Shang, Z. Ai and L. Zhang, J. Am. Chem. Soc., 2015, 137, 6393–6399 CrossRef CAS.
- Z. Zhang, J. Huang, Y. Fang, M. Zhang, K. Liu and B. Dong, Adv. Mater., 2017, 29, 1606688 CrossRef.
- A. Fujishima and K. Honda, Nature, 1972, 238, 37–38 CrossRef CAS.
- S. E. Creutz and J. C. Peters, J. Am. Chem. Soc., 2014, 136, 1105–1115 CrossRef CAS.
- W. Zhou, W. Li, J. Wang, Y. Qu, Y. Yang, Y. Xie, K. Zhang, L. Wang, H. Fu and D. Zhao, J. Am. Chem. Soc., 2014, 136, 9280–9283 CrossRef CAS.
- X. Fu, X. Wang, Z. Chen, Z. Zhang, Z. Li, D. Y. C. Leung, L. Wu and X. Fu, Appl. Catal., B, 2010, 95, 393–399 CrossRef CAS.
- W. Huang, L. Gan, H. Yang, N. Zhou, R. Wang, W. Wu, H. Li, Y. Ma, H. Zeng and T. Zhai, Adv. Funct. Mater., 2017, 27, 1702448 CrossRef.
- H. Wang, Y. Wu, T. Xiao, X. Yuan, G. Zeng, W. Tu, S. Wu, H. Y. Lee, Y. Z. Tan and J. W. Chew, Appl. Catal., B, 2018, 233, 213–225 CrossRef CAS.
- H. Wang, X. Yuan, Y. Wu, G. Zeng, H. Dong, X. Chen, L. Leng, Z. Wu and L. Peng, Appl. Catal., B, 2018, 186, 19–29 CrossRef.
- J. Zhang, H. Wang, X. Yuan, G. Zeng, W. Tu and S. Wang, J. Photochem. Photobiol., C, 2019, 38, 1–26 CrossRef CAS.
- Z. Wu, X. Yuan, G. Zeng, L. Jiang, H. Zhong, Y. Xie, H. Wang, X. Chen and H. Wang, Appl. Catal., B, 2018, 225, 8–21 CrossRef CAS.
- J. Zhang, H. Wang, X. Yuan, G. Zeng, W. Tu and S. Wang, J. Photochem. Photobiol. C, 2019, 38, 1–26 CrossRef CAS.
- J. Hou, S. Cao, Y. Sun, Y. Wu, F. Liang, Z. Lin and L. Sun, Adv. Energy Mater., 2018, 8, 1701114 CrossRef.
- Z. Wu, X. Yuan, G. Zeng, L. Jiang, H. Zhong, Y. Xie, H. Wang, X. Chen and H. Wang, Appl. Catal., B, 2018, 225, 8–21 CrossRef CAS.
- L. Huang, J. Yang, X. Wang, J. Han, H. Han and C. Li, Phys. Chem. Chem. Phys., 2013, 15, 553–560 RSC.
- Y. Zhao, J. Lin, Y. Liu, B. Ma, Y. Ding and M. Chen, Chem. Commun., 2015, 51, 17309–17312 RSC.
- D. Le, T. B. Rawal and T. S. Rahman, J. Phys. Chem. C, 2014, 118, 5346–5351 CrossRef CAS.
- K. G. Kanade, J.-O. Baeg, B. B. Kale, S. Mi Lee, S.-J. Moon and K.-j. Kong, Int. J. Hydrogen Energy, 2007, 32, 4678–4684 CrossRef CAS.
- M. Zhu, Y. Osakada, S. Kim, M. Fujitsuka and T. Majima, Appl. Catal., B, 2017, 217, 285–292 CrossRef CAS.
- L. Yu, H. B. Wu and X. W. D. Lou, Acc. Chem. Res., 2017, 50, 293–301 CrossRef CAS.
- X. Lai, J. E. Halpert and D. Wang, Energy Environ. Sci., 2012, 5, 5604–5618 RSC.
- S. Wang, B. Y. Guan, L. Yu and X. W. Lou, Adv. Mater., 2017, 29, 1702724 CrossRef.
- K. B. Lausund, V. Petrovic and O. Nilsen, Dalton Trans., 2017, 46, 16983–16992 RSC.
- H.-C. Zhou, J. R. Long and O. M. Yaghi, Chem. Rev., 2012, 112, 673–674 CrossRef CAS.
- H. Zhang, J. Nai, L. Yu and X. W. Lou, Joule, 2017, 1, 77–107 CrossRef CAS.
- C. Volkringer, M. Meddouri, T. Loiseau, N. Guillou, J. Marrot, G. Férey, M. Haouas, F. Taulelle, N. Audebrand and M. Latroche, Inorg. Chem., 2008, 47, 11892–11901 CrossRef CAS.
- S. Wang, B. Y. Guan, Y. Lu and X. W. D. Lou, J. Am. Chem. Soc., 2017, 139, 17305–17308 CrossRef CAS.
- W. Cho, H. J. Lee and M. Oh, J. Am. Chem. Soc., 2008, 130, 16943–16946 CrossRef CAS.
- X. Jiao, Z. Chen, X. Li, Y. Sun, S. Gao, W. Yan, C. Wang, Q. Zhang, Y. Lin, Y. Luo and Y. Xie, J. Am. Chem. Soc., 2017, 139, 7586–7594 CrossRef CAS.
| This journal is © The Royal Society of Chemistry 2019 |

