 Open Access Article
Environmentally friendly synthesis of photoluminescent biochar dots from waste soy residues for rapid monitoring of potentially toxic elements
Liting Zhang ab,
Wanpeng Liua,
Haifeng Zhuanga,
Jin Zhanga,
Chao Chen
 b,
Yibing Wangb and
Shengdao Shan*a
aZhejiang Province Key Laboratory of Recycling and Eco-treatment of Waste Biomass, Zhejiang University of Science and Technology, Hangzhou, 310023, China. E-mail: 100099@zust.edu.cn
bState Key Laboratory of Bioreactor Engineering, Biomedical Nanotechnology Center, School of Biotechnology, East China University of Science and Technology, Shanghai, 200237, China
First published on 12th July 2019
Abstract
Single-step environmentally friendly synthesis of biochar dots (BCDs) was developed using hydrothermal treatment of waste biomass. Using soy residue as the carbon precursor, the resultant BCDs had strong and stable photoluminescence. Characterization by atomic force microscopy (AFM), transmission electron microscopy (TEM), X-ray photoelectron spectroscopy (XPS) and infrared spectroscopy indicates that the BCDs prepared were water soluble, spherical, oxygenous and nitrogen-doped carbon nanoparticles with 10–20 nm in diameter. The fluorescence quantum yield of the BCDs was 3.7%. The use of the BCDs as a very effective fluorescent probe for label-free, rapid, and selective detection of Hg2+ and Fe3+ ions was further demonstrated with good linear relationships at 0–50 μM and 10–50 μM, respectively. The minimum detection limits of Hg2+ and Fe3+ were 100 nM and 30 nM. Furthermore, the feasibility of using the BCDs for monitoring of Hg2+ and Fe3+ in open waters was also established.
1. Introduction
Interest in hydrothermal treatment as a waste biomass carbonization technology stems from the fact that it has relatively low energy consumption, high charcoal yield and virtually no environmental impact and thus satisfies the criteria for environmentally friendly processing and high value utilization of biomass.1,2 In addition to the solid charcoal produced by hydrothermal treatment of biomass, there is a class of by-products, namely fluorescent biochar dots (BCDs), that are generally formed in the treatment medium. Very few studies have focused on the properties and potential application of these carbon nanodots, because of the low fluorescence quantum yield.Nevertheless, it has been widely reported that the hydrothermal carbonization of chemicals such as polyethylene glycol,3 ethanol,4 citrate,5 ascorbic acid,6 and saccharides,7 is an environmentally friendly and inexpensive route for the preparation of fluorescent carbon nanoparticles which have attracted much interest due to their controllable optical properties, good biological compatibility, and low cost compared to organic dyes and fluorescent semiconductor nanocrystals.8 Thus, the resultant fluorescent carbon nanoparticles have found numerous applications in biological imaging, drug delivery, sensors, and photoelectrocatalysis.9–12 Since the hydrothermal treatment of biomass also includes the hydrolysis and decomposition processes that continuously release saccharides, lipids, and amino acids from different biomass materials,13 it is reasonable to expect that hydrothermal-based treatments will provide a good option for the simultaneous synthesis of biochar and new BCDs. This is supported by the demonstration that the use of orange juice, strawberry juice, or sugar cane juice as carbon precursor has led to the synthesis of fluorescent BCDs using hydrothermal treatment, and these have been used successfully in biological imaging or mercury(II) ion detection.14–16
From the point view of the high-value utilization of waste biomass and the economical monitoring of potentially toxic metal ions, it is suitable to use the biomass as a novel carbon source for environmentally friendly synthesis of effective fluorescent BCDs. It also has been widely demonstrated that incorporation of nitrogen groups into a carbon matrix can greatly promote the fluorescent properties of BCDs.17–20 Here, we first demonstrate the use of nitrogen-rich soy residues as a carbon source for the hydrothermal synthesis of fluorescent BCDs with an enhanced quantum yield of around 3.7%. Moreover, the BCDs can be used as a sensitive fluorescent probe for label-free, rapid, and selective detection of Hg2+ and Fe3+ ions. Finally, the feasibility of using the BCDs to monitor Hg2+ and Fe3+ in open waters was also successfully explored.
2. Experimental section
2.1 Chemical reagents
Standard ZnCl2, Cu(NO3)2, CaCl2, NiCl2, Pb(NO3)2, FeCl3, FeCl2, Hg(NO3)2, CdCl2 and MgCl2 solutions were purchased from Sibo Co., Ltd, Guangzhou, China. NaH2PO4, NaOH, H2SO4, and quinine sulfate were purchased from Aladdin Co., Ltd, Shanghai, China, and all chemicals were used as received without further purification. Soybean was purchased from a local supermarket in Hangzhou, east China, and fresh soy residue was prepared in the laboratory with a soy milk machine and a filtration process. The deionized water used throughout all experiments was purified to 18 MΩ cm−1 with a Type I Simplicity Water System (Millipore, Burlington, MA).2.2 Preparation of BCDs
The fluorescent BCDs were prepared by hydrothermal reaction using soy residue as the raw material. In a typical synthesis, 12 g of fresh soy residue were mixed with 50 mL of deionized water in glass beaker with vigorous mixing to obtain a homogeneous mixture. The mixture was transferred to a 100 mL stainless steel autoclave and heated at 200 °C for 3 h with magnetic stirring at 200 rpm. When the reaction was complete the autoclave was cooled down naturally to room temperature. The BCDs were collected in the supernatant solution phase by centrifugation at 12![[thin space (1/6-em)]](https://www.rsc.org/images/entities/char_2009.gif) 000 rpm for 10 min. After centrifugation the BCDs were further purified by overnight dialysis (with cut off at molecular weight 3500) against deionized water. The resultant BCDs were freeze dried for 48–72 h and re-dispersed in pure water for further characterization and use.
000 rpm for 10 min. After centrifugation the BCDs were further purified by overnight dialysis (with cut off at molecular weight 3500) against deionized water. The resultant BCDs were freeze dried for 48–72 h and re-dispersed in pure water for further characterization and use.
2.3 Characterizations
Ultraviolet-visible (UV-vis) adsorption spectra were obtained from 210 to 700 nm using a UV-2450 spectrophotometer (Shimadzu, Kyoto, Japan). The fluorescence spectrum was measured with an F-4500 fluorescence spectrophotometer (Hitachi, Tokyo, Japan). Fourier transform infra-red (FTIR) spectra of samples were recorded on a Nicolet iZ10 spectrometer (Thermo Fisher, Waltham, MA) in the range 400–4000 cm−1. The morphology and size of the BCDs was examined by transmission electron microscopy (TEM) and atomic force microscopy (AFM). Samples for TEM characterization were prepared by placing a drop of the diluted BCD dispersion on a carbon coated copper grid and drying at room temperature and then scanned with an H-8100 electron microscope (Hitachi, Tokyo, Japan) with an acceleration voltage of 200 kV. AFM measurement was conducted with an aliquot of very dilute BCD solution was dropped onto a piece of freshly cleaved mica and dried at room temperature, then subjected to AFM scanning with an AJ-III (Aijian Nanotechnology, Shanghai, China) using a tapping mode. The X-ray photoelectron spectroscopy (XPS) analysis was conducted using an ESCALAB-250 X-ray photoelectron spectrometer (VG Scientific, Thermo Fisher, Waltham, MA). Samples for XPS analysis were prepared by placing a drop of the dispersion on a glass substrate and then drying at room temperature. The zeta potential of the BCDs in solution was determined by dynamic light scattering (Master-3000, Malvern, UK). Quantum yields (QY) were measured according to a previous protocol.21 Quinine sulfate in 0.1 M H2SO4 (quantum yield 0.54 at 340 nm) was selected as standard. The quantum yield of the BCDs was calculated from the following equation:where Q is the quantum yield, I is the measured emission intensity, A is the absorbance at the excitation wavelength, and η is the refractive index (i.e. 1.33 for water).
2.4 Fluorescence determinations of heavy metal ions
The selectivity of BCDs towards different metal ions was first investigated at room temperature in 0.1 M PBS (pH 7.0) solution. In a typical run, 10 μL of BCD dispersion (0.1 mg mL−1) was added to 3.0 mL of PBS solution containing 40 μM metal ions in each fluorescence cuvette. After 5 min incubation at room temperature the PL spectra were collected and PL intensity was obtained from the spectra. Hg2+ and Fe3+ were determined quantitatively by preparing 3.0 mL of different concentrations of Hg2+ or Fe3+ solutions, from 0 to 50 μM, in each cuvette followed by the addition of 10 μL of BCD dispersion, and then the PL spectra were recorded after 5 min. Hg2+ and Fe3+ in open waters were detected by filtering water samples from Xianlin reservoir in Hangzhou, Zhejiang province, through a 0.22 μm membrane before measurement. The water samples were mixed with standard solutions with different concentrations of Hg2+ or Fe3+ and the PL intensity values were read on a fluorescence spectrophotometer and plotted against the ion concentrations. All results were obtained from at least three replicates and the error bars represent SD based on the independent measurements.3. Results and discussion
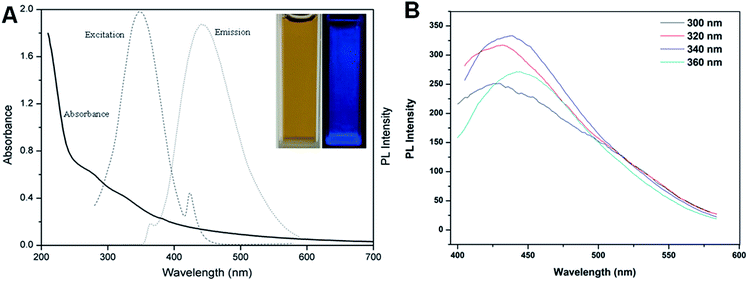
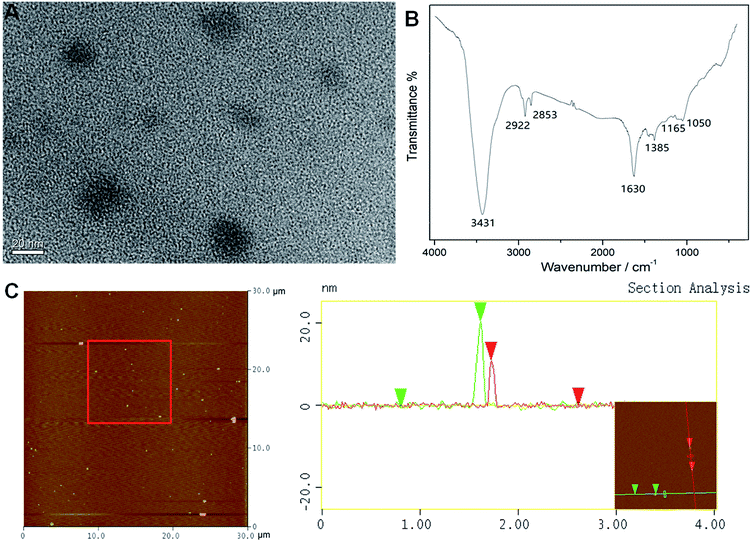
The UV-vis absorption and fluorescence spectra of the BCDs were recorded for the determination of quantum yield. Fig. 1A shows the UV-vis absorption, PL excitation and emission spectra of the aqueous dispersion of the BCDs. These exhibited a very broad absorption band between 210 and 400 nm in UV-vis region and a small shoulder peak around 280 nm may be attributed to the π–π* transition of aromatic carbon in the BCDs.7,21 The maximum excitation wavelength was located at 346 nm. With excitation of 346 nm the BCDs exhibited a strong fluorescent emission peak centered around 440 nm. Notably, the BCD solutions had a brown color and were transparent under white light environment, indicating that the BCDs formed were water-soluble. The BCD solutions exhibited bright blue fluorescence under the irradiation of a 365 nm UV lamp. Accordingly, the fluorescence quantum yield was calculated to be approximately 3.7%, a higher value than that prepared from most raw biomass materials such as grass, sweet potatoes and food wastes,22–24 but lower than the processed fruit juices.14–16 In addition, varying the excitation wavelength from 300 to 360 nm led to a slow shift in the photoluminescent emission peak to longer wavelengths of 427 to 444 nm (Fig. 1B). This excitation-dependent emission behavior is similar to that of other fluorescent carbon materials,7,12,24 and the red shift of fluorescence emission may be ascribed to the different sizes of the BCDs in each sample.21 The strongest emission was obtained from 340 nm excitation, which was the closest to the maximum excitation obtained as shown in Fig. 1A.The TEM image of the BCDs in Fig. 2A shows that the BCDs were approximately spherical with diameters ranging from 10 to 20 nm without obvious aggregation. The morphology of the BCDs was further characterized by AFM (Fig. 2C) and the images suggest that the BCDs were almost monodispersed with a magnitude of 11 to 20 nm in height and this is quite consistent with the diameter obtained from TEM scanning. The zeta potential of the BCDs was found to be −4.2 mV, indicating that they were slightly negatively charged and this would have facilitated BCD monodispersion.
Chemical composition and structural information regarding the BCDs were further revealed by the FTIR and XPS spectra. The FTIR spectrum (Fig. 2B) exhibited the characteristic absorption bands of OH/NH stretching at around 3431 cm−1, CH stretching vibrations in the range 2853–2922 cm−1 and C![[double bond, length as m-dash]](https://www.rsc.org/images/entities/char_e001.gif) O and C
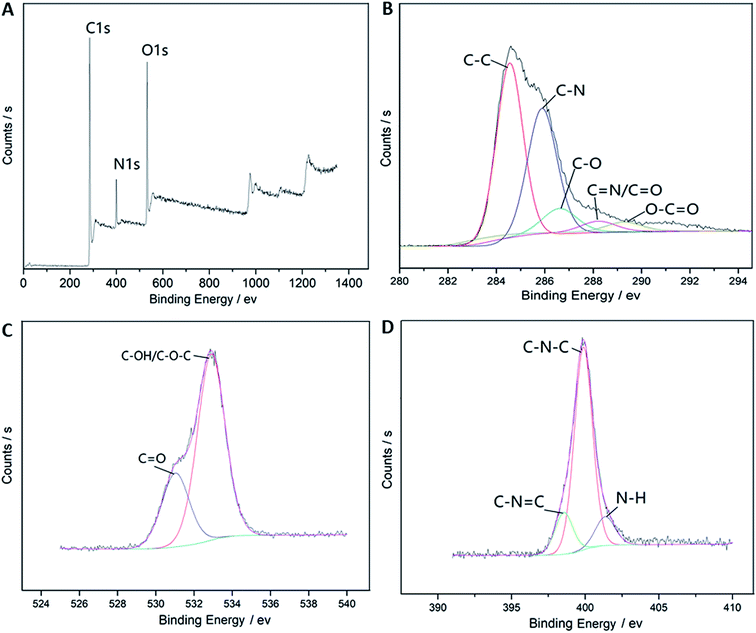
O and C![[double bond, length as m-dash]](https://www.rsc.org/images/entities/char_e001.gif) C stretching vibrations at around 1630 cm−1, and the bands between 1050 and 1385 cm−1 indicate the presence of a large amount of C–O groups.18,21 XPS was further used to analyze the surface elements and states of the BCDs. The results in Fig. 3A show that there were at least three strong peaks, C1s, N1s and O1s, at around 285.5, 399.9, and 532.2 eV, respectively.18 These results suggest that the BCDs were mainly composed by the elements C, N and O and the corresponding contents of these element were 72.1, 8.8, and 19.1%. The C1s spectrum in Fig. 3B can be separated into five single peaks corresponding to C–C (284.6 eV), C–N (285.9 eV), C–O (286.7 eV), C
C stretching vibrations at around 1630 cm−1, and the bands between 1050 and 1385 cm−1 indicate the presence of a large amount of C–O groups.18,21 XPS was further used to analyze the surface elements and states of the BCDs. The results in Fig. 3A show that there were at least three strong peaks, C1s, N1s and O1s, at around 285.5, 399.9, and 532.2 eV, respectively.18 These results suggest that the BCDs were mainly composed by the elements C, N and O and the corresponding contents of these element were 72.1, 8.8, and 19.1%. The C1s spectrum in Fig. 3B can be separated into five single peaks corresponding to C–C (284.6 eV), C–N (285.9 eV), C–O (286.7 eV), C![[double bond, length as m-dash]](https://www.rsc.org/images/entities/char_e001.gif) C/C
C/C![[double bond, length as m-dash]](https://www.rsc.org/images/entities/char_e001.gif) O (288.3 eV), and O–C
O (288.3 eV), and O–C![[double bond, length as m-dash]](https://www.rsc.org/images/entities/char_e001.gif) O (289.4 eV) groups17 in accordance with the FTIR results. The above observations suggest that the BCDs have been functionalized with sufficient hydroxyl moieties but limited carboxylic/carbonyl moieties that might render the BCDs water-soluble and slightly negatively charged. The O1s spectrum in Fig. 3C reveals two characteristic oxygen states, C
O (289.4 eV) groups17 in accordance with the FTIR results. The above observations suggest that the BCDs have been functionalized with sufficient hydroxyl moieties but limited carboxylic/carbonyl moieties that might render the BCDs water-soluble and slightly negatively charged. The O1s spectrum in Fig. 3C reveals two characteristic oxygen states, C![[double bond, length as m-dash]](https://www.rsc.org/images/entities/char_e001.gif) O (531.2 eV) and C–OH/C–O–C (532.9 eV),25 which is also consistent with the C1s spectrum and the FTIR. The N1s spectrum in Fig. 3D suggests the three nitrogen species C–N
O (531.2 eV) and C–OH/C–O–C (532.9 eV),25 which is also consistent with the C1s spectrum and the FTIR. The N1s spectrum in Fig. 3D suggests the three nitrogen species C–N![[double bond, length as m-dash]](https://www.rsc.org/images/entities/char_e001.gif) C (398.5 eV), C–N–C (399.8 eV) and N–H (401.4 eV),26 and further confirms that the analysis based on FTIR, C1s and N1s spectra, and the nitrogen-doping was successfully achieved.
C (398.5 eV), C–N–C (399.8 eV) and N–H (401.4 eV),26 and further confirms that the analysis based on FTIR, C1s and N1s spectra, and the nitrogen-doping was successfully achieved.
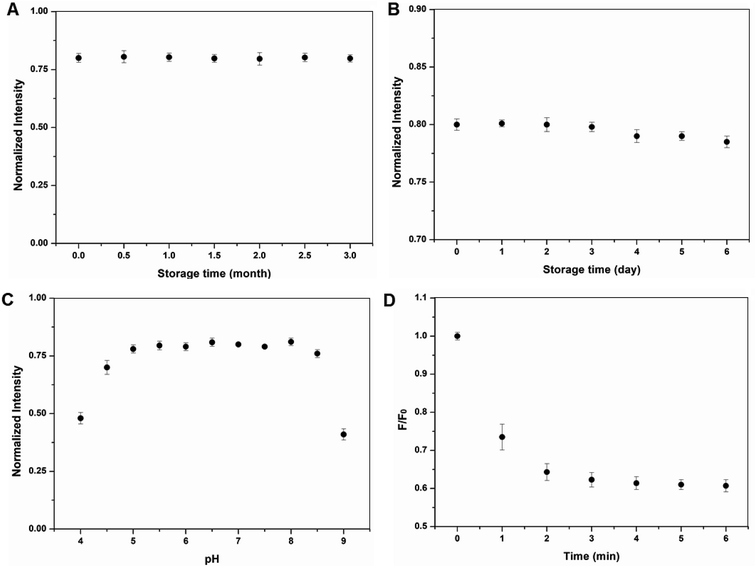
It is worth mentioning that the BCDs stored in the dark were stabilized for months without detectable change in PL intensity (Fig. 4A). Even in the indoor environment with intermittent white light irradiation the PL intensity remained stable for at least 72 h (Fig. 4B). PL intensity was also inert to solution pH as shown in Fig. 4C and the influence of pH on BCD PL intensity can be ignored in slightly acid and slightly alkaline conditions but clearly decreased when the pH was lower than 5.0 or higher than 8.5. The BCDs can quickly conjugate with metal ions (Fig. 4D). The time-dependent fluorescence intensity at 440 nm decreased within 4 min and then remained constant over time, suggesting conjugation equilibrium between the BCDs and Hg2+. Thus, the conjugation of BCDs and Hg2+ is rapid and 5 min was selected as the optimum reaction time in the subsequent experiments. This high storage and pH stability and fast conjugation provide advantages for the use of BCDs in practical ion detection or monitoring.
The selectivity of the BCDs was evaluated by measuring the fluorescence quenching efficiency in the presence of different types of environmental metal ions, namely Zn2+, Cu2+, Ca2+, Ni2+, Pb2+, Fe2+, Fe3+, Hg2+, Cd2+ and Mg2+. Fig. 5 shows the changes in relative PL intensity (F/F0) of the BCDs in the presence of these representative metal ions under the same conditions. PL intensity clearly showed the greatest decrease with Hg2+ and the decrease in the presence of Fe3+ was also obvious but lower than that obtained with Hg2+. The other metal ions had much smaller quenching effects. As a result, the present fluorescent probe based sensing platform exhibited the highest selectivity for Hg2+ detection. This good selectivity can likely be attributed to the stronger affinity of Hg2+ toward the carboxylic, hydroxyl and amino groups on BCDs surfaces than those of other metal ions,27 and the quenching induced by Hg2+ could be attributed to the static quenching arising from the formation of non-fluorescent conjugates composed by BCDs and Hg2+. Such BCD–Hg2+ conjugation could efficiently accelerate the excitation transfer and regulate the charge recombination, finally resulting in fluorescence quenching, making the BCDs suitable for fluorescent probes.28
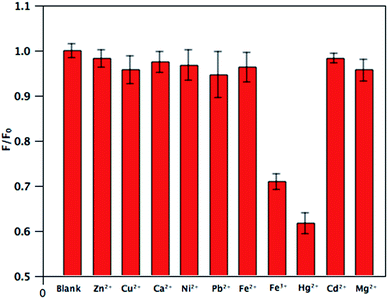 | ||
| Fig. 5 The difference in the relative PL intensity of BCDs dispersion between the blank and solutions containing different metal ions (excitation at 346 nm; [Mn+] = 40 μM). | ||
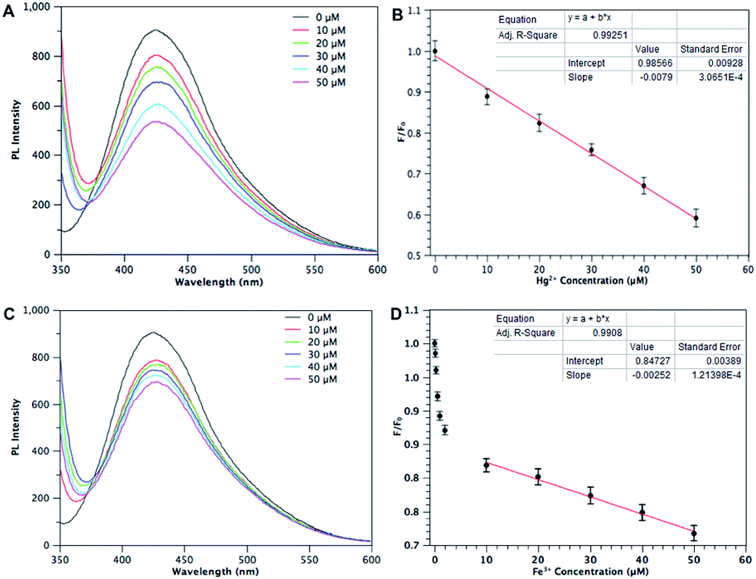
In view of the good selectivity for Hg2+ and Fe3+, different concentrations of Hg2+ in the range 0–50 μM were investigated for detailed study. Fig. 6A shows the PL spectra of BCD dispersion in the presence of different Hg2+ concentrations and reveals the dependence of F/F0 on the concentration of Hg2+ ions in Fig. 6B, where F0 and F are the BCD fluorescence intensities at 440 nm in the absence and presence of Hg2+, respectively. A good linear relationship was obtained between F/F0 and Hg2+ concentration, which may provide a convenient measurement when the Hg2+ concentration is in the micromolar range (0–50 μM). The detection limit was estimated to be 100 nM at a signal-to-noise ratio of 3, much lower than using a membrane based mercury sensor (15 μM)29 but higher than a (Au/Ag)@Ins NC nanohybrids based sensing system (7 nM).30 Fig. 6C shows the PL spectra of BCDs dispersion in the presence of different Fe3+ concentrations and indicates the dependence of F/F0 on the concentration of Fe3+ ions in Fig. 6D. It is interesting to note that the PL intensity of the mixture is quite sensitive to the Fe3+ concentration in the nanomolar range with a minimum detection limit of 30 nm, lower than that of a triphenylamine based fluorescent chemosensor,31 but higher than that based on a histidine-derived carbon dot sensing system (10 nM).32 Although the detection limits of Hg2+ and Fe3+ were not the best for fluorescence probing, this BCD based detection method still provided good pH stability, a wide linear range at micromolar levels, low-cost preparation, and fast measurement, overall making it a promising material for Hg2+ or Fe3+ monitoring in aquatic systems.
In order to test whether this BCD based sensor system is capable of being used in the monitoring of open water samples, interferences from unknown substances of the PL intensity of BCDs was evaluated in water samples collected from the Xianlin reservoir in Yuhang district in Hangzhou city. The quantitative analysis of each sample was conducted by atomic absorption/fluorescence spectrometry (AAS) to give reference values for the BCD based method. The fluorescence intensity of the BCDs decreased when the samples were spiked with standard metal ion solutions (Table 1). The recoveries of Hg2+ and Fe3+ in the spiked samples were in the range 90–104% in their linear areas, suggesting limited interference by minerals or soluble organics present in the water samples. This is less accurate than the ASS measurements but still acceptable. These results demonstrate that this sensing system has good potential for the quantitative monitoring of Hg2+ and Fe3+ in open water systems.
| Sample no. | Spiked (μM) | ASS (μM) | BCDs detection (μM) | Recovery (%) | |
|---|---|---|---|---|---|
| Hg2+ | 1 | 0.5 | 0.49 | 0.45 | 90 |
| 2 | 1.0 | 1.02 | 0.96 | 96 | |
| 3 | 5.0 | 5.09 | 5.19 | 103.8 | |
| Fe3+ | 4 | 0.1 | 0.11 | 0.04 | 40 |
| 5 | 5.0 | 5.23 | 4.52 | 90.4 | |
| 6 | 10.0 | 9.92 | 9.53 | 95.3 |
4. Conclusions
In summary, a single-step synthesis of BCDs was successfully developed using hydrothermal treatment of waste soy residues. The BCDs were water soluble, spherical, oxygenous and nitrogen-doped carbon nanoparticles with 10–20 nm in diameter. This BCDs could be used as an effective fluorescence probe for label-free, fast, and selective detection of Hg2+ and Fe3+ ions in micromolar range. Moreover, this sensing system showed good potential for application in the monitoring of Hg2+ and Fe3+ ions in open water samples. Considering the cheap raw material and the energy-saving preparation process, an economical and eco-friendly method for toxic elements monitoring was developed.Conflicts of interest
There are no conflicts to declare.Acknowledgements
This research was funded by the Key Research and Development Plan of Science and Technology Department of Zhejiang Province (2019C02053 & 2017C03010), and Youth Fund Project of Zhejiang University of Science and Technology (2019QN31).References
- J. S. Cha, S. H. Park, S. Jung, C. Ryu, J. Jeon, M. Shin and Y. Park, J. Ind. Eng. Chem., 2016, 40, 1–15 CrossRef CAS.
- B. Patel, M. Guo, A. Izadpanah, N. Shah and K. Hellgardt, Bioresour. Technol., 2016, 199, 288–299 CrossRef CAS.
- R. Fan, Q. Sun, L. Zhang, Y. Zhang and A. Lu, Carbon, 2014, 71, 87–93 CrossRef CAS.
- S. Zhu, Q. Meng, L. Wang, J. Zhang, Y. Song, H. Jin, K. Zhang, H. Sun, H. Wang and B. Yang, Angew. Chem., Int. Ed., 2013, 52, 8151–8155 CrossRef.
- J. Wang, C. Cheng, Y. Huang, B. Zheng, H. Yuan, L. Bo, M. Zheng, S. Yang, Y. Guo and D. Xiao, J. Mater. Chem. C, 2014, 2, 5028–5035 RSC.
- H. Li and C. Xie, J. Lumin., 2012, 132, 30–34 CrossRef CAS.
- H. Li, X. He, Y. Liu, H. Huang, S. Lian, S. Lee and Z. Kang, Carbon, 2011, 49, 605–609 CrossRef CAS.
- W. Li, Z. Zhang, B. Kong, S. Feng, J. Wang, L. Wang, J. Yang, F. Zhang, P. Wu and D. Zhao, Angew. Chem., Int. Ed., 2013, 52, 8151–8155 CrossRef CAS.
- R. Rani, V. Kumar and F. Rizzolio, ACS Med. Chem. Lett., 2013, 4, 1012–1013 CrossRef.
- S. Y. Lim, W. Shen and Z. Gao, Chem. Soc. Rev., 2015, 44, 362–381 RSC.
- W. Li, Q. Liu, P. Zhang and L. Liu, Acta Biomater., 2016, 40, 254–262 CrossRef CAS.
- C. Zhu, J. Zhaia and S. Dong, Chem. Commun., 2012, 48, 9367–9369 RSC.
- S. S. Toor, L. Rosendahl and A. Rudolf, Energy, 2011, 36, 2328–2342 CrossRef CAS.
- S. Sahu, B. Behera, T. K. Maitib and S. Mohapatra, Chem. Commun., 2012, 48, 8835–8837 RSC.
- H. Huang, J. Lv, D. Zhou, N. Bao, Y. Xu, A. Wang and J. Feng, RSC Adv., 2013, 3, 21691–21696 RSC.
- V. N. Mehta, S. Jha and S. K. Kailasa, Mater. Sci. Eng., C, 2014, 38, 20–27 CrossRef CAS.
- F. Arcud, L. Dordevic and M. Prato, Angew. Chem., Int. Ed., 2016, 128, 2147–2152 CrossRef.
- S. Liu, J. Tian, L. Wang, Y. Zhang, X. Qin, Y. Luo, A. M. Asiri, O. A. Abdulrahman and X. Sun, Adv. Mater., 2012, 24, 2037–2041 CrossRef CAS.
- Y. Li, Y. Zhao, H. Cheng, Y. Hu, G. Shi, L. Dai and L. Qu, J. Am. Chem. Soc., 2012, 134, 15–18 CrossRef CAS.
- S. Carrara, F. Arcud, M. Prato and L. D. Cola, Angew. Chem., Int. Ed., 2017, 129, 1–6 CrossRef.
- T. Kuo, S. Sung, C. Hsu, C. Chang, T. Chiu and C. Hu, Anal. Bioanal. Chem., 2016, 408, 77–82 CrossRef CAS.
- M. J. Krysmann, A. Kelarakis and E. P. Giannelis, Green Chem., 2012, 14, 3141–3145 RSC.
- W. Lu, X. Qin, A. M. Asiri, A. O. Al-Youbi and X. Sun, J. Nanopart. Res., 2013, 15, 1344–1350 CrossRef.
- S. Y. Park, H. U. Lee, E. S. Park, S. C. Lee, J. Lee, S. W. Jeong, C. H. Kim, Y. Lee, Y. S. Huh and J. Lee, ACS Appl. Mater. Interfaces, 2014, 6, 3365–3370 CrossRef CAS.
- Y. Hu, J. Yang, J. Tian, L. Jia and J. Yu, Carbon, 2014, 77, 775–782 CrossRef CAS.
- Y. Zheng, Y. Jiao, L. Ge, M. Jaroniec and S. Z. Qiao, Angew. Chem., Int. Ed., 2013, 125, 3192–3198 CrossRef.
- X. Qina, W. Lua, A. M. Asiri, A. O. Al-Youbi and X. Sun, Sens. Actuators, B, 2013, 184, 156–162 CrossRef.
- S. N. Baker and G. A. Baker, Angew. Chem., Int. Ed., 2010, 49, 6726–6744 CrossRef CAS.
- W. Li, H. Ma, C. Lu, Y. Ma, C. Qi, Z. Zhang, Z. Yang, H. Cao and Z. Lei, RSC Adv., 2015, 5, 6869–6878 RSC.
- E. Babaee, A. Barati, M. B. Gholivand, A. Taherpour, N. Zolfaghar and M. Shamsipur, J. Hazard. Mater., 2019, 367, 437–446 CrossRef CAS.
- N. A. Azmi, S. H. Ahmad and S. C. Low, RSC Adv., 2018, 8, 251–261 RSC.
- H. Huang, C. Li, S. Zhu, H. Wang, C. Chen, Z. Wang, T. Bai, Z. Shi and S. Feng, Langmuir, 2014, 30, 13542–13548 CrossRef CAS.
| This journal is © The Royal Society of Chemistry 2019 |


