DOI:
10.1039/C9RA03503F
(Paper)
RSC Adv., 2019,
9, 22389-22400
Cyclic voltammetry growth and characterization of Sn–Ag alloys of different nanomorphologies and compositions for efficient hydrogen evolution in alkaline solutions
Received
10th May 2019
, Accepted 15th July 2019
First published on 19th July 2019
Abstract
Electrodeposition of silver, tin and their alloys from different aqueous electrolytes suffer from various environmental issues and deposits are affected by H2 evolution and metal oxide formation. In this work, these metals and their alloys are electrodeposited by cyclic voltammetry utilizing ionic liquids based on C5H14ClNO (choline chloride) that permits deposit properties control. Both Ag and Sn concentrations in the ionic liquid were varied from 0.01 to 0.15 mol L−1. Methionine effect on the reduction potential of Sn and Ag was studied. Different techniques were applied to explore the structures, morphologies, and electrochemical (EC) activities of the deposits. A single Ag3Sn phase with orthorhombic packed structure was observed for all alloys, whereas the preferred growth orientation was varied from (202) to (112) depending on Ag%. Also, the dislocation density is decreased by increasing Ag content. EDX spectra showed only Ag and Sn signals indicating the high purity of the Sn–Ag alloys. The deposit from Sn-rich liquid showed rougher and larger agglomerates at the surface than that formed from the Ag-rich liquids with or without methionine. The electrochemical activities of the deposits toward the H2 evolution reaction (HER) were investigated through electrochemical polarization (ECP) measurements and EC impedance spectroscopies (EISs). The Sn–Ag alloys possess higher performance, as a catalyst for HER using alkaline solution, than Ag or Sn electrodes. The highest rate of HER was recorded for Sn–35% Ag and Sn–97% Ag deposits, which correlated strongly to the microstructure and surface morphology. The ECP results were confirmed by EIS investigations. The measured impedance values are close-fitting to a hypothetical model for the electrode/electrolyte interface.
1. Introduction
Electrodeposition of alloys using a solution holding dissimilar metals is straightforward, but it is very difficult in practice. Alloy coating usually requires a substantially more negative potential than the reduction value of the cathodic metals to initiate the reaction at a massive rate. Experimentally, alloy deposition commonly occurrs under current controllable conditions due to the necessity of large current intensities and to minimize the practical difficulty of the processes' tools.1 However simple the conception is, it is frequently tough to adjust the chemical structure of the alloy during the electrodeposition process. This is attributed to enormous variance in the redox potentials of the constituent metals or/and variation of deposition kinetics of one metal relative to the other one. Many studies have been focused on imidazolium cations with distinct anionic species, for example, (F3CSO2)2N, PF6 and BF4.2 The resultant ionic liquids (ILs) showed relative high conductivity and low viscosity. Also, ILs can be obtained using a simple quaternary NH4+ cation and complexing the anion to reduce the freezing point and delocalize the charge effectively. Eutectic based ILs are presented by a general formula as R1R2R3R4N+XzY.3 The cation R1R2R3R4N+ is a quaternary ammonium salt like choline, ammonium, phosphonium, sulphonium. X represents the Cl− halide.4,5 Y is a complexing agent and z represents the quantitative number of required molecules. These kinds of ILs are classified into three categories2 based on Y: Y = MClx, M = Zn, Fe, Sn, Al, or Ge for category (a); Y = MClx·yH2O for category (b); and Y = RZ, Z = CONH2 or COOH or OH for category (c). The preparation of this kind is the simplest among all kinds of ILs, and is achieved by mixing two components with gentle heating through a mild endothermic reaction.3,4 The physical/electrochemical properties and speciation happening in categories (a) and (b) are widely addressed; where the ILs have been addressed for various metals. Whereas, limited investigations were accomplished utilizing category (c). Deep eutectic solvents have been created utilizing alcohols and acidic complexing agents for polymerization, electro-polishing, and electro-deposition.2 Many previous reports were focused on C5H14ClNO as a cationic ammonium salt because of its non-toxicity, biodegradability, and applicability in many household and industrial applications.2 Therefore, it could be implemented for extensive production in a cost-effective way. Here, we demonstrate how DESs are formed utilizing C5H14ClNO and (CH2OH)2 (1,2-ethanediol) and how they can be applied for the electro-deposition of Ag, Sn, and Ag/Sn alloys. Also, we studied the effect of selecting the H-bond donors upon the alloy type and solution constituents' electrochemistry. Here, silver is chosen as an element to be alloyed with tin because it possesses a high melting point and low contact resistance. Also, the Ag/Sn alloy is very essential constituent for designing high-temperature automotive connectors and for soldiers after the restrictions on the usage of Pb.6 Also, Sn and Ag metals can produce hydrogen energy using different techniques. The Ag deposition on Cu foil occurred from silver chloride (AgCl) soluble in ionic liquid under light illumination without the application of any potential. i.e., AgCl is a photosensitive chemical which decomposed into dark silver powder and chlorine under light illumination. So, black conical was used during the electrodeposition of silver-based alloys. The main objective of this study is to identify the optimal conditions for electrodepositing high-quality Ag/Sn alloys with different contents of silver and tin from nontoxic ILs. It is also the first stage of characterization of the obtained silver-tin alloys with outstanding nano-features. Also, for the first time, methionine is used as a novel additive to decrease the reduction potential of silver and tin slightly.
On the other hand, renewable energy, such as photovoltaic cells, faces a storage problem that urges the generation of suitable fuel for efficient transportation and usage. Competent hydrogen can be considered the most competitive competitor, the largest plentiful element on Earth, to substitute fossil fuels for use in many applications.20 The advance of efficient catalysts for hydrogen evolution reactions (HERs) in basic electrolytes remnants the main practical obstacle to improve the water electrolyzers, fuel cells, and other industrial devices for electrochemical energy conversion and storage. Depend on the free energy of adsorbed hydrogen intermediates; theoretically, it is highly expected that alloys of tin and silver are active for these reactions.20 Consequently, we synthesized binary nano-crystalline Sn/Ag alloys of different morphologies and Sn/Ag ratios and showed that the optimum Sn/Ag alloys are actually more effective than individual constituents (Sn or Ag) for electrochemical HERs. Also, we showed the impact of using novel additive (methionine) on Sn/Ag alloy and its effect on HER and impedance. Methionine is a sulfur-containing proteinogenic amino acid (C5H11NO2S) with high solubility in water (53.7 g/1 L @ (20 °C)), low melting point (281 °C), and reversible oxidation state.21 Methionines is acting as an intermediate in the biosynthesis of different phospholipids, is important in the single-carbon metabolism, and can be easily obtained from food (vertebrate and plant sources) and used as supplier of sulfur and a few other compounds. Methionine may act as a redox sensor and can be used as a nontoxic pesticide option against giant swallowtail caterpillars.22,23 Li et al. used methionine as an eco-friendly corrosion inhibitor for Cu–Ni alloy.24 Additionally, we carried the electrochemical polarization (ECP) measurements and EC impedance spectroscopies (EISs) to evaluate the electrochemical activities of the deposits toward HERs.25
2. Experimental details
2.1. Chemicals
C5H14ClNO [Choline Chloride; ChCl] (Sigma Aldrich 99%) was formed using absolute C2H5OH [ethanol] after filtration and drying under vacuum. (CH2OH)2 [ethylene glycol; EG; > 99%], silver chloride (>99%), tin chloride (≥99%), and methionine were obtained from Sigma-Aldrich. Also, alumina paste (Shandong Luxin Mount Tai Co., China) and dichloromethane (Merck, Darmstadt, Germany) were used.
2.2. Ionic liquid preparation
Mixtures were prepared by mixing up the C5H14ClNO and (CH2OH)2 together at molar ratio 1![[thin space (1/6-em)]](https://www.rsc.org/images/entities/char_2009.gif) :2 using magnetic stirring at 100 °C looking forward a colorless identical liquid formation. The prepared ionic liquid was kept at 30 °C.
:2 using magnetic stirring at 100 °C looking forward a colorless identical liquid formation. The prepared ionic liquid was kept at 30 °C.
2.3. Electro-deposition of Sn, Ag, and Sn/Ag alloys
The cyclic voltammetry deposition was carried out using Voltalab potentiostat (Model PGZ 100). A three-electrode cell was designed for the electro-deposition experiments. This cell is consisting of 0.5 mm diameter Pt electrode, Pt counter electrode, and Ag wire reference electrode. 0.3 ml Al2O3 paste is used to polish the working electrode. After that, the working electrode is rinsed and dried before usage. All voltammograms are measured at a scanning rate of 50 mV s−1 and temperature 40 °C.1,2,9 Hull cell panels had been prearranged by cleaning with deionized H2O and drying, degreased in dichloromethane (DCM) for two minutes, then removed and dried. The cell is filled with 1:2C5H14ClNO:(CH2OH)2 ionic liquid containing Ag ion (0.05–0.15 mol L−1) and Sn ion (0.03–0.075 mol L−1). The plating experiments were performed by the potentiostatic and galvanostatic method. For deposition by the potentiostatic method, the potentiostat was used for maintaining the specific potential during deposition experiments. For galvanostatic deposition, adjustable power supply (Thurlby-Thandar) and digital fluke multimeter were used.
2.4. Samples characterization
The surfaces of deposited alloys were imaged using scanning electron microscope (SEM, Quanta 250 FEG (FEI Company, Eindhoven, Holland)), and chemicals compositions were quantitatively examined using the accompanied energy dispersive X-ray unit (EDX). X-ray diffraction charts for the deposited alloys are assessed utilizing X-ray diffractometer with X-ray generator (Phillips model PW 1730), diffractometer (PW 1716) and detector (PW 1050/25). Cu (λKα = 0.154 cm−1) was used as an anode at 40 kV accelerating voltage, 35 mA current, 0.02° scanning rate within angle ranged from 10 to 90°.
3. Results and discussion
3.1. Electrochemical measurements
3.1.1. Deposition of tin. The cyclic voltammetry plots were measured with a scan rate 50 mV s−1 and potential range −2 to +2 V using the electroplating baths of SnCl2 to identify the appropriate current and potential for electroplating of Sn. A double jacket cell provided with Pt electrodes as working and countering electrodes and a saturated calomel electrode as a reference electrode was used. The solvent was an ionic liquid of C5H14ClNO and (CH2OH)2 (1:2). Fig. 1(a) shows cyclic voltammetry curves using SnCl2 solutions of concentrations 0.03, 0.05 and 0.075 mol L−1. The cathodic and anodic current peaks were detected. As shown, the reduction process of tin(Sn) started at −0.682 V and reaching the maximum value at peak of cathodic potential (Epc) equal −789, −760, and −857 mV using concentrations 0.03, 0.05 and 0.075 mol L−1, respectively. The height of the cathodic current peak and anodic current peaks is increased with increasing SnCl2 concentration. The peak cathodic current densities (Ipc) were −2.78, −4.77, and −24.77 mA cm−2, respectively. On the contrary sweep, two oxidation peaks are observed. The values of peak anodic current densities were 3.788, 13.672, and 30.563 mA cm−2 for Ipa1 and 1.481, 5.731, and 6.016 mA cm−2 for Ipa2 at concentrations 0.03, 0.05 and 0.075 mol L−1, respectively. The values of peak 1 anodic potential (Epa1) were −537, −506, and −463 mV, respectively. The full-width half-maximum (FWHM) of cathodic peaks were 152, 101, and 152 mV, respectively. FWHM values for anodic peak1 were 87, 120, and 131 mV at concentrations 0.03, 0.05 and 0.075 mol L−1, respectively. Therefore, a single reduction peak was observed due to the reduction of Sn2+ to Sn0 and two oxidation peaks rising from the oxidization back of metal to Sn2+. This agrees well with the work that carried out by other researchers.10 This was not likely to be the reaction scheme for the formation of Sn4+ to Sn2+ as stated above.11 This reaction is likely to occur in basic electrolyte because Sn4+ with six chloride complex is not stable in an acidic electrolyte.
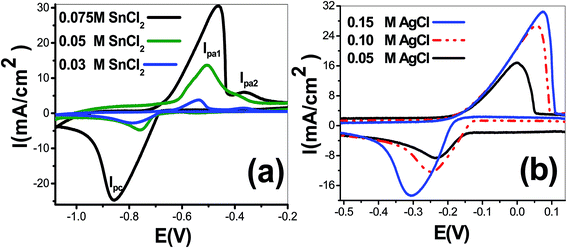 |
| | Fig. 1 Cyclic voltammetry curves at scanning rate 50 mV s−1 for a Pt electrode immersed in 1 ChCl:2 EG with different concentration of (a) SnCl2 and (b) AgCl. | |
3.1.2. Deposition of silver. Electroplating baths of AgCl were used for the deposit of Ag using cyclic voltammetry at 50 mV s−1 scanning rate and potential ranged from −2 to +2 V to determine the appropriate current and potential for electroplating. The used concentrations of AgCl were 0.05, 0.1 and 0.15 mol L−1. The voltammograms in Fig. 1(b) showed a single reduction peak which was due to the reduction of Ag+ to Ag0 and peak rising from the oxidation back of metal to Ag+. The reduction peak was observed at −235, −248, and −307 mV with Ipc of −8.64, −12.39, and −18.75 mA cm−2 and FWHM of 129.7, 130.6, and 133.2 mV at AgCl concentrations of 0.05, 0.1 and 0.15 mol L−1, respectively. i.e., the reduction potential, current density, and FWHM are increased by increasing AgCl concentration. Also, the oxidation peak is observed at 1, 55, and 73 mV with Ipa of 16.83, 26.81, and 30.45 mA cm−2 and FWHM of 112.4, 126.2, and 133.2 mV at AgCl concentrations of 0.05, 0.1 and 0.15 mol L−1, respectively. Then, the height of the anodic current peak increased with increasing AgCl concentration.
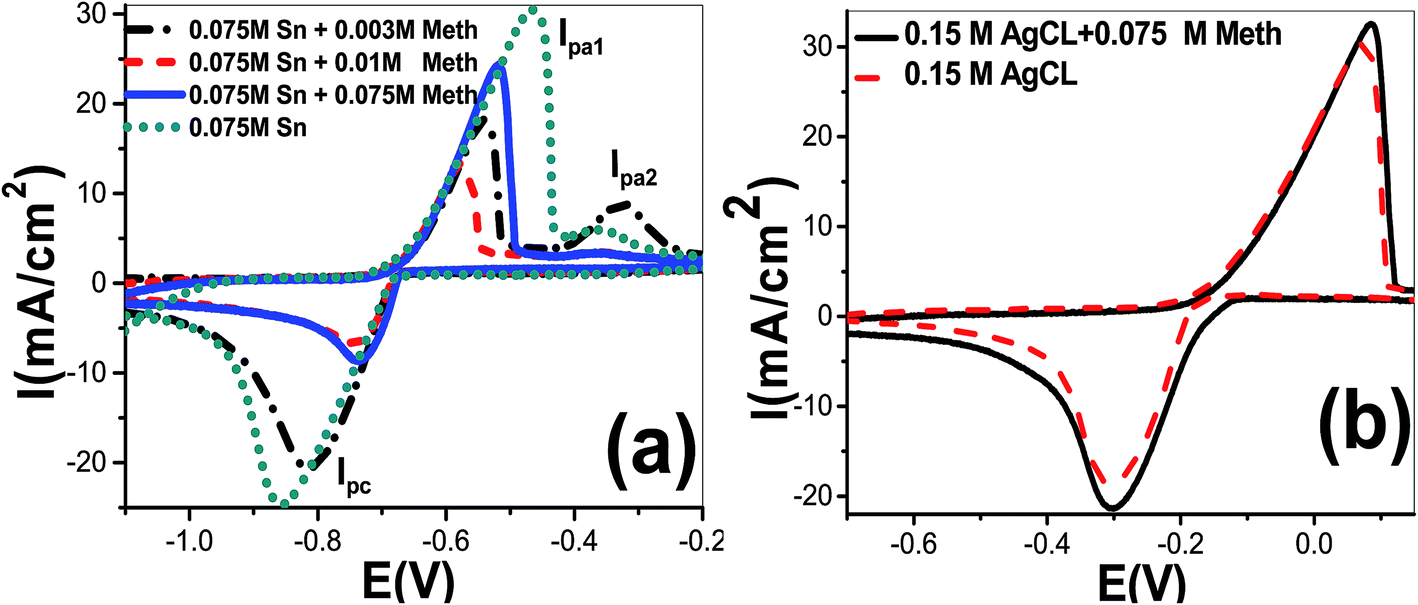
3.1.3. Influence of methionine on the reduction potential of Sn. Fig. 2(a) displays the influence of methionine (C5H11NO2S) on the reduction potential of Sn. In the absence of methionine, the reduction of Sn2+ to Sn0 starts to take place at about −674 mV. The position of the reduction peak is reduced from −857 mV to −816 mV and its current density is decreased from −24.77 to −20.67 mA cm−2 with the addition of 0.003 mol L−1 methionine. By increasing the concentration of methionine to 0.075 mol L−1, the reduction peak potential is shifted to −737 mV with Ipc = −8.67 mA cm−2, a change of 120 mV to a more positive potential. Methionine is an α-amino acid which contains an α-amino group (which is in the protonated –NH3+ form), an α-carboxylic acid group (which is in the deprotonated –COO− form), and an S-methyl thioether side chain (which is nonpolar). So, the simplicity of Sn2+ reduction to Sn may be ascribed to inner-electron transfer depending upon the existence of electron-rich groups such as a carboxylate, or unpaired electrons that might be found in methionine sulfur. Then, the effect of neighboring group participation in the reduction is significant in Sn/methionine complex.
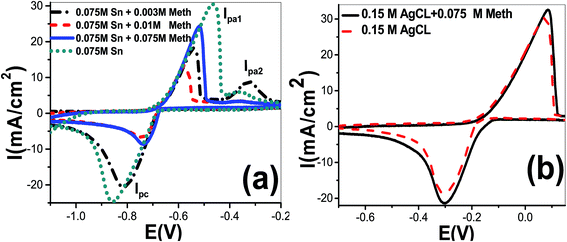 |
| | Fig. 2 Cyclic voltammetry curves at 50 mV s−1 scanning rate for a Pt electrode immersed in 1 ChCl:2 EG to show the effect of methionine with different concentration of (a) SnCl2 and (b) AgCl. | |
On the converse scanning, two peaks were detected from the oxidation of Sn0 to Sn2+. Besides, the anodic peaks for tin were shifted from Epa1 = −463 mV and Epa2 = −361 mV to −540 mV and −368 mV, respectively, after the incorporation of 0.003 mol L−1 methionine. Also, the reduction in peak1 current density was reduced from Ipa1 = 30.56 mA cm−2 to 18.27 mA cm−2. By increasing concentration of methionine to 0.01 mol L−1, the anodic peak 1 potential is shifted to −578 mV with Ipa1 = 13.38 mA cm−2. So, the addition of methionine strongly effects on oxidation of Sn0 to Sn2+ ions. This agrees well with previously reported works utilizing other additions.12–14
3.1.4. Influence of methionine on the reduction potential of Ag. Fig. 2(b) showed the influence of methionine on the oxidation and reduction potentials of Ag. Without methionine, the reduction of Ag+ to Ag0 starts to happen at about −167 mV. The position of the reduction peak is reduced from −307 mV to −301 mV and its current density is changed from −18.75 to −21.42 mA cm−2 with the addition of 0.075 mol L−1 methionine. On the inverse scanning, Fig. 2(b), only one stripping peak is detected due to the oxidation of Ag0 to Ag+. Additionally, the anodic peak of silver is shifted to more positive potential from 73 to 85 mV, which indicates that the incorporation of methionine effects on oxidation of Ag0 to Ag+. Also, the anodic peak current density was increased from Ipa = 30.45 mA cm−2 to 32.55 mA cm−2 with the addition of 0.075 mol L−1 methionine. From Fig. 2(a and b), it is noted that the gap between the reduction peaks of tin and silver is reduced from 550 mV without methionine to 436 mV with the addition of 0.075 mol L−1 methionine. Ag/Sn alloys cannot be freely co-deposited because the reducing potential of the constituents (Ag, Sn) are far apart.11 Two strategies are followed to partly solve this issue; preserving a small concentration of the more noble metal in the solution and introducing additives to reduce the potential gap.11–13 Therefore, a small concentration of Ag will be optimized and used in our study. This approach has been applied through many studies for different structures which includes Cu/Ni and Cu/Co, in which there is a wide potential gap between the depositing potentials of the two metals.15,16 The 2nd approach that used to simplify co-deposition is the reduction of the potential gap between the two constituents utilizing additives such as methionine.17 Therefore, the inclusion of methionine can facilitate the (Sn, Ag) co-deposition by reducing the potential gap between the reduction peak of silver and reduction peak of tin. These findings agree well with the results of Low and Walsh for the deposition of Cu–Sn alloys utilizing other additives.12
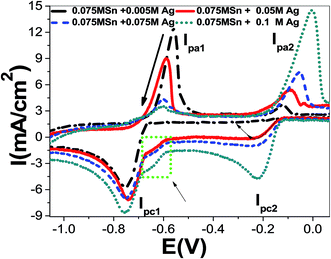
3.1.5. Co-deposition of silver and Tin. Fig. 3 displays cyclic voltammograms for a solution holding both Ag and Sn ions measured at 50 mV s−1 scan rate and potential range of −2 to +2 V to determine the appropriate current and potential for the electro-deposition of Sn/Ag alloys. The concentration of SnCl2 was kept at 0.075 mol L−1 and AgCl concentration was varied from 0.005 to 0.1 mol L−1. The first observed cathodic peak at Epc1 = −752 mV with Ipc1 = −5.7 mA cm−2 can be attributed to Sn/Sn– Ag alloy. As the AgCl concentration increased to 0.1 mol L−1, the width of the cathodic peak 1 increased and the current density also increased to −8.69 mA cm−2. Another cathodic peak 2 centered at −232 mV with current density −0.23 mA cm−2 was observed at 0.05 mol L−1 AgCl. This peak is shifted to −220 mV and the current density increased to −4.77 mA cm−2. A third cathodic peak for Sn–Ag alloy was observed at about −0.6 V and its current density is highly increased in the potential window from −0.60 to −0.67 V for AgCl concentration ≥ 0.05 mol L−1 as indicated in Fig. 3. The height of the cathodic current peak increases with the increase of AgCl concentration. The reverse scan shows two anodic stripping peaks positioned at Epa1 = −559 mV and Epa2 = −121 mV with current densities of Ipa1 = 12.36 mA cm−2 and Ipa2 = 3.67 mA cm−2 for 0.005 mol L−1 AgCl. As AgCl concentration increased to 0.10 mol L−1, the anodic peaks are shifted to −608 mV and −2 mV. The current density of the first anodic peak is decreased to Ipa1 = 3.58 mA cm−2 whereas the current density of the second peak is increased to Ipa2 = 14.55 mA cm−2. The observed peaks positions are different from peaks stripping potentials of tin, Fig. 1(a), and silver, Fig. 1(b).
 |
| | Fig. 3 Voltammograms (scanning rate 50 mV s−1) for a Pt electrode (0.50 mm diameter) dipped in 1 ChCl:2 EG with different concentration of AgCl and 0.075 mol L−1 SnCl2. | |
3.2. Structural and morphological properties of Ag/Sn deposits
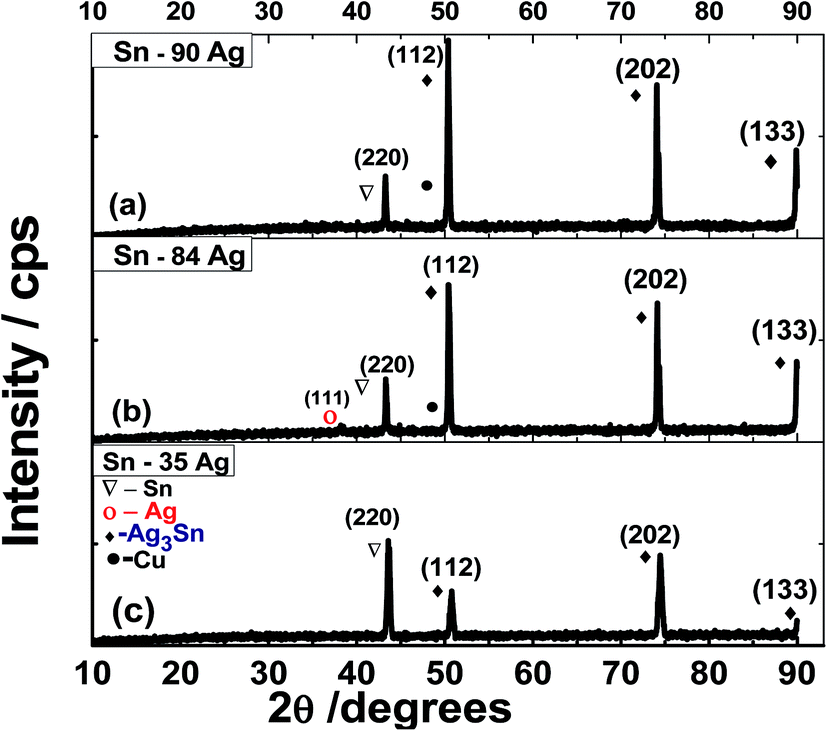
3.2.1. Structural properties. The structural properties of the Sn/Ag alloys were investigated using X-ray diffraction (XRD). Fig. 4 illustrated XRD charts of Sn/Ag alloys deposited using AgCl solutions of different concentrations with ionic liquid of C5H14ClNO and (CH2OH)2 (1:2) as a solvent. This XRD analysis clearly demonstrates the polycrystalline nature of all deposited Sn/Ag-based films. All films illustrated intensive peaks related to Ag/Sn alloy.
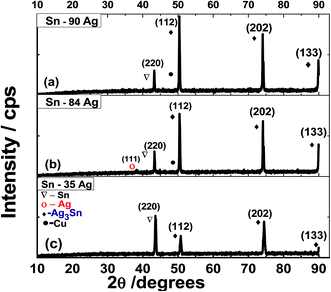 |
| | Fig. 4 XRD charts of (a) Sn–90% Ag, (b) Sn– 84% Ag and (c) Sn–35% Ag. | |
The XRD peaks of Ag/Sn were observed at 2θ = 50.7, 74.39, and 89.9° and indexed to (112), (202), and (133) planes of Ag3Sn phase for Orthorhombic packed structure (a = 0.2995 nm, c = 0.4780 nm, c/a = 1.5960; JCPDS card: 00-004-0800),17 correspondingly. In all alloys, no other Ag3Sn crystalline phases could be detected proving the singularity of the orthorhombic Ag/Sn phase and the successful production of this alloy. Also, the peak observed at 43.2° indicates the presence of tetragonal Sn phase along (200) orientation.18,19 However, the intensity of this peak decreased by increasing Ag concentration. Very tiny (111) Ag is observed in Fig. 4, especially for Ag% ≥ 84%.18 This confirms the successful growth of the Ag/Sn alloys. By increasing the Ag% from 35% to 90%, the (112) peak becomes more intense than (202) peak. This reveals the change of the preferred growth orientation from (202) at 35% Ag to (112) at 90% Ag. This may be credited to the variation of equilibrium surface concentration with Ag% toward the minimizing of the alloy surface energy or setting the segregation energy near to zero.20 Also, no shifts are detected for XRD peaks. This indicates that most of Ag ions are incorporated into the alloys.17,25
The average crystallite size of the alloy is calculated using values of full width at half maximum (W) for the main three Ag/Sn peaks through Scherrer's equation; Ds = 0.94λ/Wcosθ; in which θ and λ are the Bragg's angle and X-ray wavelength.26,27 Also, the texture coefficients (TCs) and dislocation densities are calculated.26,28 The calculated structural parameters are presented in Table 1. The average Ds values are 63.94 nm, 69.32, 55.04 nm for alloys with 90% Ag, 84% Ag and 35% Ag, respectively. Whereas the (112) crystallite sizes are 63.70, 61.01, and 27.48 nm for the same alloys. Generally, the reduction in the crystallite size could be accredited to the creation of new nucleating centers caused by the reduction in the nucleation energy barrier.26 The reduction of TC values from 1.37 to 1.27 and 0.87 proving the preferred growth of Ag/Sn along (112) as the Ag% increased and along (202) as the Sn% increased in the alloy. Also, the density of crystal imperfections, especially dislocation density is decreased by increasing Ag% and increased by increasing Sn%.
Table 1 The structural parameters of Sn–Ag alloy samples prepared on Cu substrate grown from 1 ChCl:2 EG
| Compound name |
Tin (Sn) |
Silver tin (Ag3Sn) |
Silver tin (Ag3Sn) |
Silver tin (Ag3Sn) |
| 2θ (deg) |
43.20 |
50.70° |
74.39° |
89.9° |
| Planes |
(220) |
(112) |
(202) |
(113) |
| Crystal system |
Tetragonal |
Orthorhombic |
| FWHM (degree) |
(a) |
0.0984 |
0.1378 |
0.1440 |
0.20 |
| (b) |
0.1440 |
0.1440 |
0.1200 |
0.18 |
| (c) |
0.1440 |
0.32 |
0.1440 |
0.20 |
| I/Io% |
(a) |
25.16 |
100 |
73.71 |
45.89 |
| (b) |
32.74 |
100 |
85.97 |
51.14 |
| (c) |
100 |
52.25 |
98.96 |
29.54 |
| D (nm) |
(a) |
86.83 |
63.70 |
69.11 |
56.18 |
| (b) |
59.38 |
61.01 |
83.09 |
62.42 |
| (c) |
59.42 |
27.48 |
69.26 |
56.18 |
| TC |
(a) |
— |
1.37 |
1.01 |
0.63 |
| (b) |
— |
1.27 |
1.09 |
0.65 |
| (c) |
— |
0.87 |
1.64 |
0.49 |
| Dislocation density (dis per nm2) |
(a) |
132.64 |
246.45 |
209.37 |
316.84 |
| (b) |
283.61 |
268.66 |
144.84 |
256.66 |
| (c) |
283.23 |
1324.24 |
208.47 |
316.84 |
3.2.3. Morphological properties of Ag/Sn alloys using SEM. The surface morphology of the deposited alloys is studied using a scanning electron microscope (SEM). SEM images of four different Sn/Ag alloys formed on the surface of Cu foil from 1 ChCl:2 EG are displayed in Fig. 6(A–D). From SEM images, it is evident that the morphology of the alloy can be reformed by governing its chemical composition. It is important to note from Fig. 6(A) that rougher and larger precipitates can be observed in the microstructure that deposited from the Sn-rich liquid than that formed from the Ag-rich liquid in Fig. 6(B and C) or formed from the Ag-rich deposit with methionine in Fig. 6(D). The change of alloy morphology and roughness with the change in composition may be ascribed to the change in the rate of deposition, Fig. 3; the electrochemistry of the components in solution, specially the strong hydrogen bond donors (ChCl:ethylene glycol) and metals concentration (Ag, Sn). At a high current density in the rich Sn solution, the deposited alloy is irregular with low crystallinity and small crystallite size. By increasing Ag content in Sn rich solution, the surface of the deposited alloy becomes porous at higher current density with high crystallites sizes and smooth surface due to the simultaneous hydrogen evolution and self-agglomeration of the crystallites. Similar results were reported by Sharma et al. about the effect of current density in the morphology of Sn deposits.29
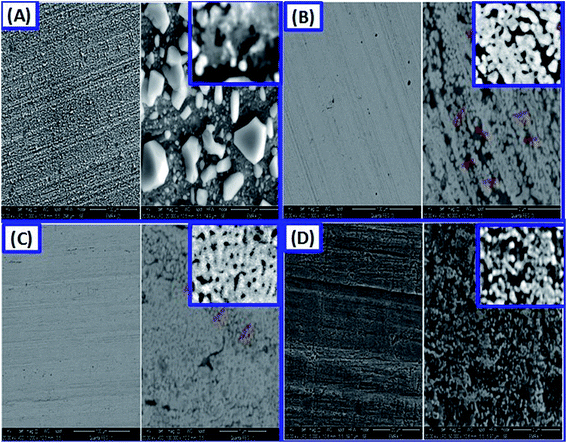 |
| | Fig. 6 SEM images of Sn–Ag alloys grown from 1 ChCl:2 EG containing (A) 0.075 mol L−1 SnCl2 + 0.00075 mol L−1 AgCl @ 20 mA cm−2 and 1 V for 25 min; (B) 0.075 mol L−1 SnCl2 + 0.005 mol L−1 AgCl @ 17 mA cm−2, 1 V for 20 min; (C) 0.075 mol L−1 SnCl2 + 0.05 mol L−1 AgCl @ 12 mA cm−2 and 1 V for 25 min; and (D) 0.075 mol L−1 SnCl2 + 0.075 mol L−1 AgCl + 0.0075 mol L−1 methionine @ 10 mA cm−2 and 0.8 V for 20 min. | |
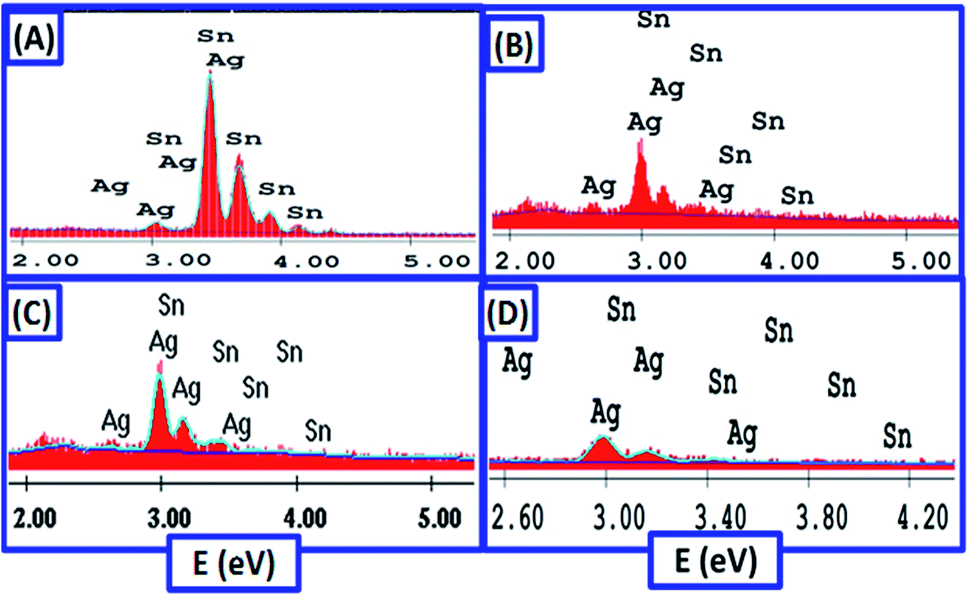
Spherical and granular structures are observed in Fig. 6(A), whereas the quantitative analysis for the alloy is 65% Sn and 35% Ag from Fig. 5(A). The SEM images of the alloy in Fig. 6(B–D) show that the method has been successful with silver-rich alloys. With increasing the Ag%, smooth surfaces are obtained as shown in Fig. 6(B and C) because of the increase of Ag concentration in the 1 ChCl:2 EG solution and the noticeable decrease in the observed current density. However, the alloy in Fig. 6(C) with 97% Ag shows more homogeneous and smooth surface than that of the alloy with 65% Ag% (Fig. 6(B)). As presented in the inset of Fig. 6(C), the nanoparticles of the alloy are agglomerated and to some degree form a nanoporous film with a homogenous surface. This nanoporous nature may be the reason for the existence of very limited XRD Cu signal in Fig. 4(b). In Fig. 6(D), the use of the additive substances like the methionine addition to 1 ChCl:2 EG advances the surface morphology of the deposited film and prevents the agglomeration. Such combination produces fine spherical nanogranules of Ag–Sn alloy. As observed, the surface morphologies are influenced by the electro-deposition current density and the addition of methionine decreases the current density from 20 mA cm−2 at 1 V to 10 mA cm−2 at 0.8 V. Also, the addition of methionine reduces the deposition time from 25 to 20 min because of its catalytic effect.
3.3. Open circuit potentials measurements
The open circuit potentials (OCPs) of Sn, Ag, Sn–35Ag, Sn–90Ag, Sn–94Ag, and Sn–97Ag alloys were drawn over 60 min in 0.5 mol L−1 NaOH solution and shown in Fig. 7(A). An increase in the OCP was recorded in the first few minutes for Sn, Sn–90Ag, Sn–94Ag, and Sn–97Ag alloys. Then, the steady states were achieved for 25 min. For these electrodes, OCPs become more positive with time referring to a natural affinity of Sn, Sn–90Ag, Sn–94Ag, and Sn–97Ag for passivation in ILs. The Ag and Sn–35Ag electrodes show reverse behavior with remarkably negative steady-state OCPs. The measurements are suggesting that the HER on Sn–35Ag and Sn–97Ag alloys will occur at lower potentials than other alloys.
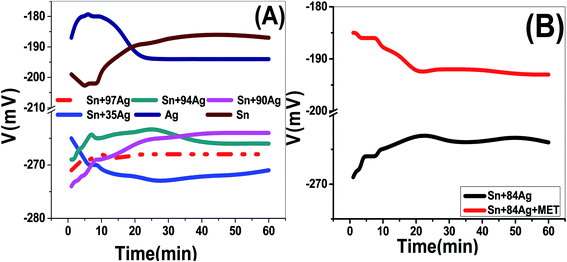 |
| | Fig. 7 Variation of the open-circuit potential with time for electrodeposited (A) Nano Ag, Sn, and Sn–Ag alloys, and (B) methionine/Sn–Ag immersed in stagnant aerated NaOH solution (0.5 mol L−1) at 25 °C. | |
The effect of methionine addition on the OCP of Sn–84Ag electrode was recorded over 1 h in 0.5 mol L−1 NaOH solution and shown in Fig. 7(B). Within the first 22 min, OCP is increased for Sn–84Ag and decreased for Sn–84Ag with methionine. Then, the OCP of both electrodes reached the steady-state value. Also, the OCP shifted towards more positive values for Sn–84Ag and towards more negative values for Sn–84Ag with methionine. The OCP at the steady state is reduced by 72 ± 2 mV after the addition of methionine to Sn–84Ag alloy, suggesting the catalytic contribution of methionine.
3.4. Electrocatalytic activities
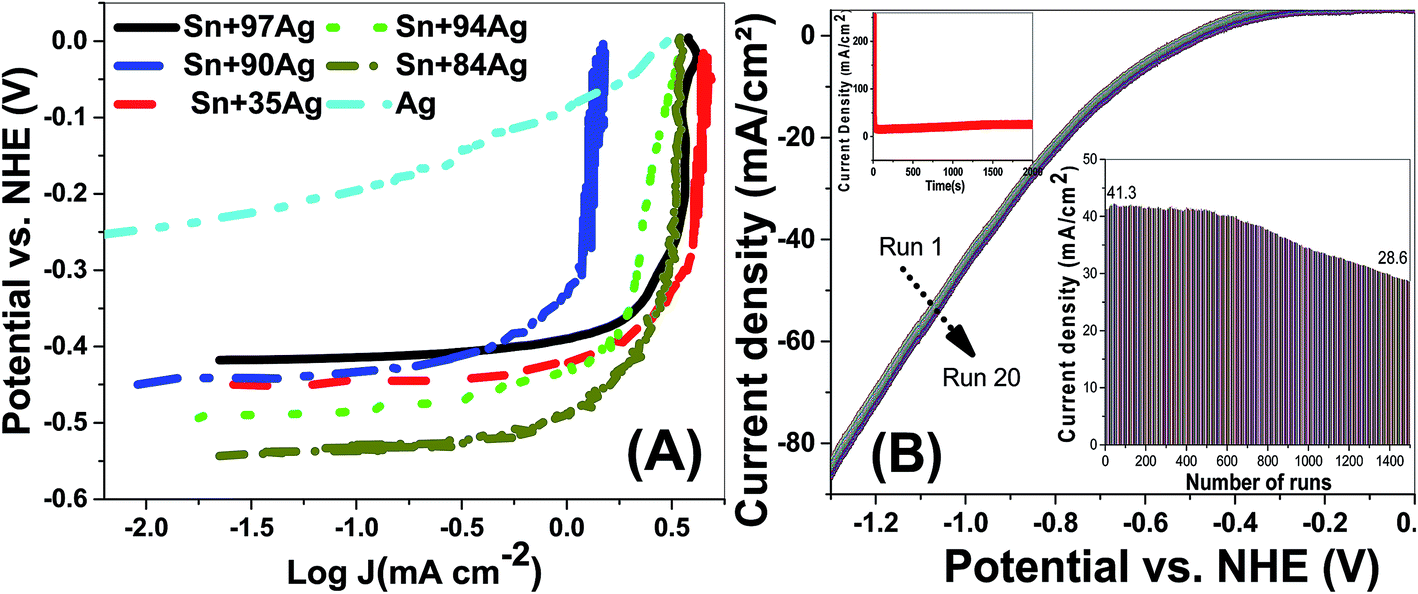
3.4.1. Polarization measurements. The electrocatalytic activities of the deposited Sn–Ag films (cathodes) for HERs were studied thru electrochemical polarization (ECP) measurements and EC impedance spectroscopies (EISs) in 0.5 mol L−1 NaOH solution. The HERs in alkaline liquids occurs thru three reactions:30,31 (i) Volmer reaction (reduction of H2O molecule and adsorption of hydrogen on the electrode surface; H2O + M + e− ↔ MH(ad)+ HO−), (ii) Heyrovsky reaction (desorption of the surface H-atom, formation of H2 and concurrent reduction of one H2O molecule; MH(ad)+ H2O + e− ↔ M + HO− + H2), and (iii) Tafel reaction (combination of two adjacent adsorbed H-atoms and formation of H2 molecule; 2MH(ad) ↔ 2M + H2). The interaction strengths of M-H2O and M-Hads plays the main character in the mechanisms and kinetics of HERs. Both Volmer–Heyrovsky reaction and Volmer–Tafel reaction started with M–Hads formation and ended with M–Hads bond dissociation. The strong M–H2O interaction is favorable for H2O splitting but the so strong interaction will obstruct H2 desorption. So, the model cathode must balance the formation and dissociation reaction of M–Hads to obtain high rates of HERs.32,33 The electrocatalytic activities for HERs were evaluated thru ECP measurements and displayed in Fig. 8 using electro-deposited Sn–Ag cathodes with varied Ag% in 0.5 mol L−1 NaOH solution. The experimentally measured potential versus Ag/AgCl, EAg/AgCl, was calibrated with respect to the NHE (normal/standard hydrogen electrode), ENHE, according to the Nernst equation;34 ENHE = EAg/AgCl + E0Ag/AgCl + 0.059 pH (at 25 °C). Where E0Ag/AgCl = 0.1976 V at 25 °C, and the HER experimental recorded in 0.5 M NaOH solution (pH = 13.69). From Fig. 8, the activity of Sn–35Ag, Sn–97Ag alloy is notably higher than ed. Sn, ed. Ag.35 The hydrogen reduction overpotential and current density are considered the main characters to control the electrodes activities and rates of HERs. Hence, the rate of hydrogen evolution is directly proportional to the cathodic current density. Table 3 displayed the estimated current densities for the different electrodes at different potential values. Fig. 8 and Table 3 clearly confirm the increase of current density and hence hydrogen production rate by rising Ag% from 84% up to 97%. Also, the hydrogen production rate is increased by raising the applied potential. A clear assessment of the catalytic activities of the varies cathodes at a particular potential is obtained from Fig. 8, whereas the overpotentials are decreased and hydrogen production rates are increased, i.e., the cathodic current densities are increased,8,36 except in the case of methionine additive, a noticeable decrease is observed in the hydrogen overpotential and production rate. The best alloys that give a high rate of hydrogen production are Sn–35Ag and Sn–97Ag. This may be accredited to the nanoporous structure which possesses higher surface area. The higher evaluation activities of Sn–Ag may result from the synergistic combination of Sn and Ag. The main reason for high hydrogen evolution using Sn–97Ag is due to the increase of silver content in the alloy. But in case of Sn–35Ag, the HER may be related to the structural and morphological properties of this alloy like the existence of mixing tetragonal Sn and orthorhombic (202) Ag3Sn, and the existence of spherical and granular structures at the surface to produce rough high surface area to volume ratio.37 The relatively low electrocatalytic activity of Sn–84Ag, Sn–90Ag alloys could be attributed to the smooth surface which leads to the small surface area to volume ratio.7 Table 4 displayed the steady state potential and the starting potential of hydrogen evaluation for all electrodes under identical conditions. The steady state potentials of Sn–Ag cathodes are more negative than that recorded for Sn or Ag. Then, the nanostructured nature of the electrodes enhances the catalytic activities of the electrodes for efficient HERs. The increase of the Ag content up to 84% to 97% result in a reduction of the cathodic overpotential by about 185 mV (−1580 mV for Sn–84Ag and −1395 mV for Sn–97Ag). Both of the Sn–35Ag and Sn–97Ag give high current densities and low overpotentials. Also, both of the Sn–35Ag and Sn–97Ag exhibited a reasonably more positive overpotential relative to the other Sn–Ag alloys, indicating the enhanced electrocatalytic activity of both Sn–35Ag and Sn–97Ag alloys towards the HER.8
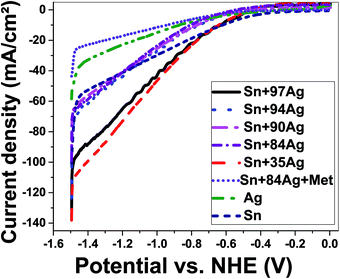 |
| | Fig. 8 Cathodic polarization for electrodeposited nano Ag, Sn, Sn–Ag alloys, and methionine/Sn–Ag dipped in NaOH solution (0.5 mol L−1) at 25 °C. NHE (normal/standard hydrogen electrode). | |
Table 3 Values of H2 evolution rate of deposited Sn, Ag, Sn–Ag alloys, and methionine/Sn–Ag alloy dipped in 0.5 mol L−1 NaOH solution at 25 °C
| Materials |
i−2.5 V (mA cm−2) |
i−2.2 V (mA cm−2) |
i−1.9 V (mA cm−2) |
i−1.6 V (mA cm−2) |
i−1.3 V (mA cm−2) |
i−1.0 V (mA cm−2) |
| Sn–84Ag |
98.86 |
40.47 |
15.65 |
1.29 |
2.97 |
3.46 |
| Sn–90Ag |
100.79 |
40.93 |
23.93 |
8.74 |
1.61 |
0.51 |
| Sn–94Ag |
123.49 |
43.45 |
19.21 |
2.25 |
2.31 |
2.72 |
| Sn–97Ag |
135.87 |
64.26 |
31.23 |
6.99 |
2.57 |
3.79 |
| Sn–35Ag |
138.13 |
72.16 |
33.67 |
6.90 |
3.78 |
4.51 |
| Sn–84Ag + Met |
43.62 |
16.94 |
8.58 |
2.14 |
0.46 |
0.13 |
| Ag-deposited |
97.81 |
40.63 |
17.86 |
2.77 |
1.42 |
1.54 |
| Sn-deposited |
58.45 |
22.68 |
10.96 |
3.51 |
0.23 |
3.11 |
Table 4 The values of steady-state potential, H2 evolution potential, and cathodic H2 overpotential in 0.5 mol L−1 NaOH at 25 °C
| Materials |
Ess/mV |
EHydrogen evolution/mV |
Cathodic hydrogen overpotential/mV |
| Sn–84Ag |
−264 |
−1580 |
−1316 |
| Sn–90Ag |
−264 |
−1548 |
−1284 |
| Sn–94Ag |
−266 |
−1560 |
−1294 |
| Sn–97Ag |
−268 |
−1395 |
−1127 |
| Sn–35Ag |
−271 |
−1420 |
−1149 |
| Sn–84Ag + Met |
−187 |
−1285 |
−1098 |
| Ag-deposited |
−194 |
−1490 |
−1296 |
| Sn-deposited |
−193 |
−1362 |
−1169 |
The effect of methionine addition during the deposition of Sn–84Ag alloy on the amount of hydrogen evolution (current density) can be figured out from curves of methionine/Sn–84Ag and Sn–84Ag electrodes in Fig. 8. As the potential changed from −1 V to −2.5 V, the current density is changed from +3.46 to −98.86 mA cm−2 for Sn–84Ag electrode and from +0.13 to −43.62 mA cm−2 for methionine/Sn–84Ag electrode. This means that Sn–84Ag electrode showed higher catalytic activity than methionine/Sn–84Ag during the HER measurements. Also from Table 4, the addition of methionine to Sn–84Ag shifts the cathodic hydrogen overpotential and hydrogen evolution potential to the positive direction, which can be confirmed by the obtained results in Fig. 2. Although the role of the methionine in reducing the reduction potential of Sn2+ to Sn during deposition of Sn–Ag alloy, however its use is suppressing the catalytic activity of Sn–84Ag electrode.
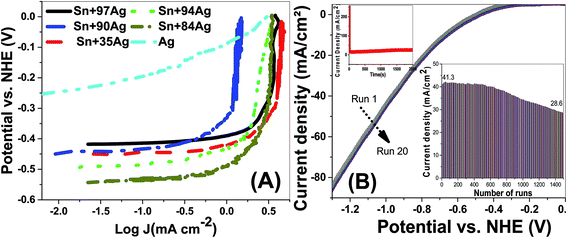
To understand the HER mechanism Tafel slopes were derived from the polarization curves, Fig. 8. The Tafel slopes of the HERs were estimated by considering the linear portions of the ENHE − log(J) plots as shown in Fig. 9(A). The obtained Tafel slopes (β1 and β2) at low and high overpotential domains of Ag and Sn–Ag electrodes are presented in Table 5. These values can be used as a guide to identifying the HER mechanisms, a Tafel slope of ∼30 mV per decade suggests that the mechanism proceeds through Volmer–Tafel mechanism and the recombination step is rate limiting. A Tafel slope of ∼40 mV per decade suggests hydrogen production via the Volmer–Heyrovsky mechanism and the electrochemical desorption step is rate-limiting. Finally, a Tafel slope of ∼120 mV per decade may arise from various reaction pathways depending on the surface coverage of adsorbed hydrogen. Because Tafel slope simply tells us how much the overpotential should be increased to increase the reaction rate by a factor ten, then the obtained values for Sn–35Ag and Sn–97Ag can be used to confirm their high performance in HER.
 |
| | Fig. 9 (A) Tafel slopes for HER using different electrodes in 0.5 M NaOH at 25 °C and (B) stability study as a function of the number of runs and evolution time. | |
Table 5 Tafel slopes (β1 and β2) at low and high overpotential domains of Ag, and Sn–Ag electrodes prepared with different Ag%
| Alloys |
β1 (mV dec−1) |
β2 (mV dec−1) |
| Sn–35Ag |
15.1 |
109.0 |
| Sn–84Ag |
27.7 |
130.1 |
| Sn–90Ag |
28.5 |
204.8 |
| Sn–94Ag |
24.1 |
191.9 |
| Sn–97Ag |
12.2 |
108.1 |
| Ag-deposited |
29.3 |
117.3 |
The electrochemically active surface area (ECSA) of the electrodes was calculated using ECSA = Q/(mC) where Q is hydrogen adsorption charge in the negative-going scan after correction for double-layer charging, m is the catalyst mass loading, and C is the charge of full monolayer coverage of H atoms onto electrode.38 Q is obtained by integrating the current–potential curve and then by dividing the calculated value by the scan rate of the measurement. The ECSA values of Sn–Ag alloys relative to pure Ag (16.69 m2 g−1) were estimated to be ∼2.62, 1.69, 1.61, 1.51, and 2.88. For Sn–Ag electrodes with different Ag ratios of 97%, 94%, 90%, 84% and 35%. The high ECSA values for Sn–35Ag and Sn–97Ag electrodes also clarify their high performance in HERs.
The stability of Sn–35Ag electrode was studied as a function of the number of runs and as a function of the exposure time, Fig. 9(B). This electrode showed very high stability over the applied potential range during 200 runs. Only degradation less than 1% is observed after 500 runs. The electrocatalytic activity degraded after 500 cycles, as shown in the inset, the electrical connectivity was maintained even after 2000 runs. For N > 500 runs, the degradation rate was 0.02% per run. Also, the inset red curve of Fig. 9(B) showed the current density versus HER time up to 2000 s, which also confirms the high stability of Sn–35Ag electrode during HER.39
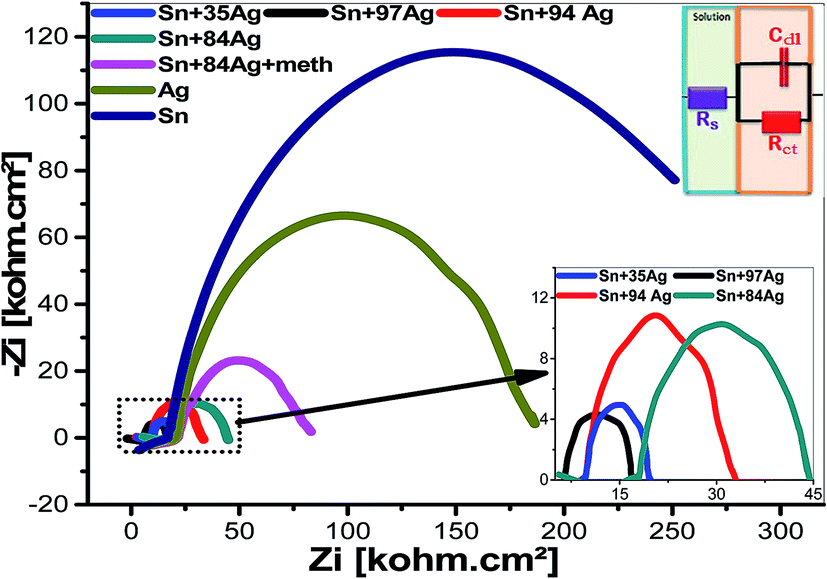
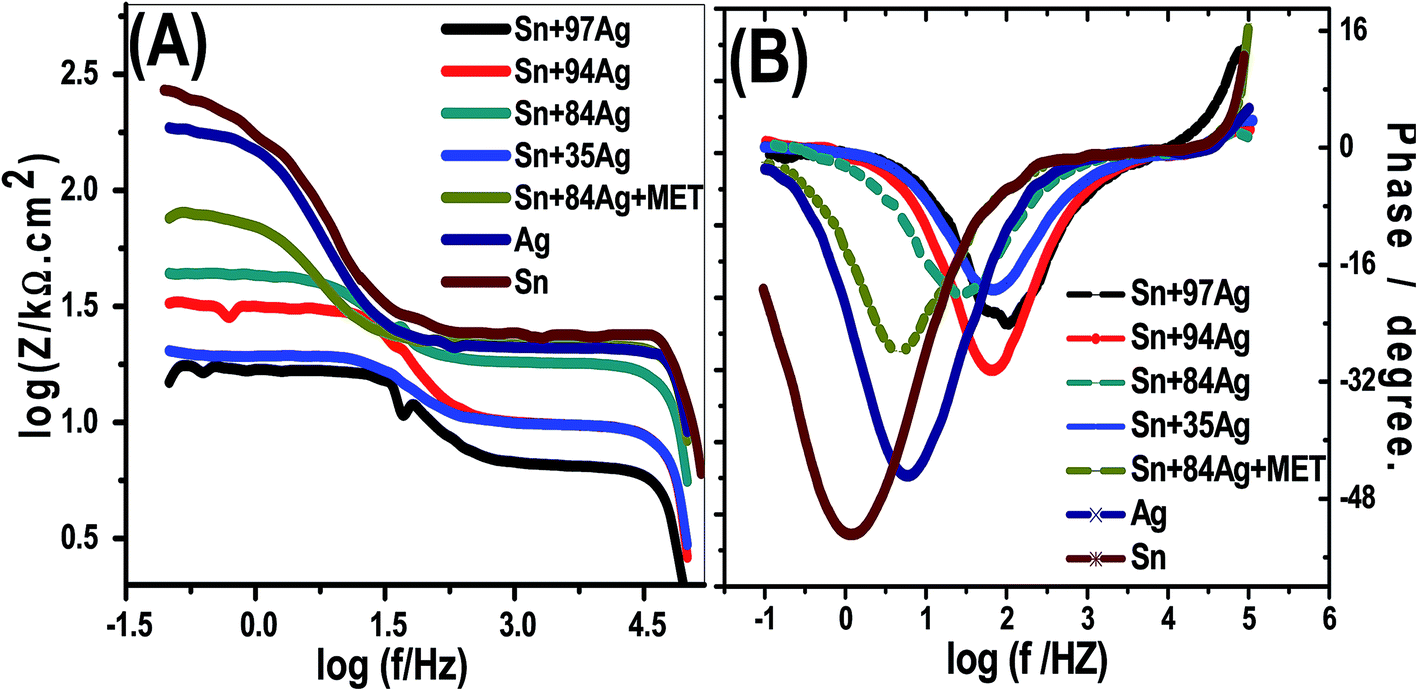
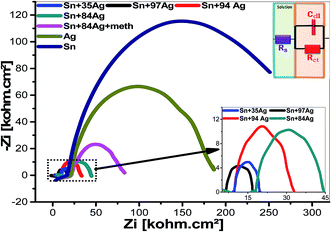
3.4.2. EC impedance spectroscopies (EISs). The measurements of the ECP are confirmed by EC impedance spectroscopies (EISs) measurements. The EISs are measured by combining galvanostat/potentiostat frequency analyzer with Voltalab 10 potentiostat (Radiometer PGZ100) and software Voltamaster 4. Fig. 10 and 11 present the EIS spectra (Nyquist plots and Bode plots) for the electroplated Sn, Ag, Sn–35Ag, Sn–84Ag, Sn–84Ag with methionine, Sn–94Ag, and Sn–97Ag alloys at hydrogen evolution potentials. Fig. 10 shows faintly depressed capacitive semicircle shapes with different radii for the investigated cathodic electrodes. The sample with small radius has the ability to produce a large amount of hydrogen evolution than the sample with large radius.39,40 So that, both Sn–35Ag and Sn–97Ag alloys have a large amount of HER than other samples.40 To understand the EISs measurements thru hydrogen evolution, the obtained results are fitted to a simple equivalent circuit (Randle cell) which consist of a series combination of Rs (the solution resistance), with a parallel combination of two-layers capacitance, Cdl, and the charge transfer resistance, Rct. The values of the equivalent circuit for each sample are recorded in Table 6.
 |
| | Fig. 10 Nyquist plots for the prepared alloys at the hydrogen evolution potential in 0.5 mol L−1 NaOH stagnant naturally aerated aqueous liquid at 25 °C. | |
 |
| | Fig. 11 Bode plots of the prepared alloys at the hydrogen evolution potential in 0.5 mol L−1 NaOH stagnant naturally aerated aqueous solution at 25 °C; (A) the variation of the total impedance with frequency and (B) the variation of phase with frequency. | |
Table 6 Values of the equivalent circuit from the fitting of the experimental impedance data that recorded for electrodeposited nanostructured Sn, Ag, Sn–Ag alloys and methionine/Sn–Ag alloy in 1 mol L−1 NaOH at 25 °C, based on the inset equivalent circuit in Fig. 9
| Alloys |
Rs/Ω cm2 |
Rct/Ω cm2 |
Cdl/mF cm−2 |
| Sn–97Ag |
6.52 |
10.30 |
244 |
| Sn–94Ag |
9.88 |
21.40 |
234.9 |
| Sn–84Ag |
17.96 |
25.84 |
389.1 |
| Sn–35Ag |
9.85 |
10.93 |
418.2 |
| Sn–84Ag + Met |
32.93 |
56.99 |
44.11 |
| Ag-deposited |
21.54 |
56.91 |
109.9 |
| Sn-deposited |
20.04 |
163.5 |
486.5 |
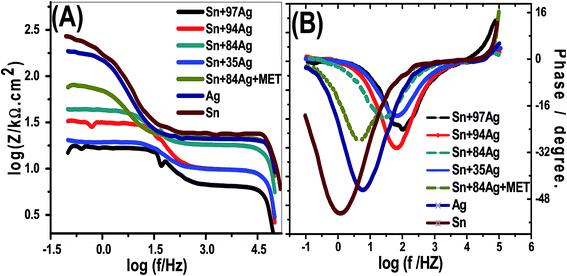
The charge transfer process (CTP) is mainly used to regulate the HERs which is guaranteed by the uni-loop of Nyquist plots. The charge transfer resistance show higher values for the electroplated Sn, Ag, Sn–84Ag + methionine, Sn–84Ag, and Sn–94Ag alloys than that obtained by the electroplated Sn–35Ag and Sn–97Ag alloys which supports the altered activities of the deposited electrodes during HERs. This could be ascribed to variation of morphologies and compositions of the electrodes. Furthermore, synergistic combination of Ag and Sn in addition to the porous structure of the surface improves HER kinetic. It can be seen that the electroplated Sn–35Ag and Sn–97Ag alloys are the most efficient electrocatalysts for HER. Fig. 11(A and B) shows Bode plots for the prepared alloys at the hydrogen evolution potential in 0.5 mo lL−1 NaOH aqueous liquid at 25 °C. Fig. 11(A) shows the variation of the total impedance with frequency and (B) the variation of phase with frequency. This figure shows resistive regimes at low and very high frequencies in addition to capacitive contribution in-between. The low-frequency regime is correlated to the charge transfer resistance (Rct) and the double-layered capacitance (Cdl) of the electrode. The very high-frequency regime may be related to the formation of a partially protective layer at the surface of the alloy cathode.41 The impedance of alloys with high Ag% is decreased with increasing Ag%. The variation of phase with frequency is shown in Fig. 11(B). The maximum phase shift (θmax) is shifted to high frequencies by increasing Ag% from 84% to 97%. The θmax of alloys is located at higher frequencies than that of individual Sn or Ag electrode. Finally, the addition of methionine to Sn–84Ag shifts its θmax to low frequency.
4. Conclusion
This work showed the efficacious deposition of Sn/Ag alloys from 1 ChCl:2 EG DESs utilizing a real-time in situ technique. The prepared alloys were characterized by different investigative techniques. The gap between the reduction peaks of tin and silver was reduced by 114 mV with the addition of 0.075 mol L−1 methionine, which facilitates the growth of Ag–Sn alloys over a short time and low applied potential (0.8 V). Also, the height of the cathodic current peak increases with the gradual increase of AgCl concentration from 0.005 to 0.1 mol L−1. The preferred growth orientation of the single Ag3Sn phase (orthorhombic packed structure) was varied from (202) to (112) depending on Ag%, which accompanied a noticeable decrease of the dislocation density. EDX spectra proved the high purity of the prepared electrodes. The concentration of silver ions in ILs is the main factor which affects the crystallites sizes and morphologies of the Ag/Sn alloys. The electrochemical properties of the prepared electrodes were studied toward HER by ECP and EIS measurements. The Sn–Ag alloys showed high catalytic activity for hydrogen production from 0.5 mol L−1 NaOH solution. The electroplated Sn–35Ag and Sn–97Ag alloys are the most efficient electrocatalysts for HER, which correlated strongly with the observed morphologies and EIS measurements. Finally, the measured impedance values were close-fitting to a hypothetical model for the electrode/electrolyte interface. The obtained data revealed that tin–silver alloys could be counted as good candidates for cathodic HERs with high throughput. Also, the simple growth of the designed Ag–Sn alloys and the strong demand for decorative finishes with enhanced corrosion resistance can extend their applications to many industrial areas.
Conflicts of interest
There are no conflicts to declare.
References
- A. P. Abbott, A. I. Alhaji, K. S. Ryder, M. Horne and T. Rodopoulos, Electrodeposition of copper-tin alloys using deep eutectic solvents, Trans. IMF, 2016, 94, 113 CrossRef.
- A. P. Abbott, G. Capper, K. J. McKenzie and K. S. Ryder, Electrodeposition of zinc–tin alloys from deep eutectic solvents based on choline chloride, J. Electroanal. Chem., 2007, 599, 288–294 CrossRef CAS.
- Electrodeposition from Ionic Liquids, ed. F. Endres, A. P. Abbott and D. R. MacFarlane, WILEY-VCH Verlag GmbH & Co. KGaA, Weinheim, 2008, pp. 1–77 Search PubMed.
- S. Werner, M. Haumann and P. Wasserscheid, Ionic liquids in chemical engineering, Annu. Rev. Chem. Biomol. Eng., 2010, 1, 203–230 CrossRef CAS.
- A. P. Abbott, G. Capper, D. L. Davies, R. Rasheed and V. Tambyrajah, Novel solvent properties of choline chloride/urea mixtures, Chem. Commun., 2003, 70–71 RSC.
- A. Gyozova, I. Krastev, L. Petkov and T. Dobrovolska, Electrodeposition and structure of binary alloys of silver, tin and antimony, Bulg. Chem. Commun., 2016, 48B, 103–109 Search PubMed.
- M. Negem and H. Nady, Electroplated Ni-Cu Nanocrystalline Alloys and their Electrocatalytic Activity for Hydrogen Generation using Alkaline Solutions, Int. J. Hydrogen Energy, 2017, 42, 28386–28396 CrossRef CAS.
- W. A. Badawy, H. Nady and M. Negem, Cathodic hydrogen evolution in acidic solutions using electrodeposited nano-crystalline NieCo cathodes, Int. J. Hydrogen Energy, 2014, 39, 10824–10832 CrossRef CAS.
- A. P. Abbott, S. Nandhra, S. Postlethwaite, E. L. Smith and K. S. Ryder, Electroless deposition of metallic silver from a choline chloride-based ionic liquid: a study using acoustic impedance spectroscopy, SEM and atomic force microscopy, Phys. Chem. Chem. Phys., 2007, 9, 3735–3743 RSC.
- N. Pewnim and S. Roy, Electrodeposition of tin-rich Cu–Sn alloys from a methanesulfonic acid Electrolyte, Electrochim. Acta, 2013, 90, 498–506 CrossRef CAS.
- X.-H. Xu and C. L. Hussey, The electrochemistry of tin in the aluminum chloride-1-methyl-3-ethylimidazolium chloride molten salt, J. Electrochem. Soc., 1993, 140(3), 618–626 CrossRef CAS.
- C. T. J. Low and F. C. Walsh, Electrodeposition of tin, copper and tin-copper alloys from a methanesulfonic acid electrolyte containing a perfluorinated cationic surfactant, Surf. Coat. Technol., 2008, 202(8), 1339 CrossRef CAS.
- N. M. Martyak and R. Seefeldt, Additive-effects during plating in acid tin methanesulfonate electrolytes, Electrochim. Acta, 2004, 49, 4303 CrossRef CAS.
- C. S. Cha and Y. B. Zu, Behavior of perfluorinated surfactants at the electrode/solution interface, Langmuir, 1998, 14(21), 6280 CrossRef CAS.
- S. Roy, M. Matlosz and D. Landolt, Effect of corrosion on the composition of pulse plated Cu–Ni alloys, J. Electrochem. Soc., 1994, 141, 1509 CrossRef CAS.
- S. Roy, Electrodeposition of compositionally modulated alloys by an electrodeposition–displacement reaction method, Surf. Coat. Technol., 1998, 105, 202 CrossRef CAS.
- S.-Z. Kure-Chu, T. Ogasawara, R.-B. Ye, H. Yashiro and K. Sasaki, Thermal Stability and Sulfidizing Resistance of High Reflective Multilayered Sn/Ag3Sn and Sn/Ag Films, Electrochim. Acta, 2016, 212, 380–389 CrossRef CAS.
- Y. Qin, G. D. Wilcox and C. Liu, Electrodeposition and Characterization of Eutectic Sn–Ag Alloy as Solder Bumps for Flip-Chip Interconnection, J. Electrochem. Soc., 2009, 156(10), D424–D430 CrossRef CAS.
- S. Arai, H. Akatsuka and N. Kaneko, Sn-Ag Solder Bump Formation for Flip-Chip Bonding by Electroplating, J. Electrochem. Soc., 2003, 150(10), C730–C734 CrossRef CAS.
- A. Christensen, A. Ruban, P. Stoltze, K. W. Jacobsen, H. L. Skriver, J. K. Nørskov and F. Besenbacher, Phase diagrams for surface alloys, Phys. Rev. B, 1997, 56(10), 5822–5834 CrossRef CAS.
- D. Yin, K. Kuczera and T. C. Squier, The sensitivity of carboxyl-terminal methionines in calmodulin isoforms to oxidation by H2O2 modulates the ability to activate the plasma membrane Ca-ATPase, Chem. Res. Toxicol., 2000, 13, 103–110 Search PubMed.
- D. J. Bigelow and T. C. Squier, Redox modulation of cellular signaling and metabolism through reversible oxidation of methionine sensors in calcium regulatory proteins, Biochim. Biophys. Acta, 2005, 1703(2), 121–134 CrossRef CAS.
- M. P. Ferla and W. M. Patrick, Bacterial methionine biosynthesis, Microbiology, 2014, 160, 1571–1584 CrossRef CAS PubMed.
- X. Li, W. Li, S. Yang and L. Hou, Using methionine as an environment-friendly corrosion inhibitor for copper–nickel alloy in a chloride solution, Mater. Express, 2017, 7(6), 480–490 CrossRef CAS.
- H. Nakano, S. Oue1, M. Uranaka and M. Masuda, Electrodeposition of Sn–Ag Alloys and Evaluation of Connection Reliability for Automotive Connectors, Mater. Trans., 2010, 51(4), 712–719 CrossRef CAS.
- M. Shaban, M. Zayed and H. Hamdy, Preparation and characterization of nanostructured ZnO thin films for self-cleaning applications, RSC Adv., 2017, 7, 617–631 RSC.
- M. Shaban, M. Mustafa and A. M El Sayed, Structural, optical, and photocatalytic properties of the spray deposited nanoporous CdS thin films; influence of copper doping, annealing, and deposition parameters, Mater. Sci. Semicond. Process., 2016, 56, 329–343 CrossRef CAS.
- M. Shaban, M. Ali, K. Abdelhady and H. Hamdy, Al2O3 and Sn/Al2O3 nanowires: Fabrication and Characterization, Micro Nano Lett., 2015, 10(7), 324–329 CrossRef CAS.
- A. Sharma, Y. J. Jang and J. P. Jung, Effect of current density on morphology of electroplated tin, Surf. Eng., 2015, 31(6), 458–464 Search PubMed.
- M. A. Oliver-Tolentino, E. M. Arce-Estrada, C. A. Cortes-Escobedo, A. M. Bolarin-Miro, F. S. D. Jesus and R. G. Gonzalez-Huerta, et al., Electrochemical behavior of NixW1_x materials as catalyst for hydrogen evolution reaction in alkaline media, J. Alloys Compd., 2012, 536, 245–249 CrossRef.
- S. Papadimitriou, A. Tegou, E. Pavlidou, S. Armyanov, E. Valova and G. Kokkinidis, et al., Preparation and characterization of platinum- and gold-coated copper, iron, cobalt and nickel deposits on glassy carbon substrates, Electrochim. Acta, 2008, 53, 6559–6567 CrossRef CAS.
- F. Rosalbino, D. Maccio, E. Angelini, A. Saccone and S. Delfino, Electrocatalytic properties of Fe-R (R ¼ rare earth metal) crystalline alloys as hydrogen electrodes in alkaline water electrolysis, J. Alloys Compd., 2005, 403, 275–282 CrossRef CAS.
- E. Navvaro-Flores, Z. Chong and S. Omanovic, Characterization of Ni, NiMo, NiW and NiFe electroactive coatings as electrocatalysts for hydrogen evolution in an acidic medium, J. Mol. Catal. A: Chem., 2005, 226(2), 179–197 CrossRef.
- M. Zayed, A. M. Ahmed and M. Shaban, Synthesis and characterization of nanoporous ZnO and Pt/ZnO thin films for dye degradation and water splitting applications, Int. J. Hydrogen Energy, 2019, 44(33), 17630–17648 CrossRef.
- W. A. Badawy, H. E. Feky, N. H. Helal and H. H. Mohammed, Cathodic hydrogen evolution on molybdenum in NaOH solutions, Int. J. Hydrogen Energy, 2013, 38, 9625–9632 CrossRef CAS.
- B. Neveu, F. Lallemand, G. Poupon and Z. Mekhalif, Electrodeposition of Pb-free Sn alloys in pulsed current, Appl. Surf. Sci., 2006, 252, 3561–3573 CrossRef CAS.
- M. A. Garcia-Contreras, S. M. Fernandez-Valverde and J. R. Vargas-Garcia, Pt, PtNi and PtCoNi film electrocatalysts prepared by chemical vapor deposition for the oxygen reduction reaction in 0.5M KOH, J. Alloys Compd., 2010, 504, 425–428 CrossRef.
- M.-H. Shao, J. H. Odell, S. Choi and Y. Xia, Electrochemical surface area measurements of platinum- and palladium-based nanoparticles, Electrochem. Commun., 2013, 31, 46–48 CrossRef CAS.
- M. Rabia, M. Shaban, A. Adel and A. A. Abdel-Khaliek, Effect of Plasmonic Au Nanoparticles on the Photoactivity of Polyaniline/Indium Tin Oxide Electrodes for Water Splitting, Environ. Prog. Sustainable Energy, 2019 DOI:10.1002/ep.13171.
- W. A. Badawy, H. Nady and G. M. Abd El-Hafez, Electrodeposited Zn-Ni alloys as promising catalysts for hydrogen production-preparation, characterization and electro-catalytic activity, J. Alloys Compd., 2017, 699C, 1146–1156 CrossRef.
- N. H. Helal, Corrosion inhibition and adsorption behavior of methionine on Mg- Al-Zn alloy, J. Chem. Eng. Mater. Sci., 2011, 2(2), 28–38 CAS.
|
| This journal is © The Royal Society of Chemistry 2019 |
Click here to see how this site uses Cookies. View our privacy policy here. 
 Open Access Article
 This Open Access Article is licensed under a Creative Commons Attribution-Non Commercial 3.0 Unported Licence
 *a,
Islam Kholidyab,
Ghada M. Ahmedc,
Mosaad Negem
*a,
Islam Kholidyab,
Ghada M. Ahmedc,
Mosaad Negem