 Open Access Article
Single-step synthesis of eucalyptus sawdust magnetic activated carbon and its adsorption behavior for methylene blue
Congjin Chen *ab,
Shuai Mib,
Dongmei Laob,
Panpan Shib,
Zhangfa Tong
 a,
Zhixia Lib and
Huayu Hub
aGuangxi Key Laboratory of Petrochemical Resource Processing and Process Intensification Technology, School of Chemistry and Chemical Engineering, Guangxi University, Nanning 530004, China. E-mail: gxdxccj@163.com; chencongjin@gxu.edu.cn
bSchool of Chemistry and Chemical Engineering, Guangxi University, Nanning 530004, China
First published on 17th July 2019
Abstract
Eucalyptus wood-based magnetic activated carbon (MAC) was prepared using single-step carbonization activation magnetization with FeCl3 and utilized for the adsorption of methylene blue (MB). The MAC was prepared using the following conditions: the mass ratio of FeCl3 to eucalyptus sawdust was controlled to 2![[thin space (1/6-em)]](https://www.rsc.org/images/entities/char_2009.gif) :
:![[thin space (1/6-em)]](https://www.rsc.org/images/entities/char_2009.gif) 1, the one-step carbonated activated magnetization temperature and time was 700 °C and 75 min. The prepared MAC was evaluated for textural characteristics such as the adsorption capacity, pore structure, surface chemical functional groups, magnetic properties, microcrystalline structure, and the surface morphology using the test methods described in the National Standard of China, these were N2-adsorption–desorption isotherms, Fourier transform infrared spectroscopy (FTIR), value stream mapping (VSM), X-ray diffraction (XRD) and scanning electron microscopy (SEM). Batch experiments were carried out to evaluate the adsorption behavior of MB on the prepared MAC at different temperatures of 298–328 K and MB initial concentration of 50.0–500.0 mg L−1. The results were as follows: the iodine number, methylene blue adsorption and phenol adsorption of the prepared MAC were 473.14, 228.22 and 70.90 mg g−1, respectively; MAC exhibited a microporous and mesoporous structure with a mesoporosity of 36%, the BET specific surface area, average pore diameter and pore volume were 645.23 m2 g−1, 2.71 nm and 0.44 cm3 g−1, respectively, and for the magnetic parameters the following results were found, a Hc of 108.51 Oe, Ms of 30.37 emu g−1 and Mr of 2.46 emu g−1; there were OH, C–O, C
1, the one-step carbonated activated magnetization temperature and time was 700 °C and 75 min. The prepared MAC was evaluated for textural characteristics such as the adsorption capacity, pore structure, surface chemical functional groups, magnetic properties, microcrystalline structure, and the surface morphology using the test methods described in the National Standard of China, these were N2-adsorption–desorption isotherms, Fourier transform infrared spectroscopy (FTIR), value stream mapping (VSM), X-ray diffraction (XRD) and scanning electron microscopy (SEM). Batch experiments were carried out to evaluate the adsorption behavior of MB on the prepared MAC at different temperatures of 298–328 K and MB initial concentration of 50.0–500.0 mg L−1. The results were as follows: the iodine number, methylene blue adsorption and phenol adsorption of the prepared MAC were 473.14, 228.22 and 70.90 mg g−1, respectively; MAC exhibited a microporous and mesoporous structure with a mesoporosity of 36%, the BET specific surface area, average pore diameter and pore volume were 645.23 m2 g−1, 2.71 nm and 0.44 cm3 g−1, respectively, and for the magnetic parameters the following results were found, a Hc of 108.51 Oe, Ms of 30.37 emu g−1 and Mr of 2.46 emu g−1; there were OH, C–O, C![[double bond, length as m-dash]](https://www.rsc.org/images/entities/char_e001.gif) O, C
O, C![[double bond, length as m-dash]](https://www.rsc.org/images/entities/char_e001.gif) C, COO, C–N, and Fe–O groups on the MAC surface, and Fe3O4 existed in the pores and surfaces of the MAC. The MB adsorption on the MAC followed the Langmuir isotherm and Dubinin–Radushkevich isotherm model, the adsorption process was a spontaneous, endothermic chemisorption progress, followed by the pseudo-second-order model, and the adsorption process was influenced by multiple diffusion steps, the pore diffusion process was the rate-controlling step, however, the adsorption process was also affected by the film diffusion and surface adsorption. The results reveal that MAC efficiently adsorbs MB and can be easily separated and recovered by an external magnetic field. The as-prepared MAC could be used as a potential adsorbent for organic pollutant wastewater treatment.
C, COO, C–N, and Fe–O groups on the MAC surface, and Fe3O4 existed in the pores and surfaces of the MAC. The MB adsorption on the MAC followed the Langmuir isotherm and Dubinin–Radushkevich isotherm model, the adsorption process was a spontaneous, endothermic chemisorption progress, followed by the pseudo-second-order model, and the adsorption process was influenced by multiple diffusion steps, the pore diffusion process was the rate-controlling step, however, the adsorption process was also affected by the film diffusion and surface adsorption. The results reveal that MAC efficiently adsorbs MB and can be easily separated and recovered by an external magnetic field. The as-prepared MAC could be used as a potential adsorbent for organic pollutant wastewater treatment.
1. Introduction
Porous carbon materials have widespread applications, such as being used as sorbents for wastewater treatment,1,2 catalysts or energy carriers3 and electrodes for energy storage.4 Owing to its characteristic well-developed porous construction and plentiful surface functional groups, activated carbon is one of the most commonly used adsorbents for the treatment and purification of waste water5 and waste gas6 produced by industrial manufacturers or daily activities. With the increasing shortage of water, it is important to protect water resources7 and control water pollution effectively. Printing and dyeing wastewater8 is one of the main sources of industrial water pollution and has a higher chrominance and organic content, which is complicated in terms of chemical composition9 and is difficult to deal with. There is a continuous demand to remove dye efficiently from aqueous solutions and reduce the concentration to below the discharge threshold limits.10 Compared with other methods of water pollution control, such as coagulation/flocculation, advanced oxidation processes, ozonation, membrane filtration and biological treatment,11 adsorption is considered to be a high efficient, green, low cost and easy to use procedure for the removal of dyes.12 Activated carbon, as one of the most commonly used adsorbents, could be used to adsorb the organic pigment13–20 during the treatment of wastewater, as it has rich pore structure and excellent specific surface area.At present, however, the main raw material for producing activated carbon is coal, a non-renewable resource, and powdered activated carbon is difficult to separate from the solution after wastewater treatment. Therefore, a growing number of researchers have taken an interest in synthesizing magnetic activated carbon (MAC)21–24 or using renewable resources to produce activated carbon. The renewable resources used are mainly industrial and agricultural waste, such as peanut shells,25,26 pine nut shells,27 banana pseudo-stems and so forth.28 Compared with conventional activated carbon, MAC is more applicable in wastewater treatment because it can be easily removed from the solution through magnetic separation technology after adsorbing the pollutants.29
Eucalyptus is a renewable resource and grows quickly. Eucalyptus wood sawdust (EWS) could replace coal to produce activated carbon, and if suitable magnetic materials are added, it can become MAC. This does not have the deficiency of being difficult to recycle compared with ordinary powdered activated carbon when applied in wastewater treatment. Although the adsorption behavior of methylene blue (MB) on eucalyptus wood-based activated carbon or magnetic activated carbon is rarely reported, eucalyptus wood-based activated carbon has been used to eliminate cadmium30 and chromium(VI)31 from aqueous solutions.
Herein, eucalyptus wood-based MAC was prepared by single-step carbonization activation magnetization with FeCl3. MB was selected as a model dye for the study and the adsorption behavior, adsorption isotherm, kinetics and adsorption mechanism of MB on MAC were comprehensively investigated.
2. Materials and methods
2.1 Materials
Eucalyptus grandis wood chips, were provided by Guangxi Gaofeng Farm, China. The wood chips were washed to remove dust and any other impurities, dried at 100 °C for 24 h, then smashed and sieved with 40 and 60 mesh screens, and sawdust with particles of 0.25–0.42 mm were selected as the precursor for production of activated carbon. Ferric trichloride hexahydrate (FeCl3·6H2O, used as an activator and magnetic agent), methylene blue (C16H18N3SCl), phenol (C6H5OH), hydrochloric acid (37% HCl), iodine (I2), potassium iodide (KI), sodium thiosulfate (Na2S2O3), potassium dichromate (K2Cr2O7), copper sulfate pentahydrate (CuSO4·5H2O), sodium phosphate dibasic (NaH2PO4), potassium dihydrogen phosphate (KH2PO4), and the other necessary reagents were purchased from the Shanghai Sinopharm Chemical Reagent Company Ltd. (Shanghai, China). All chemicals were of analytical grade and produced in China.2.2 Methods
![[thin space (1/6-em)]](https://www.rsc.org/images/entities/char_2009.gif) :
:![[thin space (1/6-em)]](https://www.rsc.org/images/entities/char_2009.gif) 1, 66.6 g of FeCl3·6H2O was dissolved in 50 mL of distilled water and FeCl3 aqueous solution was obtained) and kept at room temperature for 24 h. Then, the samples were dried, after that the commixture materials were placed into a porcelain crucible and heated for 75 min in a muffle furnace at 700 °C, the carbonized, activated materials were washed with HCl aqueous solution, hot and cold deionized water until the pH of the washing solution reached 6–7, filtered and finally dried at 110 °C for 24 h. After being smashed and screened through a 120 mesh sieve, the MAC was obtained, weighed, and stored in tightly closed bottles until further analysis.
1, 66.6 g of FeCl3·6H2O was dissolved in 50 mL of distilled water and FeCl3 aqueous solution was obtained) and kept at room temperature for 24 h. Then, the samples were dried, after that the commixture materials were placed into a porcelain crucible and heated for 75 min in a muffle furnace at 700 °C, the carbonized, activated materials were washed with HCl aqueous solution, hot and cold deionized water until the pH of the washing solution reached 6–7, filtered and finally dried at 110 °C for 24 h. After being smashed and screened through a 120 mesh sieve, the MAC was obtained, weighed, and stored in tightly closed bottles until further analysis.The yield of the MAC was calculated according to eqn (1).
| Y (%) = MAC/M0 × 100 | (1) |
The pore volume and specific surface area of the prepared MAC sample was determined according to the test methods for granular activated carbon from coal described in the National Standard of China GB/T 7002.20-2008. Prior to testing, the activated carbon was dried at 150 ± 5 °C for 2 h. The porous structural properties of the prepared MAC sample were studied using a N2 adsorption–desorption isotherm measured using a Micromeritics TriStar-3020 at 77 K. The specific surface area was analyzed using the Brunauer–Emmett–Teller (BET) equation at a relative pressure of P/P0 = 0.05–0.35. The micropore volumes (Vmicro) were calculated from the adsorption quantity corresponding to the starting point of the hysteresis ring on the N2 adsorption–desorption isotherm. The mesopore volumes (Vmeso) were calculated using the adsorption quantity corresponding to the terminal point of the hysteresis ring by subtracting the adsorption quantity corresponding to the starting point of the hysteresis ring on the N2 adsorption–desorption isotherm.35 The Barrett–Joyner–Halenda (BJH) method was used to obtain the total pore volume and the pore size distribution of the prepared MAC sample. The surface functional group of EWS and the prepared MAC sample was measured using Fourier transform infrared spectrometry (FTIR) (Nicolet 6700, America Nicolet Corporation), and data analysis employing OMNIC software. The crystalline structural information was analyzed using X-ray diffractometry (XRD, UItima IV), within a 2θ range of 5–80°. The magnetic properties of the prepared MAC were measured on a vibrating sample magnetometer (VSM) (Lake Shore 7410) at room temperature. The magnetic hysteresis curve was plotted and used to analyze the specific saturation magnetization (Ms), coercivity (Hc) and residual magnetism (Mr). The surface appearance and the pores of the prepared MAC sample were analyzed using a field emission scanning electron microscope (FESEM) (SUPRA 55 Sapphire) or a field emission transmission electron microscope (FETEM) (JEOL JEM 2100).
2.2.3.1 Adsorption isotherms. A batch experiment was conducted to evaluate the adsorption behavior of MB onto the prepared MAC. The adsorption experiments were carried out using 50.0 mL of MB solutions with different initial concentrations (50.0–500.0 mg L−1, concentration gradient of 50.0 mg L−1) with 50.0 mg of the activated carbon at various time intervals (from 0 min to 24 h) and temperatures (25, 35, 45, and 55 °C) in order to determine the adsorption equilibrium time and the maximum adsorption of MB.
In a typical run, 50.0 mL of methylene blue (MB) aqueous solution with an initial concentration of 250.0 mg L−1 was placed in a 250 mL Erlenmeyer flask. 0.0500 g of the prepared MAC, which was less than 75 μm in diameter, was added to the flask, then the flask was put into a digital water-bathing constant temperature vibrator and shaken at a speed of 100 rpm at 308 K for 24 h to reach equilibrium. Then, the MAC was separated from the liquid phase methylene blue aqueous solution using magnets and the mixtures were filtered, the filtrate concentration of each solution was determined from the absorbance of the filtrate measured using a UV/VIS spectrophotometer at MB maximum adsorption wavelengths of 665 nm. The MB mass concentration, Ct or Ce, of the filtrate could be calculated according to the relationship calibration curve between the MB mass concentration and absorbance. The amount qt (mg g−1) of MB adsorbed onto the MAC was determined by the difference between the initial and remaining concentration of the MB solution, calculated using eqn (2):
 | (2) |
Prior to all of above described processes, the relationship calibration curve between the MB mass concentration and the absorbance was established according to the Lambert–Beer law. The method of fitting the standard curve was as follows: firstly, the maximum absorption wavelength of the MB aqueous solution in the visible region was determined (665 nm); secondly, accurate concentrations of MB aqueous solution (0.1458, 0.2916, 0.729, 1.458 and 2.916 mg L−1 respectively) were prepared and the absorbance at a maximum wavelength of 665 nm was determined; finally, the relationship calibration standard curve between the absorbance and concentration of the MB aqueous solution was plotted.
When the adsorption process reached an equilibrium state, the distribution of the adsorbate MB molecules between the liquid phase MB aqueous solution and the solid phase of the prepared MAC was analyzed using the adsorption isotherm,36 and Langmuir,37 Freundlich,38 Temkin,39 and Dubinin–Radushkevich40 isotherm model equations were used to fit the experimental data for MB adsorption on the prepared MAC. These isotherm model equations can be expressed as eqn (3)–(10).
Langmuir isotherm:
 | (3) |
kL = k0![[thin space (1/6-em)]](https://www.rsc.org/images/entities/char_2009.gif) exp(−Ea/RT) exp(−Ea/RT)
| (4) |
| RL = 1/(1 + kLCe) | (5) |
Freundlich isotherm:
 | (6) |
Temkin isotherm:
 | (7) |
Dubinin–Radushkevich isotherm:
ln![[thin space (1/6-em)]](https://www.rsc.org/images/entities/char_2009.gif) qe = ln qe = ln![[thin space (1/6-em)]](https://www.rsc.org/images/entities/char_2009.gif) qs − kadε2 qs − kadε2
| (8) |
 | (9) |
 | (10) |
2.2.3.2 Adsorption thermodynamics. The thermodynamic behavior of MB adsorption onto MAC was evaluated using the thermodynamic parameters including the change in the Gibbs free energy (G), enthalpy (H), and entropy (S). The change in the Gibbs free energy (ΔG) can be used as a standard of judgment for whether an adsorption process is spontaneous, the change of enthalpy (ΔH) describes whether an adsorption process is an exothermic process and the change of the entropy (ΔS) indicates whether the molecular movements have become more unordered. These parameters are calculated from the following eqn (11)–(14):
 | (11) |
 | (12) |
ΔG = −RT![[thin space (1/6-em)]](https://www.rsc.org/images/entities/char_2009.gif) ln(Kd) ln(Kd)
| (13) |
| ΔG = ΔH − TΔS | (14) |
2.2.3.3 Adsorption kinetics. The kinetic experiments were carried out with 50 mL of MB solutions with initial concentrations of 150 or 250 mg L−1 with 50 mg of the MAC in 250 mL Erlenmeyer flasks. The flasks were put in a digital water-bathing constant temperature vibrator and shaken at a speed of 100 rpm at temperatures of 298, 308, 318 and 328 K for different periods of time, respectively. Then the MAC was separated from the liquid phase MB aqueous solution using magnets, the mixtures were filtered, the filtrate was analyzed to determine the MB dye concentration, and the amount qt (mg g−1) of MB adsorbed onto MAC was calculated according to eqn (2). The adsorption kinetics of the MB were investigated using the pseudo-first-order rate equation, the pseudo-second-order rate equation and the intraparticle diffusion model rate equation. The three sorption kinetic equations are expressing as follows in eqn (15)–(17):
Pseudo-first-order equation:
ln(qe − qt) = ln![[thin space (1/6-em)]](https://www.rsc.org/images/entities/char_2009.gif) qe − k1t qe − k1t
| (15) |
Pseudo-second-order equation:
 | (16) |
Intraparticle diffusion equation:
| qt = k3t1/2 + C | (17) |
2.2.3.4 Adsorption mechanism of MB on the prepared MAC. Fourier transform infrared spectrometry, transmission electron microscopy (TEM) and X-ray photoelectron spectroscopy (XPS) analysis of the prepared MAC before and after MB adsorption were used to determine the adsorption mechanism of MB on the prepared MAC.
3. Results and discussion
The iodine number, MB adsorption and phenol adsorption of the prepared eucalyptus wood-based MAC were determined using the test methods for wooden activated carbon described in the National Standard of China and were found to be 473.14, 228.22 and 70.90 mg g−1, respectively. The MB adsorption of the prepared MAC in this study was higher than that reported by Bedin et al.,42 211.3 mg g−1 of MB was adsorbed onto the spherical activated carbon, which was estimated using the Langmuir isotherm models. The adsorption capacity was higher than the adsorption of 143.53 mg g−1 of MB on mesoporous-activated carbon prepared from chitosan flakes as reported by F. Marrakchi, et al.5 However, the MB adsorption was lower than the mesoporous activated carbon from rattan furniture waste carbonized using hydrothermal carbonization and activated by NaOH with a maximum MB uptake of 359 mg g−1,43 the possible cause for this could be because the pores of the carbon were blocked by the magnetic material.3.1 Characterization of the prepared MAC
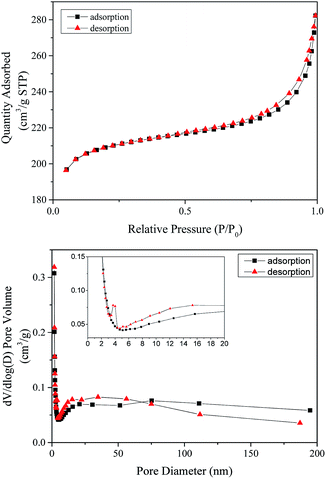 | ||
| Fig. 1 N2 adsorption–desorption isotherms at 77 K and the BJH pore size distribution of the prepared MAC. | ||
| SBET (m2 g−1) | Vtotal (cm3 g−1) | Vmicro (cm3 g−1) | Vmesopore (cm3 g−1) | Mesoporosity (%) | Wd (nm) |
|---|---|---|---|---|---|
| 645.23 | 0.44 | 0.28 | 0.16 | 36 | 2.71 |
The prepared MAC was a microporous and mesoporous carbon material. According to the IUPAC classification, the isotherms of the MAC were typical Type IV adsorption isotherms. The MAC derived from eucalyptus sawdust activated with FeCl3 had the characteristics of a mesoporous material, as obvious hysteresis loops can be seen in the adsorption–desorption isotherms, this was also proved by the mesoporosity of 36% and the average diameter of 2.71 nm, as shown in Table 1. This statement was also confirmed by the pore size distribution of MAC shown in Fig. 1 analyzed using the BJH theory.
The BET surface area of the prepared MAC calculated using the standard BET method was 645.23 m2 g−1. The total pore volume of the prepared MAC was 0.44 cm3 g−1. The size of the formed pores influences the porosity, the total surface area available for adsorption and most importantly, the size of the molecules that can diffuse into the solid.45 The average pore diameter of the prepared MAC was 2.71 nm, greater than the MB molecular diameter of 0.8 nm (MB molecule width of 1.43 nm, depth of 0.61 nm, thickness of 0.4 nm,46 and a molar volume of 241.9 cm3 mol−1 (ref. 46)), which is of benefit for the MB molecule to enter the pores of MAC and promotes contact between the adsorption sites of MAC and the MB molecules, improving the MB adsorption on the surface of the prepared MAC.
| Materials | Hc (Oe) | Ms (emu g−1) | Mr (emu g−1) | Mr/Ms |
|---|---|---|---|---|
| MAC | 108.51 | 30.37 | 2.46 | 0.081 |
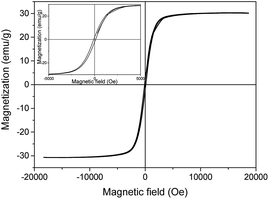
The results, magnetization hysteresis loops and the saturation magnetization of 30.37 emu g−1 indicated that the activated carbon was successfully coated with the magnetic material. Similar results were reported by Song et al.,47 who synthesized MAC via a modified coprecipitation reaction and the value of the saturation magnetization of the MAC was 33.207–37.535 emu g−1. The coercive force is one of the main properties that can be used to distinguish soft magnetic materials from hard magnetic materials. In generally, soft magnetic materials are materials that have a coercive force from 0.16 A m−1 (0.002 Oe) to 400 A m−1 (5 Oe), and hard magnetic materials have a coercive force from 10 kA m−1 (125 Oe) to 1 MA m−1 (12 kOe).48 The coercive force of the prepared MAC in this study was 108.51 Oe, meaning it is a hard magnetic material. Moreover, the results showed that the remnant magnetization (Mr) was small and the number was 2.46 emu g−1. All in all, the prepared activated carbon was magnetic, and could be separated using a magnetic separator. This meant that the prepared activated carbon could be recycled from waste water via a simple magnetic separator, meaning that the MAC could be separated and avoiding secondary pollution.
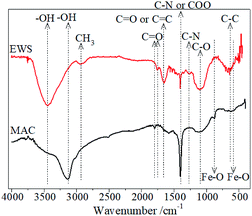
![[double bond, length as m-dash]](https://www.rsc.org/images/entities/char_e001.gif) O stretching vibration from the carbonyl and carboxyl groups.32 The peak at 1579 cm−1 was regarded as being from the C
O stretching vibration from the carbonyl and carboxyl groups.32 The peak at 1579 cm−1 was regarded as being from the C![[double bond, length as m-dash]](https://www.rsc.org/images/entities/char_e001.gif) C stretching vibration.49 The sharp peak that appeared at 1400 cm−1 may belong to the bending vibrations of the C–N group50 or the stretching vibration of the COO group in the carboxylic groups.51 The characteristic peak at 1122 cm−1 was attributed to the C–O stretching vibrations.52 The peaks at 622 and 588 cm−1 were ascribed to the Fe–O bending vibrations of Fe3O4 or γ-Fe2O3.53–56 The peak at 877 cm−1 was assigned to the Fe–O bending vibrations.55 The peak at 696 cm−1 could also be caused by the Fe–O bond vibration.57 Compared with the FTIR spectrum of the raw material of EWS, a peak for Fe–O appeared and the –CH3 peak disappeared in the FTIR spectrum of the prepared MAC. These characteristic adsorption peaks showed that some iron oxides were doped into the prepared carbon material.
C stretching vibration.49 The sharp peak that appeared at 1400 cm−1 may belong to the bending vibrations of the C–N group50 or the stretching vibration of the COO group in the carboxylic groups.51 The characteristic peak at 1122 cm−1 was attributed to the C–O stretching vibrations.52 The peaks at 622 and 588 cm−1 were ascribed to the Fe–O bending vibrations of Fe3O4 or γ-Fe2O3.53–56 The peak at 877 cm−1 was assigned to the Fe–O bending vibrations.55 The peak at 696 cm−1 could also be caused by the Fe–O bond vibration.57 Compared with the FTIR spectrum of the raw material of EWS, a peak for Fe–O appeared and the –CH3 peak disappeared in the FTIR spectrum of the prepared MAC. These characteristic adsorption peaks showed that some iron oxides were doped into the prepared carbon material.
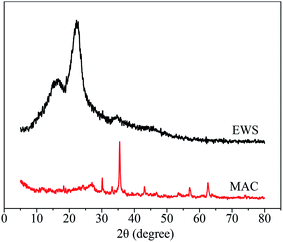
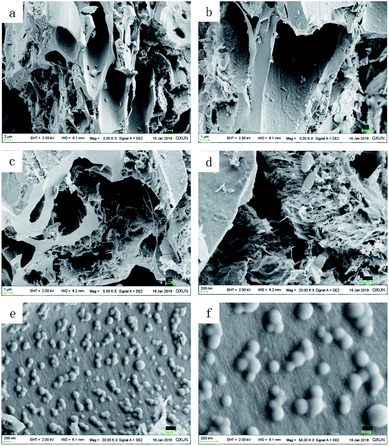
![[thin space (1/6-em)]](https://www.rsc.org/images/entities/char_2009.gif) 000 times). The magnetic materials were half embedded in the interior or surface of a hole, and are shown in Fig. 5b (magnified 5000 times), Fig. 5e (magnified 20
000 times). The magnetic materials were half embedded in the interior or surface of a hole, and are shown in Fig. 5b (magnified 5000 times), Fig. 5e (magnified 20![[thin space (1/6-em)]](https://www.rsc.org/images/entities/char_2009.gif) 000 times) and Fig. 5f (magnified 50
000 times) and Fig. 5f (magnified 50![[thin space (1/6-em)]](https://www.rsc.org/images/entities/char_2009.gif) 000 times). Some of the Fe3O4 present aggregated into large particles as shown in Fig. 5f.
000 times). Some of the Fe3O4 present aggregated into large particles as shown in Fig. 5f.
3.2 Adsorption behavior of MB on the prepared MAC
The adsorption isotherms described the distribution of adsorbate molecules between the liquid phase and the solid phase when the system reached an equilibrium; and the fitting of the isotherm data to different adsorption isotherm models was important in order to find a sustainable model that described the adsorption process.
The isotherm data of the MB adsorption on the prepared MAC were fitted to four adsorption isotherm models, namely the Langmuir, Freundlich, Temkin and Dubinin–Radushkevich isotherm models in their linear forms. Fig. 6 shows the fitted isotherm. The specific fitting isotherm parameters for the adsorption of MB on the prepared MAC are shown in Table 3. Table 3 shows that the experimental data preferentially fits the Langmuir isotherm, the fitted Langmuir isotherm model gave the best correlation coefficient (R) with R2 values of 0.9941, 0.9904, 0.9907 and 0.9912 at 298, 308, 318 and 328 K, respectively, compared with the Freundlich, Temkin and Dubinin–Radushkevich isotherm models, which demonstrates that the adsorption of MB on the prepared MAC is by monolayer adsorption. The Ea, calculated using the kL at different temperatures was 5.19 kJ mol−1 (more than zero) and indicated that the adsorption process of MB on the prepared MAC was by a chemical process. The RL values of 0.073–0.900 from the Langmuir isotherm indicate that the nature of adsorption of MB on the prepared MAC was favorable (0 < RL < 1). As for the Freundlich isotherm model, the Freundlich constant, n, depicted the adsorption intensity, the value of 1/n was generally between 0 and 1, and the magnitude of the 1/n value indicated the extent of the influence of the MB concentration on the adsorption capacity. The smaller the 1/n, the better the adsorption. When 1/n was in the range 0.1–0.5, it was easy to adsorb; when 1/n was more than 2, it was difficult to adsorb. The Freundlich constant, n, of 7.07–8.61, and 1/n of 0.1161–0.1414, indicated that the adsorption of MB on the prepared MAC was easy. For the equilibrium adsorption data of MB on the adsorbent in an aqueous solution, other researchers61 have drawn the same conclusion that the equilibrium adsorption data fitted the Langmuir isotherm better.
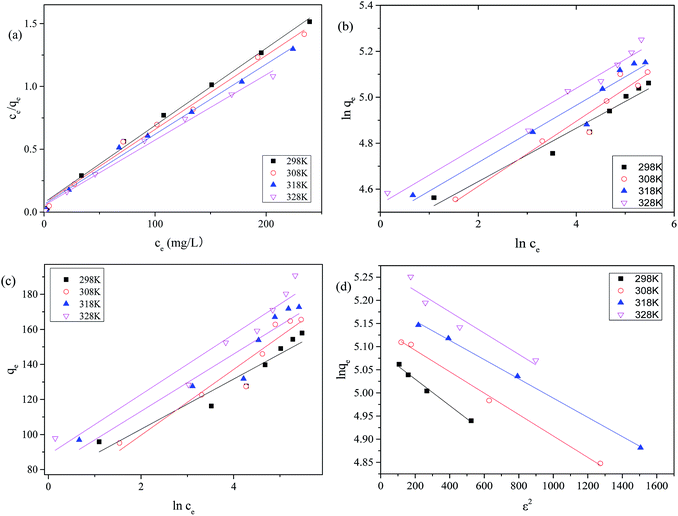 | ||
| Fig. 6 (a) Langmuir; (b) Freundlich; (c) Temkin isotherm; and (d) Dubinin–Radushkevich isotherm models of MB adsorption on MAC. | ||
| T (K) | Langmuir | Freundlich | ||||||
|---|---|---|---|---|---|---|---|---|
| qmax (mg g−1) | KL (L mg−1) | RL | Ea (kJ mol−1) | R2 | KF (mg g−1) (L mg−1)1/n | n | R2 | |
| 298 | 162.87 | 82.23 | 0.074–0.802 | 5.19 | 0.9941 | 81.52 | 8.61 | 0.9498 |
| 308 | 169.78 | 85.18 | 0.080–0.717 | 0.9904 | 75.90 | 7.07 | 0.9290 | |
| 318 | 179.21 | 91.46 | 0.076–0.849 | 0.9907 | 87.12 | 8.04 | 0.9297 | |
| 328 | 192.31 | 99.48 | 0.073–0.900 | 0.9912 | 90.28 | 7.94 | 0.9702 | |
| T (K) | Temkin | Dubinin–Radushkevich | |||||
|---|---|---|---|---|---|---|---|
| bT | AT | R2 | qs (mg g−1) | kad (mol2 kJ−2) | R2 | E (kJ mol−1) | |
| 298 | 172.99 | 179.85 | 0.9117 | 161.85 | 0.9852 | 41.87 | |
| 308 | 136.42 | 27.28 | 0.9031 | 170.44 | 2.31 × 10⁻⁴ | 0.9951 | 46.48 |
| 318 | 161.90 | 139.10 | 0.8872 | 180.67 | 2.08 × 10⁻⁴ | 0.9982 | 49.05 |
| 328 | 158.66 | 171.96 | 0.9283 | 193.87 | 2.30 × 10⁻⁴ | 0.8971 | 46.65 |
Fig. 6 gives the impression that among the Langmuir, Freundlich, Temkin and Dubinin–Radushkevich isotherm models, the Langmuir isotherm model is most suitable for describing the adsorption behavior of MB on the prepared MAC. The maximum MB adsorption capacity of 162.87–192.31 mg g−1 calculated from the fitted Langmuir was less than the reported value of 259.25 mg g−1,62 which was calculated from Sips isotherm fitting and reported by Theydan and Ahmed,62 they also compared the maximum MB adsorption capacity to those obtained in other studies concerning activated carbons prepared from various agricultural waste, and concluded that the prepared activated carbon can be classified as one of the most effective adsorbents for the removal of MB from wastewater. According to the report published by Theydan and Ahmed, the MB adsorption value on the eucalyptus wood-based magnetic activated carbon was within the range of effective adsorbents. The maximum MB adsorption value of 162.87–192.31 mg g−1 calculated from the Langmuir model was similar to the value of 195.55 reported by Mehrorang et al.,63 who synthesized γ-Fe2O3 and loaded it onto activated carbon for ultrasonic assisted adsorption of dyes. Therefore the prepared MAC could also be classified as an effective adsorbent and can effectively remove MB from wastewater. The Temkin isotherm model came from an assumption that the free energy of sorption was a function of the surface coverage owing to adsorbate/adsorbent interactions.64 The adsorption behavior of MB on the prepared MAC was not suitable for fitting to a Temkin isotherm model, as the value of R2 was too low (in the range of 0.8872–0.9283). The Dubinin–Radushkevich isotherm model is a common model, and the value of the free energy, which reveals adsorption mechanism information about the adsorption process, can be calculated according the slope of the line of the Dubinin–Radushkevich equation. The related line equations are shown as eqn (8)–(10). For the E value, the apparent free energies, values between 1 and 8 kJ mol−1 correspond to the physisorption and an E value of more than 8 kJ mol−1 corresponds to chemisorption.41 The E values for the Dubinin–Radushkevich isotherm model analysis of MB adsorption on the prepared MAC were 41.87, 46.48, 49.05 and 46.65 kJ mol−1 at 298, 308, 318 and 328 K, respectively. This indicates that the MB adsorption process on the prepared magnetic carbon was a chemisorption process, which was consistent with the analysis results of the Langmuir isotherm model.
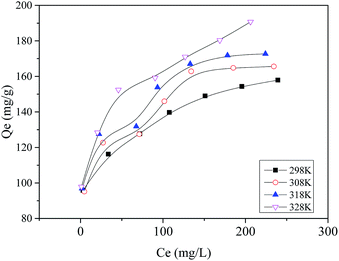
The relationship between the equilibrium absorption capacity (qe) and the equilibrium MB concentrations (ce) is shown in Fig. 7. Fig. 7 exhibited a changing trend, in that the equilibrium absorption capacity (qe) increased with the increasing equilibrium MB concentration (ce), which meant that the amount of absorption of MB on the prepared MAC increased with an increase in the initial MB concentration. The absorption speed at low ce was higher than that at high ce, a similar finding was reported by Yang et al.,65 who also explained that the absorption efficiency with a low initial MB concentration was higher than that observed from a high initial concentration.
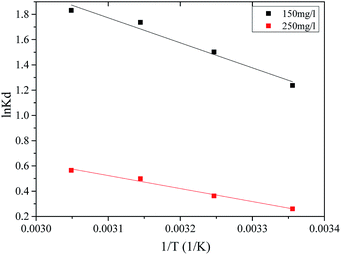
![[thin space (1/6-em)]](https://www.rsc.org/images/entities/char_2009.gif) Kd versus 1/T, as shown in Fig. 8. The specific thermodynamic parameters for the initial MB concentration of 150 and 250 mg L−1 adsorption on the prepared MAC are shown in Table 4. All of the negative values for the Gibbs free energy ΔG0 suggest that the adsorption of MB on the prepared MAC was spontaneous, and the enhancement of the ΔG0 negative values with an increase in the temperature suggested that the adsorption was more favorable at higher temperatures.41 The value of ΔH0 was positive, which implied the adsorption process was endothermic and chemical in nature. The positive value of ΔS0 indicated that randomness at the solid/liquid interface and the degree of freedom of the adsorbed species, MB, increased during the adsorption process. The negative values of ΔG, and the positive values of ΔH0 and ΔS0 were similar to most of the processes of adsorption involving activated carbon.41,67
Kd versus 1/T, as shown in Fig. 8. The specific thermodynamic parameters for the initial MB concentration of 150 and 250 mg L−1 adsorption on the prepared MAC are shown in Table 4. All of the negative values for the Gibbs free energy ΔG0 suggest that the adsorption of MB on the prepared MAC was spontaneous, and the enhancement of the ΔG0 negative values with an increase in the temperature suggested that the adsorption was more favorable at higher temperatures.41 The value of ΔH0 was positive, which implied the adsorption process was endothermic and chemical in nature. The positive value of ΔS0 indicated that randomness at the solid/liquid interface and the degree of freedom of the adsorbed species, MB, increased during the adsorption process. The negative values of ΔG, and the positive values of ΔH0 and ΔS0 were similar to most of the processes of adsorption involving activated carbon.41,67
| C0 (mg L−1) | ΔH0 (kJ mol−1) | ΔS0 (J (mol−1 K−1)) | ΔG0 (kJ mol−1) | Fitted equation | R2 | |||
|---|---|---|---|---|---|---|---|---|
| 298 K | 308 K | 318 K | 328 K | |||||
| 150 | 16.46 | 65.76 | −3.14 | −3.79 | −4.45 | −5.11 | ln![[thin space (1/6-em)]](https://www.rsc.org/images/entities/char_2009.gif) Kd = −1980.63/T + 7.91 Kd = −1980.63/T + 7.91 |
0.9589 |
| 250 | 8.56 | 30.84 | −0.63 | −0.94 | −1.25 | −1.56 | ln![[thin space (1/6-em)]](https://www.rsc.org/images/entities/char_2009.gif) Kd = −1029.15/T + 3.71 Kd = −1029.15/T + 3.71 |
0.9814 |
| C0 (mg L−1) | T (K) | qexp (mg g−1) | Pseudo-first-order | Pseudo-second-order | ||||
|---|---|---|---|---|---|---|---|---|
| k1 × 103 (min−1) | qe (mg g−1) | R2 | k2 × 10−4 (g mg−1 min) | qe (mg g−1) | R2 | |||
| 150 | 298 | 116.258 | 4.0 | 45.494 | 0.983 | 3.595 | 115.473 | 0.997 |
| 308 | 122.672 | 4.7 | 38.915 | 0.985 | 4.770 | 123.153 | 0.999 | |
| 318 | 127.532 | 2.7 | 25.508 | 0.824 | 9.844 | 123.457 | 0.999 | |
| 328 | 128.399 | 3.0 | 21.490 | 0.804 | 12.074 | 125.470 | 0.999 | |
| 250 | 298 | 139.758 | 3.4 | 44.221 | 0.878 | 4.592 | 136.612 | 0.999 |
| 308 | 143.731 | 5.0 | 54.455 | 0.956 | 3.434 | 147.058 | 0.999 | |
| 318 | 153.839 | 3.3 | 46.475 | 0.865 | 4.407 | 149.925 | 0.999 | |
| 328 | 159.205 | 2.7 | 46.849 | 0.804 | 4.854 | 151.745 | 0.999 | |
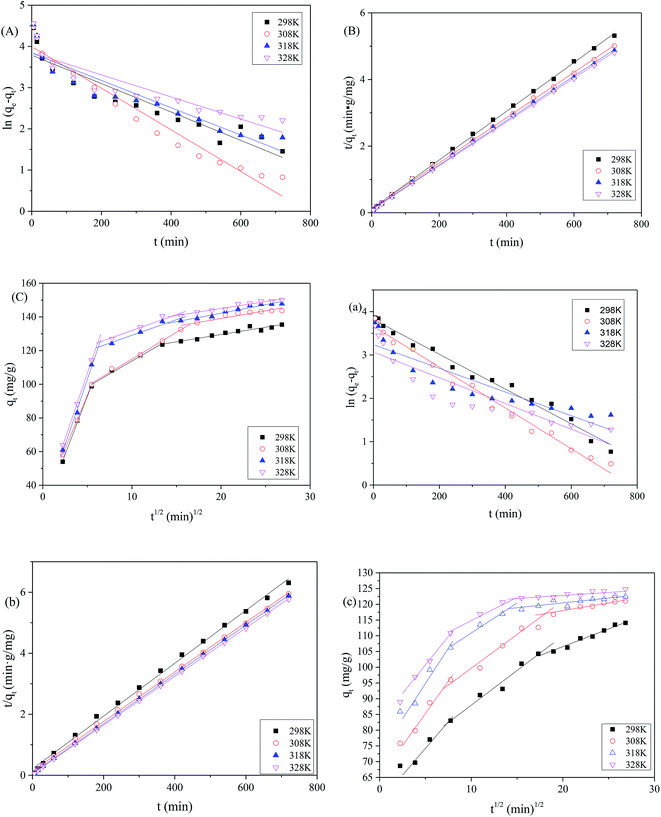
As shown in Table 5, the value of qe calculated using the pseudo-first-order kinetic equation was much smaller than the value of the equilibrium adsorption capacity (qexp) obtained from the experiment, while the value of qe calculated using the pseudo-second-order kinetic equation was similar to qexp. This means that the pseudo-first-order kinetic equation did not fit the absorption process of MB on the MAC well compared with the pseudo-second-order kinetic equation. Moreover, the correlation coefficient (R2) for the pseudo-second-order kinetic equation was almost 0.999, greater than that obtained for the pseudo-first-order kinetic equation, which also indicated that the pseudo-second-order kinetic equation better fitted the absorption process of MB on the MAC. In addition, the amounts of adsorption of MB at the initial concentration of 250 mg L−1 on the MAC fitted using the pseudo-second-order kinetic equation were 136.612, 147.058, 149.925 and 151.745 mg g−1, which were close to the measured values of 139.758, 143.731, 153.839 and 159.205 mg g−1, further proving this conclusion. The adsorption amounts obtained from the pseudo-second-order kinetic equation for MB at the initial concentration of 150 mg L−1 were also close to the measured values. Thus, the absorption of MB on the prepared MAC conformed to the pseudo-second-order kinetics model to describe the adsorption kinetics data for the entire sorption period. Furthermore, these results suggested that the pseudo-second-order adsorption mechanism was predominant. The pseudo-first-order kinetic equation was more suited to describing the kinetics of the initial stage, and the application process had some limitations, while the pseudo-second-order kinetic equation contained the complete adsorption processes, such as membrane diffusion, surface adsorption, internal diffusion, and so forth, and was more suitable for the adsorption process.
The intra-particle diffusion model can be useful for identifying the adsorption pathways and adsorption mechanisms and predicting the rate-controlling step. In a solid–liquid sorption process, adsorbate transfer is often characterized by film diffusion (also known as external diffusion), surface diffusion, and pore diffusion, or combined surface and pore diffusion. In short, if a plot of qt against t0.5 is linear and passes through the origin, the adsorption is entirely governed by intra-particle diffusion. In contrast, if the intra-particle diffusion plot gave multiple linear regions, then the adsorption process is controlled by a multistep mechanism.
In order to identify the adsorption mechanism of MB on the prepared MAC, the adsorption kinetics experimental data for MB adsorption on the prepared MAC were fitted to an intra-particle diffusion model, and it was determined whether the intra-particle diffusion was the rate-controlling step of the adsorption process. The processing results are shown in Fig. 9C and c and Table 6. It can be seen from Fig. 9C and c that the adsorption process of MB on the prepared MAC exhibited a multilevel linear relationship, and the adsorption capacity increased rapidly with time at the beginning, and then decreased gradually to the dynamic equilibrium. This suggested that the adsorption process was influenced by multiple diffusion steps. The diffusion adsorption process of MB on the prepared MAC can be described in three stages. The first stage is the rapid diffusion stage (kd1 is the largest among kd1, kd2 and kd3). The MB molecules are rapidly transported from the bulk liquid phase and accumulate at the external surface of the prepared MAC through a hydrodynamic boundary layer or film, known as “film diffusion” (also known as external diffusion) at a high adsorption rate. The second stage involves the surface diffusion of MB molecules from the exterior surface of the prepared MAC into the pores of the prepared MAC, along the pore-wall surfaces, or both, and is known as “intraparticle diffusion”, which is a slow diffusion process in particles (kd3 < kd2 < kd1). In the third stage, the adsorbate MB molecules are adsorbed onto the prepared MAC internal pore surface and sorption (chemisorption) occurs, during the reaction the mass transfer resistance increases owing to the decrease of the active sites of the MAC, and the boundary layer influence increases (C value increases) when the MB molecules continue to interact with the active sites of the MAC, and more and more of the active sites of the MAC are occupied, the diffusion rate decreases, and the MB molecules distribution between the prepared MAC and liquid phase MB aqueous liquid reaches equilibrium, and the adsorption amount does not increase gradually. It can be seen from Table 6 that the three stages of the adsorption curves of MB molecules on the prepared MAC showed a good linear relationship (R2 > 0.9), but did not pass through the origin, which indicates that the adsorption process of MB molecules on the MAC was controlled by a multistep mechanism, the pore diffusion process was the rate-controlling step of the adsorption process. However, the adsorption process was also affected by film diffusion and surface adsorption.
| C0 (mg L−1) | T (K) | qexp (mg g−1) | Stage I | Stage II | Stage III | ||||||
|---|---|---|---|---|---|---|---|---|---|---|---|
| kd1 | C1 | R12 | kd2 | C2 | R22 | kd3 | C3 | R32 | |||
| 150 | 298 | 116.258 | 3.392 | 57.244 | 0.950 | 2.205 | 65.902 | 0.962 | 1.125 | 84.0513 | 0.989 |
| 308 | 122.672 | 4.108 | 64.790 | 0.952 | 2.148 | 78.208 | 0.944 | 0.553 | 106.576 | 0.951 | |
| 318 | 127.532 | 4.482 | 72.420 | 0.907 | 1.906 | 91.812 | 0.966 | 0.329 | 113.848 | 0.967 | |
| 328 | 128.399 | 3.620 | 82.631 | 0.994 | 1.474 | 100.071 | 0.952 | 0.274 | 117.483 | 0.927 | |
| 250 | 298 | 139.758 | 13.835 | 23.665 | 0.996 | 3.066 | 83.171 | 0.983 | 0.869 | 112.181 | 0.935 |
| 308 | 143.731 | 12.755 | 29.725 | 0.999 | 3.177 | 83.230 | 0.994 | 0.920 | 120.693 | 0.900 | |
| 318 | 153.839 | 15.622 | 24.911 | 0.987 | 1.855 | 110.544 | 0.922 | 1.014 | 121.151 | 0.924 | |
| 328 | 159.205 | 15.566 | 28.712 | 0.998 | 1.889 | 113.044 | 0.908 | 0.836 | 128.272 | 0.944 | |
![[double bond, length as m-dash]](https://www.rsc.org/images/entities/char_e001.gif) O), and 1122 cm−1 (C–O). The FTIR spectrum (Fig. 10B) of the prepared MAC before and after MB adsorption showed that, after adsorption of MB, the peak at 3133 cm−1 remained unchanged but weakened, the peak at 3298 cm−1 intensified, which indicated that hydrogen bonding may not be an important process for MB adsorption onto MAC68. However, some functional groups in MB, such as the peaks at 3298 cm−1 for the aromatic ring C–H, 2899 cm−1 for the methyl C–H, 1735 and 1719 cm−1 for C–S, 1558 cm−1 for the benzene aromatic ring, 984 cm−1 for the C–H in-plane bending vibration, and 557 cm−1 for C–S–C were found in the FTIR spectrum (Fig. 10B) of MAC after MB adsorption. This suggested that MB was adsorbed onto the MAC surface or channel. Compared with the FTIR spectra of MAC, a new absorption peak at 1558 cm−1 can be clearly observed, and the peak at 1400 cm−1 is strengthened in the FTIR spectra of MAC after MB adsorption, which can be assigned to the vibration of the aromatic ring and the C–N bond for MB,68 which indicated that MB has been anchored on the surface of MAC during the adsorption. It should be noted that the peaks associated with the C–O and CH for MAC seem to be broadened and show a significant decrease in intensity after MB adsorption. This can be explained by the following considerations: (i) MB is a kind of cationic dye which can be adsorbed easily by electrostatic forces on negatively charged surfaces. (ii) MB is also an ideally planar molecule and therefore can be easily absorbed onto MAC by π–π stacking interactions between the aromatic backbone of MB and the hexagonal skeleton of MAC, which may lead to weakening of the intensity of
O), and 1122 cm−1 (C–O). The FTIR spectrum (Fig. 10B) of the prepared MAC before and after MB adsorption showed that, after adsorption of MB, the peak at 3133 cm−1 remained unchanged but weakened, the peak at 3298 cm−1 intensified, which indicated that hydrogen bonding may not be an important process for MB adsorption onto MAC68. However, some functional groups in MB, such as the peaks at 3298 cm−1 for the aromatic ring C–H, 2899 cm−1 for the methyl C–H, 1735 and 1719 cm−1 for C–S, 1558 cm−1 for the benzene aromatic ring, 984 cm−1 for the C–H in-plane bending vibration, and 557 cm−1 for C–S–C were found in the FTIR spectrum (Fig. 10B) of MAC after MB adsorption. This suggested that MB was adsorbed onto the MAC surface or channel. Compared with the FTIR spectra of MAC, a new absorption peak at 1558 cm−1 can be clearly observed, and the peak at 1400 cm−1 is strengthened in the FTIR spectra of MAC after MB adsorption, which can be assigned to the vibration of the aromatic ring and the C–N bond for MB,68 which indicated that MB has been anchored on the surface of MAC during the adsorption. It should be noted that the peaks associated with the C–O and CH for MAC seem to be broadened and show a significant decrease in intensity after MB adsorption. This can be explained by the following considerations: (i) MB is a kind of cationic dye which can be adsorbed easily by electrostatic forces on negatively charged surfaces. (ii) MB is also an ideally planar molecule and therefore can be easily absorbed onto MAC by π–π stacking interactions between the aromatic backbone of MB and the hexagonal skeleton of MAC, which may lead to weakening of the intensity of ![[double bond, length as m-dash]](https://www.rsc.org/images/entities/char_e001.gif) CH in MAC.68
CH in MAC.68
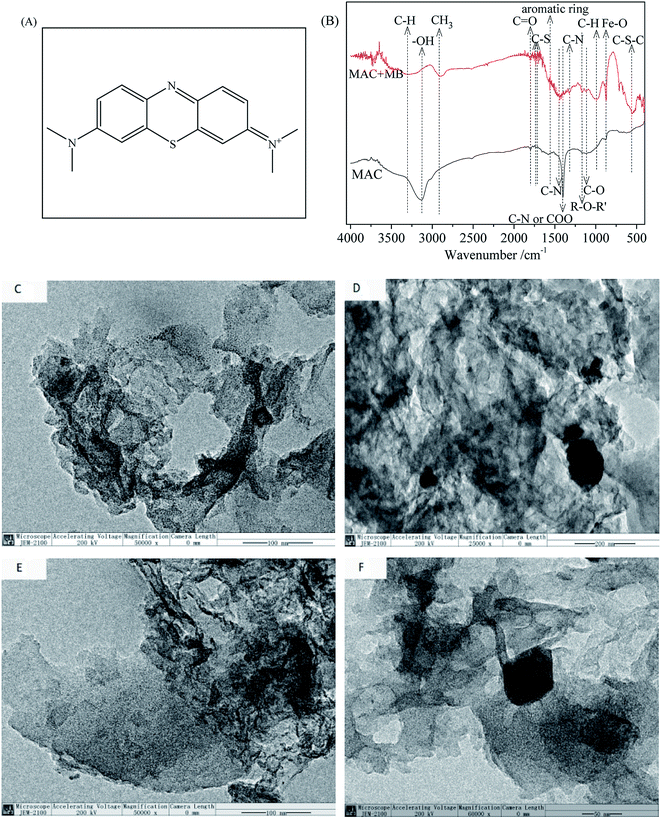 | ||
| Fig. 10 (A) Structure diagram of methylene blue, (B) FTIR spectrum, (C–F) TEM image of the prepared MAC before and after MB adsorption. | ||
Fig. 10C–F shows the TEM images of MAC after MB adsorption. Some pores are loaded and the surface of MAC shows some dispersion, which can be seen in Fig. 10C (magnification 50![[thin space (1/6-em)]](https://www.rsc.org/images/entities/char_2009.gif) 000×), which could be the absorption of MB on the surface of MAC and in its pores. Some pores and the layer-like porous structure of MAC were almost filled, which is shown in Fig. 10D (magnification 25
000×), which could be the absorption of MB on the surface of MAC and in its pores. Some pores and the layer-like porous structure of MAC were almost filled, which is shown in Fig. 10D (magnification 25![[thin space (1/6-em)]](https://www.rsc.org/images/entities/char_2009.gif) 000×) and Fig. 10E (magnification 50
000×) and Fig. 10E (magnification 50![[thin space (1/6-em)]](https://www.rsc.org/images/entities/char_2009.gif) 000×). The magnetic materials were half embedded in the interior or the surface of a hole, which is shown in Fig. 10D (magnification 25
000×). The magnetic materials were half embedded in the interior or the surface of a hole, which is shown in Fig. 10D (magnification 25![[thin space (1/6-em)]](https://www.rsc.org/images/entities/char_2009.gif) 000×) and Fig. 10F (magnification 60
000×) and Fig. 10F (magnification 60![[thin space (1/6-em)]](https://www.rsc.org/images/entities/char_2009.gif) 000×).
000×).
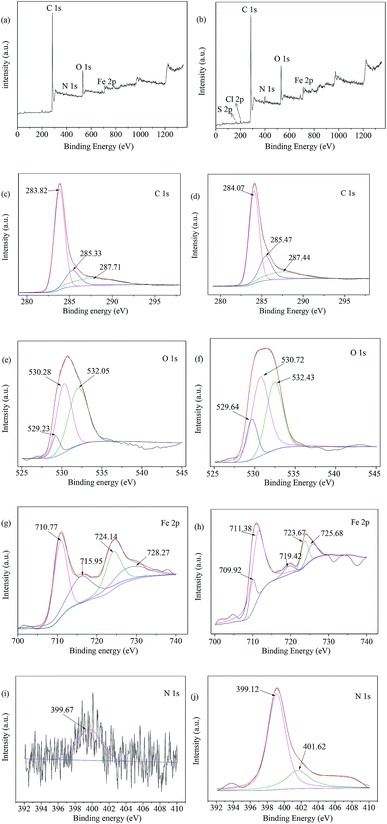
The XPS characterizations endow us with the ability to evaluate the roles that various organic functional groups and ferromagnetism played in the absorption of MB on the surface of MAC. The peaks in the XPS survey of MAC before and after MB adsorption at 283.85, 400.09, 530.74 and 710.77 eV as shown in Fig. 11a responded to C 1s, N 1s, O 1s and Fe 2p, and the peaks at 163.86, 199.94, 284.14, 399.16, 531.07 and 710.90 eV responded to S 2p, Cl 2p, C 1s, N 1s, O 1s and Fe 2p (shown in Fig. 11b). It can be seen that the peaks of S 2p (163.86 eV), Cl 2p1 (199.94 eV) occurred after MB adsorption, and that the N 1s (399.16 eV) intensity was higher after MB adsorption. The elements S 2p (163.86 eV), Cl 2p1 (199.94 eV) and N 1s (399.16 eV) existed in MB, indicating that MB was adsorbed onto the MAC. As for the C 1s peaks, it was found from Fig. 11c and d that there were some shifts in the corresponding peaks before and after MB adsorption, C![[double bond, length as m-dash]](https://www.rsc.org/images/entities/char_e001.gif) C (283.819 eV), C–C (285.332 eV), C
C (283.819 eV), C–C (285.332 eV), C![[double bond, length as m-dash]](https://www.rsc.org/images/entities/char_e001.gif) O (287.708 eV) shifted to C
O (287.708 eV) shifted to C![[double bond, length as m-dash]](https://www.rsc.org/images/entities/char_e001.gif) C or C–C (aromatic rings) (284.073 eV), C–OR (285.467 eV), C–Cl or C
C or C–C (aromatic rings) (284.073 eV), C–OR (285.467 eV), C–Cl or C![[double bond, length as m-dash]](https://www.rsc.org/images/entities/char_e001.gif) O (287.44 eV).69,70 As for the O 1s peaks, it was found from Fig. 11e and f that there was little change in the corresponding peak position before and after MB adsorption. For Fe 2p, as seen in Fig. 11g peaks at 710.77, 715.95, 724.14 and 728.27 eV were observed before MB adsorption, and changed to Fe2+ 2p3/2 (709.923 eV), Fe3+ 2p3/2 (711.375 eV),71 Fe2+ (719.420 eV), Fe2+ 2p3/2 (723.669 eV), and Fe3+ 2p3/2 (725.683 eV)72 after MB adsorption as seen in Fig. 11h. As for N 1s, NH2 (399.6728 eV),69 is exhibited in Fig. 11i before MB adsorption, as N–H or –CO–NH– (399.118 eV),73,74 and a new peak (401.615 eV) appeared, which was either N+ binding in methylene blue or CO–N (CH3) formed by N and COOH binding; in other words, –CO–NH3+ or N+ (401.615 eV)73,75 existed in Fig. 11j after MB adsorption, this meant that the MB was adsorbed onto MAC by an interaction between the N+ of MB and –COOH of MAC.
O (287.44 eV).69,70 As for the O 1s peaks, it was found from Fig. 11e and f that there was little change in the corresponding peak position before and after MB adsorption. For Fe 2p, as seen in Fig. 11g peaks at 710.77, 715.95, 724.14 and 728.27 eV were observed before MB adsorption, and changed to Fe2+ 2p3/2 (709.923 eV), Fe3+ 2p3/2 (711.375 eV),71 Fe2+ (719.420 eV), Fe2+ 2p3/2 (723.669 eV), and Fe3+ 2p3/2 (725.683 eV)72 after MB adsorption as seen in Fig. 11h. As for N 1s, NH2 (399.6728 eV),69 is exhibited in Fig. 11i before MB adsorption, as N–H or –CO–NH– (399.118 eV),73,74 and a new peak (401.615 eV) appeared, which was either N+ binding in methylene blue or CO–N (CH3) formed by N and COOH binding; in other words, –CO–NH3+ or N+ (401.615 eV)73,75 existed in Fig. 11j after MB adsorption, this meant that the MB was adsorbed onto MAC by an interaction between the N+ of MB and –COOH of MAC.
4. Conclusions
Eucalyptus wood-based MAC was prepared successfully by single-step carbonization activation magnetization with FeCl3 as follows: the mass ratio of FeCl3 to eucalyptus sawdust was 2![[thin space (1/6-em)]](https://www.rsc.org/images/entities/char_2009.gif) :
:![[thin space (1/6-em)]](https://www.rsc.org/images/entities/char_2009.gif) 1, 20.0 g of eucalyptus sawdust was mixed with 50 mL of FeCl3 aqueous solution and maintained for 24 h, before being dried overnight and undergoing a one-step carbonated activation for 75 min at 700 °C. The iodine number, MB adsorption and phenol adsorption of the prepared MAC were 473.14, 228.22 and 70.90 mg g−1, respectively. The BET surface, average pore diameter and pore volume were 645.23 m2 g−1, 2.71 nm and 0.44 cm3 g−1, respectively. The prepared MAC were magnetic, and could be separated by a magnetic separator with the following magnetic parameters, a Hc of 108.51 Oe, Ms of 30.37 emu g−1 and Mr of 2.46 emu g−1; there were OH, C–O, C
1, 20.0 g of eucalyptus sawdust was mixed with 50 mL of FeCl3 aqueous solution and maintained for 24 h, before being dried overnight and undergoing a one-step carbonated activation for 75 min at 700 °C. The iodine number, MB adsorption and phenol adsorption of the prepared MAC were 473.14, 228.22 and 70.90 mg g−1, respectively. The BET surface, average pore diameter and pore volume were 645.23 m2 g−1, 2.71 nm and 0.44 cm3 g−1, respectively. The prepared MAC were magnetic, and could be separated by a magnetic separator with the following magnetic parameters, a Hc of 108.51 Oe, Ms of 30.37 emu g−1 and Mr of 2.46 emu g−1; there were OH, C–O, C![[double bond, length as m-dash]](https://www.rsc.org/images/entities/char_e001.gif) O, C
O, C![[double bond, length as m-dash]](https://www.rsc.org/images/entities/char_e001.gif) C, COO, C–N, and Fe–O groups on the MAC surface, and Fe3O4 existed in the pores and surfaces of the MAC. The prepared MAC was utilized to adsorb MB in an aqueous solution, the adsorption followed the Langmuir isotherm and Dubinin–Radushkevich isotherm model. The adsorption process was a spontaneous, endothermic chemisorption process, followed by the pseudo-second-order model, and the adsorption process was influenced by multiple diffusion steps. The pore diffusion process was the rate-controlling step of the adsorption process, however, the adsorption process was also affected by film diffusion and surface adsorption. Eucalyptus wood-based MAC was found to be efficient for MB adsorption, and can be easily separated and recovered using an external magnetic field. MAC could be used as a potential adsorbent for the treatment of organic pollutant wastewater.
C, COO, C–N, and Fe–O groups on the MAC surface, and Fe3O4 existed in the pores and surfaces of the MAC. The prepared MAC was utilized to adsorb MB in an aqueous solution, the adsorption followed the Langmuir isotherm and Dubinin–Radushkevich isotherm model. The adsorption process was a spontaneous, endothermic chemisorption process, followed by the pseudo-second-order model, and the adsorption process was influenced by multiple diffusion steps. The pore diffusion process was the rate-controlling step of the adsorption process, however, the adsorption process was also affected by film diffusion and surface adsorption. Eucalyptus wood-based MAC was found to be efficient for MB adsorption, and can be easily separated and recovered using an external magnetic field. MAC could be used as a potential adsorbent for the treatment of organic pollutant wastewater.
Conflicts of interest
There are no conflicts to declare.Acknowledgements
The authors are grateful for financial support from the National Natural Science Foundation of China (31660183). This project was also supported by the Guangxi Natural Science Foundation (2015GXNSFAA139023), and the Dean Project of Guangxi Key Laboratory of Petrochemical Resource Processing and Process Intensification Technology (2018K010).References
- Suhas, V. K. Gupta, P. J. Carrott, R. Singh, M. Chaudhary and S. Kushwaha, Bioresour. Technol., 2016, 216, 1066–1076 CrossRef CAS.
- M. Yu, Y. Han, J. Li and L. Wang, Chem. Eng. J., 2017, 317, 493–502 CrossRef CAS.
- M. Sevilla and R. Mokaya, Energy Environ. Sci., 2014, 7, 125–128 RSC.
- Q. Ma, Y. Yu, M. Sindoro, A. G. Fane, R. Wang and H. Zhang, Adv. Mater., 2017, 29, 1605361 CrossRef.
- F. Marrakchi, M. J. Ahmed, W. A. Khanday, M. Asif and B. H. Hameed, Int. J. Biol. Macromol., 2017, 98, 233–239 CrossRef CAS.
- W. Hao, E. Björkman, M. Lilliestråle and N. Hedin, Appl. Energy, 2013, 112, 526–532 CrossRef CAS.
- X. Feng, B. Fu, S. Piao, S. Wang, P. Ciais, Z. Zeng, Y. Lü, Y. Zeng, Y. Li, X. Jiang and B. Wu, Nat. Clim. Change, 2016, 6, 1019–1022 CrossRef.
- M. Rafatullah, O. Sulaiman, R. Hashim and A. Ahmad, J. Hazard. Mater., 2010, 177, 70–80 CrossRef CAS.
- T. L. Silva, A. Ronix, O. Pezoti, L. S. Souza, P. K. T. Leandro, K. C. Bedin, K. K. Beltrame, A. L. Cazetta and V. C. Almeida, Chem. Eng. J., 2016, 303, 467–476 CrossRef CAS.
- M. G. K. D. F. Nasiri Azad and S. H. M. R. M. Montazerozohori., RSC Adv., 2016, 6, 19780–19791 RSC.
- J. Chang, J. Ma, Q. Ma, D. Zhang, N. Qiao, M. Hu and H. Ma, Appl. Clay Sci., 2016, 119, 132–140 CrossRef CAS.
- A. M. Aljeboree, A. N. Alshirifi and A. F. Alkaim, Arabian J. Chem., 2017, 10, S3381–S3393 CrossRef CAS.
- H. Cherifi, B. Fatiha and H. Salah, Appl. Surf. Sci., 2013, 282, 52–59 CrossRef CAS.
- Z. C. Kadirova, K. Katsumata, T. Isobe, N. Matsushita, A. Nakajima and K. Okada, Appl. Surf. Sci., 2013, 284, 72–79 CrossRef CAS.
- Y. Gokce and Z. Aktas, Appl. Surf. Sci., 2014, 313, 352–359 CrossRef CAS.
- E. Pargoletti, V. Pifferi, L. Falciola, G. Facchinetti, A. Re Depaolini, E. Davoli, M. Marelli and G. Cappelletti, Appl. Surf. Sci., 2019, 472, 118–126 CrossRef CAS.
- T. N. V. de Souza, S. M. L. de Carvalho, M. G. A. Vieira, M. G. C. Da Silva and D. D. S. B. Brasil, Appl. Surf. Sci., 2018, 448, 662–670 CrossRef.
- Q. Liu, T. Zheng, N. Li, P. Wang and G. Abulikemu, Appl. Surf. Sci., 2010, 256, 3309–3315 CrossRef CAS.
- D. Liu, W. Yuan, P. Yuan, W. Yu, D. Tan, H. Liu and H. He, Appl. Surf. Sci., 2013, 282, 838–843 CrossRef CAS.
- Z. Zhang, Z. Zhang, Y. Fernández, J. A. Menéndez, H. Niu, J. Peng, L. Zhang and S. Guo, Appl. Surf. Sci., 2010, 256, 2569–2576 CrossRef CAS.
- Z. Han, B. Sani, J. Akkanen, S. Abel, I. Nybom, H. K. Karapanagioti and D. Werner, J. Hazard. Mater., 2015, 286, 41–47 CrossRef CAS.
- R. S. Ribeiro, A. M. T. Silva, J. L. Figueiredo, J. L. Faria and H. T. Gomes, Appl. Catal., B, 2016, 187, 428–460 CrossRef CAS.
- H. Li, Y. Li, Y. Zhang, C. Liang, H. Wang, B. Li, D. Adair and Z. Bakenov, Nanoscale Res. Lett., 2016, 11, 432–440 CrossRef.
- N. M. Mubarak, A. Kundu, J. N. Sahu, E. C. Abdullah and N. S. Jayakumar, Biomass Bioenergy, 2014, 61, 265–275 CrossRef CAS.
- J. Georgin, G. L. Dotto, M. A. Mazutti and E. L. Foletto, J. Environ. Chem. Eng., 2016, 4, 266–275 CrossRef CAS.
- S. Zhang, L. Tao, Y. Zhang, Z. Wang, G. Gou, M. Jiang, C. Huang and Z. Zhou, Powder Technol., 2016, 295, 152–160 CrossRef CAS.
- D. Chen, X. Chen, J. Sun, Z. Zheng and K. Fu, Bioresour. Technol., 2016, 216, 629–636 CrossRef CAS.
- Z. A. Ghani, M. S. Yusoff, N. Q. Zaman, M. F. M. A. Zamri and J. Andas, Waste Manag., 2017, 62, 177–187 CrossRef.
- A. L. Cazetta, O. Pezoti, K. C. Bedin, T. L. Silva, A. Paesano Junior, T. Asefa and V. C. Almeida, ACS Sustainable Chem. Eng., 2016, 4, 1058–1068 CrossRef CAS.
- G. Venkatesan, U. Senthilnathan and S. Rajam, Clean Technol. Environ., 2014, 16, 195–200 CrossRef CAS.
- C. Chen, P. Zhao, Z. Li and Z. Tong, Desalin. Water Treat., 2016, 57, 12572–12584 CrossRef CAS.
- C. Chen, X. Li, Z. Tong, Y. Li and M. Li, Appl. Surf. Sci., 2014, 315, 203–211 CrossRef CAS.
- C. Liu, Y. Sun, D. Wang, Z. Sun, M. Chen, Z. Zhou and W. Chen, Ultrason. Sonochem., 2017, 34, 142–153 CrossRef CAS.
- Z. Sun, C. Liu, Z. Cao and W. Chen, Ultrason. Sonochem., 2018, 44, 86–96 CrossRef CAS.
- G. Z. Kyzas, E. A. Deliyanni and N. K. Lazaridis, J. Colloid Interface Sci., 2014, 430, 166–173 CrossRef CAS.
- X. Peng, D. Huang, T. Odoom-Wubah, D. Fu, J. Huang and Q. Qin, J. Colloid Interface Sci., 2014, 430, 272–282 CrossRef CAS.
- P. Wang, M. Cao, C. Wang, Y. Ao, J. Hou and J. Qian, Appl. Surf. Sci., 2014, 290, 116–124 CrossRef CAS.
- H. Deng, J. Lu, G. Li, G. Zhang and X. Wang, Chem. Eng. J., 2011, 172, 326–334 CrossRef CAS.
- Y. Zhou, X. Liu, L. Tang, F. Zhang, G. Zeng, X. Peng, L. Luo, Y. Deng, Y. Pang and J. Zhang, J. Hazard. Mater., 2017, 333, 80–87 CrossRef CAS.
- Y. L. Yu Liu, Sep. Purif. Technol., 2008, 61, 229–242 CrossRef.
- A. L. Cazetta, A. M. M. Vargas, E. M. Nogami, M. H. Kunita, M. R. Guilherme, A. C. Martins, T. L. Silva, J. C. G. Moraes and V. C. Almeida, Chem. Eng. J., 2011, 174, 117–125 CrossRef CAS.
- K. C. Bedin, I. P. A. F. Souza, A. L. Cazetta, L. Spessato, A. Ronix and V. C. Almeida, J. Mol. Liq., 2018, 269, 132–139 CrossRef CAS.
- M. A. Islam, M. J. Ahmed, W. A. Khanday, M. Asif and B. H. Hameed, Ecotoxicol. Environ. Saf., 2017, 138, 279–285 CrossRef CAS.
- A. Heidari, H. Younesi, A. Rashidi and A. Ghoreyshi, J. Taiwan Inst. Chem. Eng., 2014, 45, 579–588 CrossRef CAS.
- S. Guo, J. Peng, W. Li, K. Yang, L. Zhang, S. Zhang and H. Xia, Appl. Surf. Sci., 2009, 255, 8443–8449 CrossRef CAS.
- L. Mouni, L. Belkhiri, J. Bollinger, A. Bouzaza, A. Assadi, A. Tirri, F. Dahmoune, K. Madani and H. Remini, Appl. Clay Sci., 2018, 153, 38–45 CrossRef CAS.
- J. Song, X. Wang, J. Huang, J. Ma, X. Wang, H. Wang, R. Ma, P. Xia and J. Zhao, Electrochim. Acta, 2016, 222, 1–11 CrossRef CAS.
- D. C. Jiles, Acta Mater., 2003, 51, 5907–5939 CrossRef CAS.
- O. Duman, S. Tunç, B. K. Bozoğlan and T. G. Polat, J. Alloys Compd., 2016, 687, 370–383 CrossRef CAS.
- T. A. Saleh, Naeemullah, M. Tuzen and A. Sar, Chem. Eng. Res. Des., 2017, 117, 218–227 CrossRef CAS.
- J. Luo, J. Lu, Q. Niu, X. Chen, Z. Wang and J. Zhang, Fuel, 2015, 160, 440–445 CrossRef CAS.
- G. Zeng, Y. Liu, L. Tang, G. Yang, Y. Pang, Y. Zhang, Y. Zhou, Z. Li, M. Li, M. Lai, X. He and Y. He, Chem. Eng. J., 2015, 259, 153–160 CrossRef CAS.
- X. Luo, X. Lei, X. Xie, B. Yu, N. Cai and F. Yu, Carbohydr. Polym., 2016, 151, 640–648 CrossRef CAS.
- R. Fu, Y. Liu, Z. Lou, Z. Wang, S. A. Baig and X. Xu, J. Taiwan Inst. Chem. Eng., 2016, 62, 247–258 CrossRef CAS.
- A. A. A. Tawfik and A. Saleh, J. Mol. Liq., 2017, 248, 577–585 CrossRef.
- E. Kılınç, J. Magn. Magn. Mater., 2016, 401, 949–955 CrossRef.
- H. S. Saroyan, D. A. Giannakoudakis, C. S. Sarafidis, N. K. Lazaridis and E. A. Deliyanni, J. Chem. Technol. Biotechnol., 2017, 92, 1899–1911 CrossRef CAS.
- C. Chen, J. Luo, W. Qin and Z. Tong, Monatsh. Chem., 2014, 145, 175–185 CrossRef CAS.
- P. Wang, M. Cao, C. Wang, Y. Ao, J. Hou and J. Qian, Appl. Surf. Sci., 2014, 290, 116–124 CrossRef CAS.
- S. T. Danalıoğlu, Ş. S. Bayazit, Ö. Kerkez Kuyumcu and M. A. Salam, J. Mol. Liq., 2017, 240, 589–596 CrossRef.
- Y. Liu, Y. Kang, B. Mu and A. Wang, Chem. Eng. J., 2014, 237, 403–410 CrossRef CAS.
- S. K. Theydan and M. J. Ahmed, J. Anal. Appl. Pyrolysis, 2012, 97, 116–122 CrossRef CAS.
- A. Asfaram, G. A. Mehrorang, H. B. Shaaker and G. Alireza, Ultrason. Sonochem., 2016, 32, 418–431 CrossRef CAS.
- A. A. Mir, A. A. Amooey and S. Ghasemi, J. Cleaner Prod., 2018, 170, 570–580 CrossRef CAS.
- S. T. Yang, S. Chen, Y. Chang, A. Cao and Y. Liu, J. Colloid Interface Sci., 2011, 359, 24–29 CrossRef CAS.
- P. Reddy, P. Verma and C. Subrahmanyam, J. Taiwan Inst. Chem. Eng., 2016, 58, 500–508 CrossRef CAS.
- D. Angın, T. E. Köse and U. Selengil, Appl. Surf. Sci., 2013, 280, 705–710 CrossRef.
- L. Ai, C. Zhang, F. Liao, Y. Wang, M. Li, L. Meng and J. Jiang, J. Hazard. Mater., 2011, 198, 282–290 CrossRef CAS.
- W. Xie and M. Huang, Energy Convers. Manage., 2018, 159, 42–53 CrossRef CAS.
- M. Cao, P. Wang, Y. Ao, C. Wang, J. Hou and J. Qian, Chem. Eng. J., 2015, 264, 113–124 CrossRef CAS.
- S. Gao, L. Liu, Y. Tang, D. Jia, Z. Zhao and Y. Wang, J. Porous Mater., 2016, 23, 877–884 CrossRef CAS.
- K. V. M. K. Kireeti, G. Chandrakanth, M. M. Kadam and N. Jha, RSC Adv., 2016, 6, 84825–84836 RSC.
- M. Li, Y. Liu, S. Liu, G. Zeng, X. Hu, X. Tan, L. Jiang, N. Liu, J. Wen and X. Liu, J. Colloid Interface Sci., 2018, 521, 150–159 CrossRef CAS.
- A. Kumar, A. Kumar, G. Sharma, M. Naushad, F. J. Stadler, A. A. Ghfar, P. Dhiman and R. V. Saini, J. Cleaner Prod., 2017, 165, 431–451 CrossRef CAS.
- M. Mitra, M. Mahapatra, A. Dutta, J. S. D. Roy, M. Karmakar, M. Deb, H. Mondal, P. K. Chattopadhyay, A. Bandyopadhyay and N. R. Singha, J. Hazard. Mater., 2019, 369, 746–762 CrossRef CAS.
| This journal is © The Royal Society of Chemistry 2019 |

