 Open Access Article
A series of photosensitizers with incremental positive electric charges for photodynamic antitumor therapy†
Shufeng Yan ab,
Qingqing Huanga,
Xiaorong Songb,
Zhuo Chen
 b,
Mingdong Huang
 c and
Juncheng Zhang*a
aMedical Plant Exploitation and Utilization Engineering Research Center, Sanming University, Sanming, Fujian 365004, China. E-mail: 19900204@fjsmu.edu.cn
bState Key Laboratory of Structural Chemistry, Fujian Institute of Research on the Structure of Matter, Chinese Academy of Sciences, Fuzhou, Fujian 350002, China
cCollege of Chemistry, Fuzhou University, Fuzhou, Fujian 350116, China
First published on 8th August 2019
Abstract
In recent years, photodynamic therapy (PDT) studies have gained considerable attention as a non-invasive method used to fight cancer. In this study, a series of structurally similar photosensitizers (PSs) with incremental positive electric charges (ZnPc-4, 8 and 12) was investigated via in vitro and in vivo experiments. Photodynamic antitumor studies of these PSs, including phototoxicities, cellular uptake, the production of reactive oxygen species (ROSs) and the process of apoptosis, were conducted in the murine breast carcinoma cell line 4T1. The results indicated that the amount of positive electric charges in PSs is a key factor in influencing the efficacy of PDT. Furthermore, we established a hepatocellular carcinoma (H22) tumor-bearing mouse model to detect the antitumor activities of three PSs. ZnPc-4, 8 and 12 demonstrated significant antitumor effects and no obvious systemic damages in vivo (PDT effects: ZnPc-4 > ZnPc-8 > ZnPc-12), suggesting that the amount of positive electric charges was important to PSs, as well as the PDT effects. Our study not only indicates that ZnPc-4, 8 and 12 were highly potent anticancer PSs, but also suggests that adjusting the amount of positive electric charges is able to promote the PDT effects in cancer therapy.
1 Introduction
Considering the high morbidity and severe risk of cancer patients, more focus and research studies have to be directed toward issues of improving the therapeutic effect and quality of life for cancer patients.1–3 Photodynamic therapy (PDT) is a minimally invasive therapeutic procedure already approved for cancer therapy owing to its better selectivity and fewer side effects compared to those of radiotherapy and chemotherapy.4–7 The mechanism of PDT consists of three essential processes. First, the specific accumulation of photosensitizers (PSs) occurs in the tumor tissues after drug delivery. Then, the tumor regions are irradiated with light at a special wavelength matching the absorption spectrum of the PSs, leading to the generation of reactive oxygen species (ROSs). Finally, the ROSs can react directly with a biological substrate and create toxicity to the nearby biomacromolecules, causing the death of cancer cells.8–12 It is regrettable that although PDT has been approved in many countries for treating various types of diseases, its application still remains a serious challenge, especially the effects of PSs.13–15For antitumor PDT treatments, the structure and property of PSs play key roles in their efficacy. Numerous PSs have been reported to eliminate tumor cells each year, but still remain clinically underutilized for antitumor therapy.16–18 Most PSs are restricted by poor water solubility, inadequate penetration depth, as well as aggregation in aqueous solutions.19–21 Zinc phthalocyanine (ZnPc) is one type of PS with advantageous photophysical properties for PDT. In particular, many factors were demonstrated to influence the efficacy of ZnPc and PDT, such as electric charges.22–24 The PSs with different properties and amount of electric charges exhibit obvious effects on blood transmission, drug uptake and intracellular metabolism.25,26 It was reported that positively charged particles tend to enhance its water solubility, rate of drug uptake and anticancer effect while the neutral particles are more inclined to aggregate in water and the negatively charged particles show poor cellular uptake in most cases.27–30 Thereby, the positively charged particles have been widely used to improve the effects of antitumor therapy. However, the relationship between the amount of positive electric charges and PDT efficacy still remains unclear, which possibly limit the development of PSs and PDT.
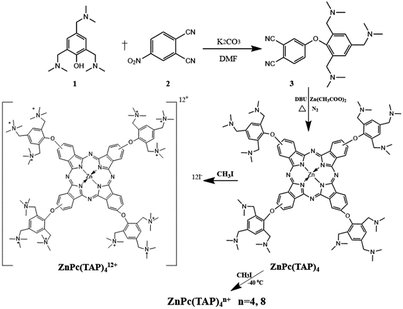
To address such a problem, in this study, we evaluate the PDT efficacies of ZnPcs with different amounts of positive electric charges by developing a series of cationic ZnPcs containing incremental positive electric charges: ZnPc(TAP)4n+ (n = 4, 8, 12, denotes the material ratio of CH3I and ZnPc(TAP)4, and is referred to as ZnPc-4, 8, 12). These PSs were synthesized according to our previously reported procedure.31 In particular, ZnPc(TAP)4, a precursor compound of ZnPc-4, 8 and 12 without any positive electric charge has been proven to be an efficient PS in cancer therapy, owing to its great phototoxicity with low dark toxicity.32 We further investigated these PSs in vitro and in vivo to demonstrate the relationship between the different amounts of positive electric charges and the PDT efficacy, including the phototoxicities, cellular uptakes, ROSs generations, apoptosis detections, and PDT efficacies in H22 tumor-bearing mice. The results demonstrated that the amount of positive electric charges in ZnPcs was a key factor that prominently affected the PDT effects in anticancer therapy.
2 Experimental section
2.1 Synthesis and materials
The series of ZnPc compounds with varying amounts of positive electric charges were synthesized according to our previously reported study.31 Chemicals were purchased either from Sigma-Aldrich (St Louis, MO, USA) or from Sinopharm Chemical Reagent Co. Ltd. (Shanghai, China). UV-vis and fluorescence spectra of ZnPc compounds were measured by a Synergy 4 multi-mode microplate reader. The planar LED light source fitted with a 96-well plate containing 24 lamps emitting red light was customized from Uniglory Electronics (HK) Co., Ltd. The animal light source (Luma Care Medical Group) was purchased from Newport Beach, CA, USA. The sub-cellular localizations were studied by an Olympus FluoView™ FV1000 laser scanning confocal microscope (Olympus Corp., Tokyo, Japan). Cell apoptosis was detected by Annexin V-FITC Apoptosis Detection Kits (MultiSciences Biotech Co. Ltd., China) and measured by a flow cytometer (BD Biosciences, USA).2.2 Cells and cell culture
The cell lines used in this study were murine breast carcinoma cell line 4T1 and mouse hepatocellular carcinoma cell line H22. 4T1 cells were maintained in Dulbecco's modified Eagle's medium (DMEM) supplemented with 10% fetal calf serum (FCS), 100 U mL−1 penicillin and 100 μg mL−1 streptomycin at 37 °C in a humidified incubator with 5% CO2 atmosphere. The mouse hepatocellular carcinoma cell line H22 was grown in culture before being frozen in liquid nitrogen. Both cell lines were purchased from the Shanghai Institute of Cell Biology, Chinese Academy of Sciences (Shanghai, China).2.3 Phototoxicities and dark toxicities of ZnPc-4, 8 and 12 in vitro
4T1 cells at a density of 5 × 10⁴ per mL culture medium in a volume of 200 μL per well were placed in 96-multiwell plates and incubated overnight. The cells were incubated with ZnPc-4, 8 and 12 at various concentrations (0.012, 0.037, 0.111, 0.333, 1, 3, 9, 27 μM) for 2 h, and then treated with the culture medium to wash out the unbound agents before a fresh medium was added. The plates were illuminated for 1 min (2.5 J cm−2, at 660 nm) by a planar LED light source and returned to the incubator. Dark toxicities of ZnPc-4, 8 and 12 were measured in parallel. After 24 h incubation, the survival rates of cells were measured on a BioTek microplate reader using the MTT colorimetric assay.2.4 Cellular uptakes of ZnPc-4, 8 and 12
Cellular uptakes of ZnPc-4, 8 and 12 were detected by fluorescence analysis. 200 μL of exponentially growing 4T1 cells (1.5 × 10⁵ per mL) were placed in 96-multiwell plates and divided into two groups. After 12 h incubation, cells of the first group were incubated with 1 μM ZnPc-4, 8 and 12 for various periods of time (2, 4, 8 and 16 h), respectively. The cells of another group were incubated for 8 h with ZnPc-4, 8 and 12 at various concentrations (0.11, 0.33, 1, 3 and 9 μM), respectively. In addition, the control column in the plate was filled with only culture medium as a blank. Then, all cells were dealt with sterile PBS buffer to remove unbound agents before being lysed with 0.1 mL lysis buffer (0.1 M NaOH, 1% SDS) to give a homogenous solution. A BioTek microplate reader was used to measure the fluorescence of cell lysates with λex = 610 nm and λem = 694 nm. The concentration of the cellular proteins was determined with the BCA Protein Assay Kit (BioTek Corporation, Beijing, People's Republic of China) and the results were expressed as nmol mg−1 cellular proteins.2.5 In vitro measurement of the ROSs
The ROS generations of ZnPc-4, 8 and 12 were measured with 2,7-dichlorofluorescein diacetate (DCFH-DA) as an intracellular probe for the ROSs. DCFH-DA is a stable, non-fluorescent molecule that readily crosses the cell membrane and is hydrolyzed by intracellular esterases to the non-fluorescent DCFH, which is rapidly oxidized in the presence of peroxides to the highly fluorescent dichlorofluorescein (DCF) upon oxidation by ROS. After a 2 h incubation by ZnPc-4, 8 and 12 (1 μM), 10 μM DCFH-DA was introduced and cultured with cells for 30 min in the dark. Then, the cells were washed with PBS and the fluorescence of the plates was detected as a base value without illumination. Thereafter, all cells were repeated with illumination for 30 seconds (1.25 J cm−2, 660 nm) by a planar LED light source and the fluorescence was measured until the signal began to flatten. Meanwhile, we further investigated the experiment in which the cells were treated by a similar light dose, but with different concentrations of ZnPcs (1, 3, 9 μM) for 2 h leading to ROS generation. The control group treated without PSs was measured in parallel. Finally, the intracellular accumulation of DCF fluorescence was observed by a BioTek microplate reader at an excitation wavelength of 488 nm and emission wavelength of 525 nm.2.6 Fluorescence imaging and apoptosis detection
For the fluorescence imaging assay, the 4T1 cells were incubated with ZnPc-4 and further irradiated by a LED light source (660 nm) to investigate the apoptosis of the PSs. The fluorescence imaging of cells before and after treating with ZnPc-4 was performed using a fluorescence microscope. In addition, we detected the cell apoptosis by Annexin V-FITC Apoptosis Detection Kits. 4T1 Cells were planted into a 6-well plate at a density of 5 × 10⁴ per mL culture medium in a volume of 2 mL per well and incubated overnight. Then, the cells were incubated with ZnPc-4, 8 and 12 (0.5, 1 μM) for 30 min, respectively. The plates were carefully washed thrice with PBS before a 30 s illumination (1.25 J cm−2, 660 nm). Following that, the 4T1 cells were detached with 0.25% trypsin without EDTA, washed thrice with ice-cold PBS and re-suspended in 500 μL binding buffer. Subsequently, the cells were incubated with 5 μL annexin V-FITC and 10 μL propidium iodide for 15 min under dark conditions and analyzed by flow cytometry. We carried out the apoptosis experiments in the 4T1 cell lines without PSs as the control.2.7 Establishment of Hepatoma-22 (H22) tumor-bearing Kunming mouse model
The Kunming mice (4 weeks old, 17–23 g) were purchased from Shanghai SLAC Laboratory Animal Co. Ltd., China. All experiments were performed following the guidelines of the Institutional Animal Care and Use Committee of Fujian Institute of Research on the Structure of Matter, Chinese Academy of Sciences and the committee also approved the experiments. To establish the H22 tumor-bearing mouse model, the mouse hepatocellular carcinoma cell line H22 was passaged weekly through mice in the form of ascites. Then, the ascites were harvested from the peritoneal cavity of a tumor-bearing mouse 6 days after inoculation. Subsequently, the cells were diluted with sterilized saline to adjust the concentration at a density of 1.0 × 10⁷ per mL, and 0.2 mL aliquots were subcutaneously inoculated into the right side of the back in the Kunming mice. The therapy experiments were begun when the tumor length (the longest diameter of the tumor) and width (diameter perpendicular to the length) reached 5–7 mm and 4–6 mm, respectively.2.8 PDT efficacies of ZnPc-4, 8 and 12 in the H22 tumor-bearing Kunming mice
The H22 tumor-bearing Kunming mice were randomly divided into four groups (8 mice per group) of mice with the equivalent average of initial tumor size (∼100 mm3) and body weight (∼23 g). The mice of three PS-treated groups were respectively injected with ZnPc-4, 8 and 12 (40 μM in saline) via the caudal vein at a dosage of 0.2 μmol kg−1, while the mice of the control group were injected with an equivalent volume of saline solution. 12 hours later, the tumors of the tumor-bearing mice were illuminated with a 680 nm light source (Luma Care Medical Group) for 5 min at a light dose of 50 J cm−2. The PDT efficacies were monitored by measuring the body weight and tumor sizes every day. The tumor sizes were estimated by the formula (W2 × L)/2, where W and L represent the tumor width and tumor length, respectively, and were recorded daily throughout the experiment. The PDT efficacies against the H22 tumor in mice were evaluated by a tumor growth-inhibition and tumor weight analysis.2.9 Statistical analysis
All data represent the group means and standard errors of the mean (SEM). The in vitro and in vivo experimental data were analyzed by the two-way analyses of variance (ANOVA). A probability value of P < 0.05 was considered statistically significant.3 Results and discussion
3.1 Optical and photophysical properties of ZnPc-4, 8 and 12
The series of water-soluble ZnPc compounds with various amounts of positive electric charges (ZnPc-4, 8 and 12) were synthesized according to our previously reported study (Scheme 1 and ESI†). Characterization of the compounds involved a combination of methods, including UV-vis and 1H NMR (Fig. S1 and S2†) spectroscopy.31 As shown in Fig. 1, the UV-vis absorption spectra of ZnPc-4, 8 and 12 exhibited absorption maxima at around 690 nm. Particularly, ZnPc-12 showed the maximum UV-vis absorption value in comparison with those of ZnPc-4 and 8 at the same concentrations (approximate 2–3-fold). The UV-vis absorption values of ZnPc-4, 8 and 12 have a significant positive correlation with their amounts of positive electric charges, showing that a more positive electric charge results in a higher UV-vis absorption value. Meanwhile, the fluorescence spectra of ZnPc-4, 8 and 12 were consistent with their UV-vis absorption, showing an overall order of fluorescence intensity as ZnPc-12 > ZnPc-8 > ZnPc-4. ZnPc-12 with the maximum positive electric charges has an observably enhanced UV-vis absorbance and fluorescence in comparison to ZnPc-4 and 8, suggesting that the amount of positive electric charges might influence the optical and photophysical properties of the PSs. In addition, the pKa values of three cationic photosensitizers were relatively similar, showing approximate values from 8.0 to 9.0 (Fig. S3†).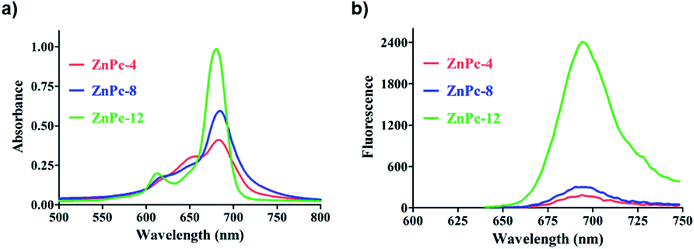 | ||
| Fig. 1 (a) UV-vis absorption spectra of ZnPc-4, 8 and 12. (b) Fluorescence emission spectra of ZnPc-4, 8 and 12 (ex: 610 nm). | ||
3.2 Phototoxicities and dark toxicities of ZnPc-4, 8 and 12 in vitro
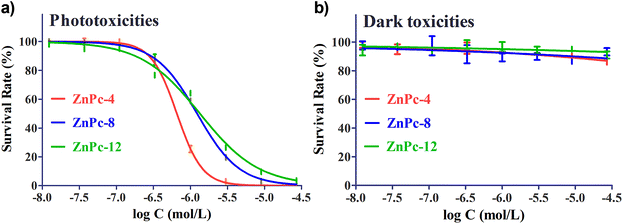
We evaluated the phototoxicities and dark toxicities of ZnPc-4, 8 and 12 in the murine breast carcinoma 4T1 cell line. The cells were incubated with ZnPc-4, 8 and 12 at various concentrations (0.012, 0.037, 0.111, 0.333, 1, 3, 9, 27 μM) for 2 h, respectively. After washing out the unbound agents and illuminating with a planar LED light source (660 nm) at a dose of 2.5 J cm−2, the phototoxicities and dark toxicities were measured using a MTT colorimetric assay. The results are shown in Fig. 2, and all three PSs exhibited photodynamic effects for 4T1 cells. The concentrations required to yield a 50% growth inhibition (IC50) of PSs were determined to be 0.66 μM for ZnPc-4, 1.23 μM for ZnPc-8 and 1.34 μM for ZnPc-12 in the 4T1 cells. ZnPc-4 was observed to have a stronger phototoxicity than ZnPc-8 and ZnPc-12 (approximately 2–3 folds). Significantly, the phototoxicities of ZnPc-4, 8 and 12 were inversely related to their amount of positive electric charges; the photodynamic effects decreased gradually with the increase in the positive electric charges. Such results are also supported by our previous work, which determined the IC50 of the non-charged precursor ZnPc(TAP)4 to be 0.20 μM.32 Meanwhile, nearly 100% 4T1 cells survived after treatment with ZnPc-4, 8 and 12 without illumination, demonstrating the low dark toxicities of PSs. These results further suggest that the amount of positive electric charges cannot influence the PSs in its dark toxicities.3.3 Cellular uptake of ZnPc-4, 8 and 12
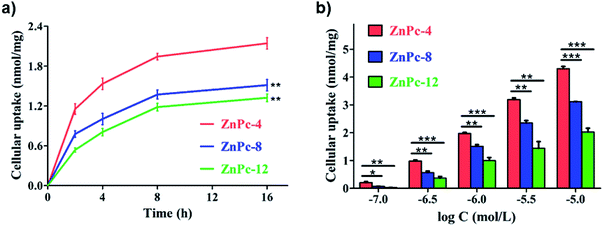
To better understand the drug uptakes and relationship between the amount of positive electric charges and phototoxicities of ZnPc-4, 8 and 12, the time- and concentration-gradient cellular uptakes were investigated by fluorescence analysis in the 4T1 cells. As shown in Fig. 3, ZnPc-4, 8 and 12 demonstrated both time- and concentration-dependent uptake in 4T1 cells. The time-gradient cellular uptake of the PSs showed that the 4T1 cells rapidly took up ZnPc-4, 8 and 12 and nearly reached plateaus after 8 h. The cellular uptake of ZnPc-4 was significantly higher than those of ZnPc-8 (1.5 fold) and ZnPc-12 (2.5 fold) in the 4T1 cells. Meanwhile, similar results were observed in the concentration-gradient cellular uptake of PSs, indicating that a higher concentration of the PSs led to greater cellular uptakes. The overall order of the cellular uptake of ZnPc-4, 8 and 12 was as follows: ZnPc-4 > ZnPc-8 > ZnPc-12, which was consistent with the results of phototoxicities of ZnPc-4, 8 and 12 in the 4T1 cells. These results suggest that the cellular uptake of the PSs is probably inversely proportional to the amount of positive electric charges of the PSs. It was previously reported that positively charged compounds always enhance their affinity to tumor cells owing to the attraction of opposite charges. However, the results indicated that the PS cellular uptake and phototoxicities associate with both the property of electric charges and the amount of positive electric charges of PSs.3.4 In vitro measurement of ROS
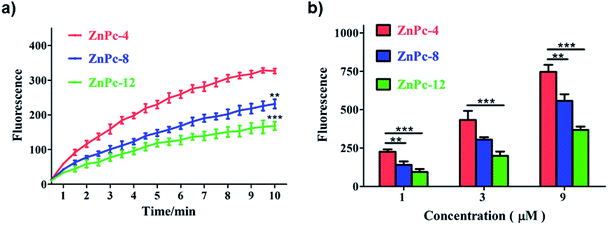
The production of ROSs can cause direct damage to cancer cells, resulting in cell death. Fluorescence analysis of ROS generation in 4T1 cells treated with ZnPc-4, 8 and 12 are shown in Fig. 4. All three PSs induced significant increases of ROS release compared to the control group (treated without PSs) in the 4T1 cells. With the light-dose and concentration increases, more ROSs were released. In addition, there is a significant difference in ZnPc-4, 8 and 12 on the ROS generations, indicating that the amount of positive electric charges in PSs were connected with their ROS generation and eventually affected the PDT efficacy. The ROS generation of ZnPc-4 was approximately 1.5-fold and 2-fold that of ZnPc-8 and 12, respectively. Such results were consistent with their cellular uptakes and phototoxicities, demonstrating the efficient phototoxicities of the PSs owing to their higher cellular uptakes and better ROS generations.3.5 Fluorescence imaging and apoptosis detection
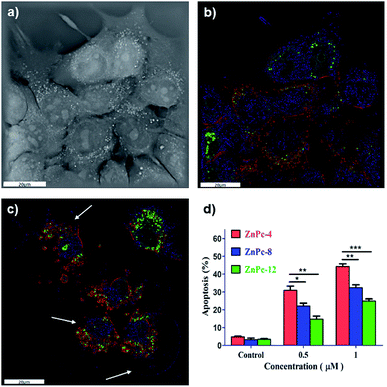
4T1 cells treated with ZnPc-4 were used to investigate fluorescence imaging and apoptosis. The fluorescence imaging of cells before and after PDT was performed using a fluorescence microscope. The Annexin V-FITC apoptosis detection kit was used to perform an apoptosis assay by flow cytometric analysis. As shown in Fig. 5a and b, the PS fluorescence (red color) was observed in the cytoplasm of the 4T1 cells, suggesting that the PS had a sub-cellular localization in cytoplasm. Significantly, the 4T1 cells (after treatment with PSs) and PDT treatments showed the state of apoptosis (Fig. 5c), especially broken cells and vacuolation, demonstrating the PDT effects of PS on the 4T1 cells. In addition, the results of the flow cytometric analysis are shown in Fig. 5d. The Annexin V/PI staining of the control cells (660 nm laser irradiation and without PSs incubation) showed a large viable cell population with less staining for the apoptotic cells. In contrast, the apoptosis of the 4T1 cells drastically increased after the treatment with ZnPc-4, 8 and 12. In particular, the percentage of apoptosis in the ZnPc-4 treated cells significantly increased from 4.8% (control) to 30.9% (0.5 μM) and 44.3% (1 μM), while the percentage of apoptosis in ZnPc-8 and 12 treated cells increased slowly (the overall order was as follows: ZnPc-4 > ZnPc-8 > ZnPc-12). The results were consistent with the cellular uptakes and ROS generations of PSs, indicating that the amount of positive electric charges of PSs was concerned with the cell death after the PDT treatments. The higher apoptosis of ZnPc-4, in comparison with those of ZnPc-8 and 12 in the tumor cells, plausibly occurred because of the fewer amounts of positive electric charges, leading to a better fat-soluble ability and more suitable conditions for tumors.3.6 Potent photodynamic efficacies of ZnPc-4, 8 and 12 in vivo
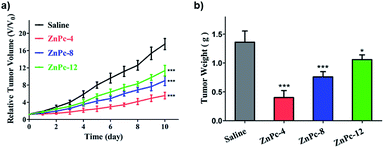
To evaluate the antitumor efficacies of the ZnPc-4, 8 and 12 in vivo, we established the H22 tumor-bearing Kunming mice model, which has a significant advantage that it does not require the use of immunocompromised mice. Immune reactions are consistently observed as an important component in the photodynamic effect in vivo.33–35 The ZnPc-4, 8 and 12 were injected in the mice on day 0 at a dosage of 0.2 μmol kg−1, while an equal volume of saline was utilized for the mice of the control group. 12 h later, all mice were irradiated by laser (680 nm) for 10 min at a light dose of 100 J cm−2. The tumor volumes were monitored daily and the tumor weight was monitored after 10 days. As shown in Fig. 6, we observed that all ZnPc-4, 8 and 12 treated groups displayed significant reduced tumor growth rates compared to the control group after 10 days. The relative tumor volume of the ZnPc-4 treated group (∼5.6), ZnPc-8 treated group (∼9.0) and ZnPc-12 treated group (∼11.3) were reduced by ∼3.1 fold, ∼1.9 fold and ∼1.5 fold, respectively, in comparison to the saline treated group (∼17.5) on the 10th day. Furthermore, the ZnPc-4 treated group exhibited greater inhibitory effects than the ZnPc-8 treated group (∼1.6 fold) and ZnPc-12 treated group (∼2.0 fold), confirming that they are effective PSs and the ZnPc-4 had the best phototoxicity in comparison to those of ZnPc-8 and 12 in vivo. The photodynamic anticancer effects were also reflected in their tumor weights after PDT treatments. The tumor weight of the ZnPc-4, 8 and 12 treated groups were markedly less than the saline treated group, which was similar to the tumor growth rates of the PSs. Meanwhile, there were no obvious body weight shifts of mice between various treatments (Fig. S4†), suggesting low toxicities of PSs after injection.4 Conclusions
In summary, to investigate the connection between the PDT effects and the amount of positive electric charges of photosensitizers, a series of structurally similar photosensitizers with incremental positive electric charges (ZnPc-4, 8 and 12) were prepared and investigated in vitro and in vivo. The ZnPc-4, 8 and 12 were all proven to be efficient photosensitizers as they showed remarkable cellular uptake and phototoxicities in tumor cells. In addition, ZnPc-4, 8 and 12 demonstrated significant antitumor effects and no obvious systemic damages in the H22 tumor-bearing mice model. Particularly, ZnPc-4 demonstrated significantly higher PDT effects than ZnPc-8, while ZnPc-8 was better than ZnPc-12, suggesting that the amount of positive electric charges was important to PSs as well as PDT effects. This study not only indicates that ZnPc-4, 8 and 12 were highly potent anticancer PSs, but also suggests that adjusting the amount of positive electric charges is able to promote the PDT treatments for cancer therapy.Conflicts of interest
The authors have declared that no competing interest exists.Acknowledgements
This work was financially supported by the National Natural Science Foundation of China (21804134), Start-up foundation for advanced talents in Sanming University (No. 18YG04), The Higher School of Applied Discipline Construction Project of Fujian Province, China (No. 44 document in 2017).References
- R. L. Siegel, K. D. Miller and A. Jemal, Cancer statistics, Ca-Cancer J. Clin., 2018, 68(1), 7–30 CrossRef PubMed.
- L. A. Torre, F. Bray, R. L. Siegel, J. Ferlay, J. Lortet-Tieulent and A. Jemal, Global cancer statistics, Ca-Cancer J. Clin., 2012, 65(2), 87–108 CrossRef PubMed.
- J. Ferlay, I. Soerjomataram, R. Dikshit, S. Eser, C. Mathers, M. Rebelo, D. M. Parkin, D. Forman and F. Bray, Cancer incidence and mortality worldwide: sources, methods and major patterns in GLOBOCAN 2012, Int. J. Cancer, 2015, 136(5), E359–E386 CrossRef CAS PubMed.
- U. Chilakamarthi and L. J. C. R. Giribabu, Photodynamic Therapy: Past, Present and Future, Chem. Rec., 2017, 17(8), 775–802 CrossRef CAS.
- D. V. Straten, V. Mashayekhi, H. S. D. Bruijn, S. Oliveira and D. J. J. C. Robinson, Oncologic Photodynamic Therapy: Basic Principles, Current Clinical Status and Future Directions, Cancers, 2017, 9(2), 19 CrossRef PubMed.
- P. Agostinis, K. Berg, K. A. Cengel, T. H. Foster, A. W. Girotti, S. O. Gollnick, S. M. Hahn, M. R. Hamblin, A. Juzeniene, D. Kessel, M. Korbelik, J. Moan, P. Mroz, D. Nowis, J. Piette, B. C. Wilson and J. Golab, Photodynamic therapy of cancer: an update, Ca-Cancer J. Clin., 2011, 61(4), 250–281 CrossRef PubMed.
- R. R. Allison and K. Moghissi, Oncologic photodynamic therapy: clinical strategies that modulate mechanisms of action, Photodiagn. Photodyn. Ther., 2013, 10(4), 331–341 CrossRef CAS PubMed.
- N. Mehraban and H. Freeman, Developments in PDT Sensitizers for Increased Selectivity and Singlet Oxygen Production, Materials, 2015, 8(7), 4421–4456 CrossRef CAS PubMed.
- J. Atchison, S. Kamila, C. McEwan, H. Nesbitt, J. Davis, C. Fowley, B. Callan, A. P. McHale and J. F. Callan, Modulation of ROS production in photodynamic therapy using a pH controlled photoinduced electron transfer (PET) based sensitiser, Chem. Commun., 2015, 51(94), 16832–16835 RSC.
- Y. M. Riyad, S. Naumov, S. Schastak, J. Griebel, A. Kahnt, T. Haupl, J. Neuhaus, B. Abel and R. Hermann, Chemical modification of a tetrapyrrole-type photosensitizer: tuning application and photochemical action beyond the singlet oxygen channel, J. Phys. Chem. B, 2014, 118(40), 11646–11658 CrossRef CAS PubMed.
- J. O. Yoo and K. S. Ha, New insights into the mechanisms for photodynamic therapy-induced cancer cell death, Int. Rev. Cell Mol. Biol., 2012, 295, 139–174 CAS.
- J. P. Celli, B. Q. Spring, I. Rizvi, C. L. Evans, K. S. Samkoe, S. Verma, B. W. Pogue and T. Hasan, Imaging and Photodynamic Therapy: Mechanisms, Monitoring, and Optimization, Chem. Rev., 2010, 110, 2795–2838 CrossRef CAS PubMed.
- K. Plaetzer, B. Krammer, J. Berlanda, F. Berr and T. Kiesslich, Photophysics and photochemistry of photodynamic therapy: fundamental aspects, Lasers Med. Sci., 2009, 24(2), 259–268 CrossRef CAS PubMed.
- R. R. Allison and C. H. Sibata, Oncologic photodynamic therapy photosensitizers: a clinical review, Photodiagn. Photodyn. Ther., 2010, 7(2), 61–75 CrossRef CAS PubMed.
- S. Yano, S. Hirohara, M. Obata, Y. Hagiya, S.-i. Ogura, A. Ikeda, H. Kataoka, M. Tanaka and T. Joh, Current states and future views in photodynamic therapy, J. Photochem. Photobiol., C, 2011, 12(1), 46–67 CrossRef CAS.
- Z. Iqbal, J. Chen, Z. Chen and M. Huang, Phthalocyanine-Biomolecule Conjugated Photosensitizers for Targeted Photodynamic Therapy and Imaging, Curr. Drug Metab., 2015, 16(9), 816–832 CrossRef CAS PubMed.
- P. Han, F. Luan, Y. Gao, J. Wang and H. Liu, Quantitative structure-wavelength relationship modeling of porphin: derivative photosensitizers, Comb. Chem. High Throughput Screening, 2011, 14(7), 601–615 CrossRef CAS PubMed.
- P. van Driel, M. C. Boonstra, M. D. Slooter, R. Heukers, M. A. Stammes, T. J. A. Snoeks, H. S. de Bruijn, P. J. van Diest, A. L. Vahrmeijer, P. M. P. van Bergen En Henegouwen, C. J. H. van de Velde, C. Lowik, D. J. Robinson and S. Oliveira, EGFR targeted nanobody-photosensitizer conjugates for photodynamic therapy in a pre-clinical model of head and neck cancer, J. Controlled Release, 2016, 229, 93–105 CrossRef CAS PubMed.
- Z. Fan, X. Dai, Y. Lu, E. Yu, N. Brahmbatt, N. Carter, C. Tchouwou, A. K. Singh, Y. Jones, H. Yu and P. C. Ray, Enhancing targeted tumor treatment by near IR light-activatable photodynamic-photothermal synergistic therapy, Mol. Pharmaceutics, 2014, 11(4), 1109–1116 CrossRef CAS PubMed.
- C. K. Lim, J. Heo, S. Shin, K. Jeong, Y. H. Seo, W. D. Jang, C. R. Park, S. Y. Park, S. Kim and I. C. Kwon, Nanophotosensitizers toward advanced photodynamic therapy of Cancer, Cancer Lett., 2013, 334(2), 176–187 CrossRef CAS PubMed.
- P. Sun, G. Wang, H. Hou, P. Yuan, W. Deng, C. Wang, X. Lu, Q. Fan and W. Huang, A water-soluble phosphorescent conjugated polymer brush for tumor-targeted photodynamic therapy, Polym. Chem., 2017, 8(38), 5836–5844 RSC.
- Z. Chen, P. Xu, J. Chen, H. Chen, P. Hu, X. Chen, L. Lin, Y. Huang, K. Zheng, S. Zhou, R. Li, S. Chen, J. Liu, J. Xue and M. Huang, Zinc phthalocyanine conjugated with the amino-terminal fragment of urokinase for tumor-targeting photodynamic therapy, Acta Biomater., 2014, 10(10), 4257–4268 CrossRef CAS PubMed.
- S. Song, Y. Guo, T. Peng, J. Zhang and R. Li, Effects of the symmetry and carboxyl anchoring group of zinc phthalocyanine derivatives on g-C3N4 for photosensitized H2 production, RSC Adv., 2016, 6(81), 77366–77374 RSC.
- T. M. Tsubone, W. K. Martins, C. Pavani and M. S. Baptista, Modulating the mechanism of photoinduced cell death by using photosensitizers with different charges, Photodiagn. Photodyn. Ther., 2015, 12(3), 334 CrossRef.
- A. Wang, L. Gui, S. Lu, L. Zhou, J. Zhou and S. Wei, Tumor microenvironment-responsive charge reversal zinc phthalocyanines based on amino acids for photodynamic therapy, Dyes Pigm., 2016, 126, 239–250 CrossRef CAS.
- R. Agarwal and K. Roy, Intracellular delivery of polymeric nanocarriers a matter of size, shape, charge, elasticity and surface composition, Ther. Delivery, 2013, 4(6), 705–723 CrossRef CAS PubMed.
- N. D. Hammer, S. Lee, B. J. Vesper, K. M. Elseth, B. M. Hoffman, A. G. M. Barrett and J. A. Radosevich, Charge dependence of cellular uptake and selective antitumor activity of porphyrazines, J. Med. Chem., 2005, 48, 8125–8133 CrossRef CAS PubMed.
- C. He, Y. Hu, L. Yin, C. Tang and C. Yin, Effects of particle size and surface charge on cellular uptake and biodistribution of polymeric nanoparticles, Biomaterials, 2010, 31(13), 3657–3666 CrossRef CAS PubMed.
- C. S. Lee, W. Park, Y. U. Jo and K. Na, A charge-switchable, four-armed polymeric photosensitizer for photodynamic cancer therapy, Chem. Commun., 2014, 50(33), 4354–4357 RSC.
- H. K. Moon, M. Son, J. E. Park, S. M. Yoon, S. H. Lee and H. C. Choi, Significant increase in the water dispersibility of zinc phthalocyanine nanowires and applications in cancer phototherapy, NPG Asia Mater., 2012, 4(4), e12 CrossRef.
- Y. Zhang, K. Zheng, Z. Chen, J. Chen, P. Hu, L. Cai, Z. Iqbal and M. J. A. M. Huang, Biotechnology, Rapid killing of bacteria by a new type of photosensitizer, Appl. Microbiol. Biotechnol., 2017, 101(11), 4691–4700 CrossRef CAS PubMed.
- S. Yan, J. Chen, L. Cai, P. Xu, Y. Zhang, S. Li, P. Hu, X. Chen, M. Huang and Z. Chen, Phthalocyanine-based photosensitizer with tumor-pH-responsive properties for cancer theranostics, J. Mater. Chem. B, 2018, 6(38), 6080–6088 RSC.
- B. W. Henderson, S. M. Waldow, T. S. Mang, W. R. Potter, P. B. Malone and T. J. Dougherty, Tumor destruction and kinetics of tumor cell death in two experimental mouse tumors following photodynamic therapy, Cancer Res., 1985, 45, 572–576 CAS.
- A. P. Castano, P. Mroz and M. R. Hamblin, Photodynamic therapy and anti-tumour immunity, Nat. Rev. Cancer, 2006, 6(7), 535–545 CrossRef CAS PubMed.
- P. Mroz, J. T. Hashmi, Y. Y. Huang, N. Lange and M. R. Hamblin, Stimulation of anti-tumor immunity by photodynamic therapy, Expert Rev. Clin. Immunol., 2011, 7(1), 75–91 CrossRef CAS PubMed.
Footnote |
| † Electronic supplementary information (ESI) available: Fig. S1–S4. See DOI: 10.1039/c9ra03486b |
| This journal is © The Royal Society of Chemistry 2019 |

