 Open Access Article
CoFe2O4 nanoparticles decorated MoS2-reduced graphene oxide nanocomposite for improved microwave absorption and shielding performance
Jagdees Prasada,
Ashwani Kumar Singh a,
Krishna Kamal Haldarb,
Monika Tomar
 b,
Vinay Guptab and
Kedar Singh
 *a
*a
aSchool of Physical Sciences, Jawaharlal Nehru University, New Delhi-110067, India. E-mail: kedar@mail.jnu.ac.in
bDepartments of Physics and Astrophysics, Delhi University, New Delhi-110007, India
First published on 15th July 2019
Abstract
Magnetic CoFe2O4 nanoparticles decorated onto the surface of a MoS2-reduced graphene oxide (MoS2-rGO/CoFe2O4) nanocomposite were synthesized by a simple two-step hydrothermal method. The electromagnetic (EM) wave absorption performance and electromagnetic interference (EMI) shielding effectiveness of the materials were examined in the frequency range of 8.0–12.0 GHz (X-band). The MoS2-rGO/CoFe2O4 nanocomposite was characterized by various tools such as X-ray diffraction, Raman spectroscopy, scanning electron microscopy, and transmission electron microscopy. High-resolution transmission electron microscopy results confirmed the decoration of magnetic nanoparticles onto the surface of the MoS2-rGO nanocomposite with a diameter of 8–12 nm. The multiple interfacial polarization, moderate impedance matching, and defect dipole polarization improve the dielectric and magnetic loss of the materials, which leads to strong attenuation loss ability of incident EM energy within the shield. The pure MoS2-rGO nanocomposite represents total shielding effectiveness (SET ∼16.52 dB), while the MoS2-rGO/CoFe2O4 nanocomposite exhibits total shielding effectiveness (SET ∼19.26 dB) over the entire frequency range. It may be explained that the magnetic nanoparticles (CoFe2O4) serve as excellent conductive and magnetic fillers with a large surface area, leading to the migration of charge carriers at multi-interfaces.
1. Introduction
In the modern era, the rapid development of telecommunication systems, industrial equipment, and a large number of electronic devices such as cellular phones, loudspeakers, iPads, televisions, radios, laptops, wireless wide area networks (WAN), etc. is a significant cause of electromagnetic interference (EMI) pollution in our daily life.1–5 These devices play an essential role in our daily life and make our life more comfortable; however, the electromagnetic (EM) radiation pollution that they emit within microwave range creates serious EM environmental pollution. EM pollution is increasing globally over time, and not only influences communication systems, electronic equipment, and military weapons, but also causes adverse effects on the health of humans.6–8 Therefore, in the past few years, considerable effort has been devoted to designing and fabricating ideal high-performance microwave absorption (MA) and EMI shielding materials, which significantly mitigate the increasing problem of serious EMI.7,9 An ideal EM wave absorbing and shielding material can be widely used in electronic device protection, environmental pollution cleaning, wireless telecommunication, and in human health care, for example. These materials exhibit many essential properties, such as a low density, light weight, thinness, high electrical conductivity, large surface area, wide absorption efficiency range, and good thermal and chemical stability.10–15 However, superior MA shielding materials should exhibit a good impedance matching condition, in which the relative permittivity (εr), and permeability (μr) of the material are of the same magnitude.16,17 According to the classical EM theory, the MA properties of materials are largely affected by dielectric and magnetic losses.18 All materials with high dielectric or magnetic loss properties only exhibit impedance mismatching, and maximum incident microwaves are strongly reflected instead of absorbed. The shielding properties of these materials primarily depend on reflection, not the absorption coefficient.19 Hence, excellent MA shielding materials can absorb unwanted EM energy by converting it into thermal energy or other types of energy.20Recently, some highly conductive carbon-based materials such as carbon black, carbon nanotubes, carbon fibers, and graphene, for example, have attracted considerable attention and interest in terms of EM absorption and shielding performance.21 Isolation of graphene, a single layer of graphite, provides a new platform that may be used as excellent building block materials. Graphene shows a high specific surface area with abundant functional groups and structural defects on its surface, leading to multi-interfacial polarization and defect dipole polarization. It has many interesting physical, chemical, and mechanical properties, and is widely used in energy storage devices, light-emitting devices, hydrogen evolution, and in energy conversion due to its high electrical conductivity, thinness, low mass density, light weight, high dielectric loss and easy binding ability with other materials.22–26 Further, reduced graphene oxide (rGO) exhibits excellent dielectric properties and higher electrical conductivity, but is not considered to have good attenuation loss ability of EM energy due to its impedance mismatching. rGO is a non-magnetic material that leads to relative complex permittivity, and permeability is entirely out of phase.19 Therefore, introducing CoFe2O4 nanoparticles onto the surface of an MoS2-rGO nanocomposite can improve magnetic permeability and magnetic loss in the GHz frequency range. Magnetic nanoparticles can moderate its impedance matching characteristics and strong attenuation loss ability of EM energy with shield materials, and create superb EM wave absorbing and EMI shielding materials.27
A layered semiconductor MoS2 with a hexagonal structure represents a new type of two-dimensional (2D) graphene-like structure consisting of a strong covalently bound S–Mo–S triple layer. Weak van der Waals forces act between vertically stacked MoS2 nanosheets.28 This material has recently attracted considerable attention due to its remarkable and desirable physical, chemical, and mechanical properties. MoS2 has potential applications in diverse areas such as supercapacitors electrodes, high-performance sensors, energy conversion, light-emitting devices, and in hydrogen evolution.29 MoS2 also exhibits excellent dielectric loss and possesses a thin and high specific surface area that could successfully increase the propagation path of EM waves inside the sample. It also exhibits many surface defects, including Mo and S vacancies, due to the violent exfoliation process, and works as dipoles under an EM field.23,30 MoS2 forms a multiple interface structure and dipole polarization charges on the surface of the nanosheet to enhance the interface polarization and defect dipole polarization for greater attenuation of EM waves.29 Conjugating MoS2 with rGO can effectively increase the electrical conductivity due to the close contact between MoS2 and rGO, and this stable junction is beneficial for charge carrier mobility. A MoS2-rGO nanocomposite could provide more interfaces and favorable polarization centers for a greater attenuation loss of incident EM energy inside the shield compared with single MoS2 or rGO nanosheet. Magnetic CoFe2O4 nanoparticles exhibit excellent properties such as good mechanical and chemical stability, high permeability, a moderate saturation magnetization, high coercivity, and mostly used commercial ferrites.31 Due to its high magnetic hysteresis loss, eddy current loss, magnetic resonance loss, and effective anisotropy energy, the material exhibits an excellent MA and shielding performance.
In this work, we synthesized an MoS2-rGO/CoFe2O4 nanocomposite by a simple two-step hydrothermal technique to improve its dielectric loss and magnetic loss. The phase structure, microstructure, dielectric and magnetic properties of the as-prepared MoS2-rGO/CoFe2O4 nanocomposite were characterized by X-ray diffraction (XRD), field-emission scanning electron microscopy (FESEM), high-resolution transmission electron microscopy (HRTEM), and Vector Network Analyzer, respectively. Decoration of CoFe2O4 nanoparticles onto the surface of the MoS2-rGO nanosheet significantly enhanced MA and shielding effectiveness due to moderate impedance matching of materials.
2. Experimental
2.1 Materials and reagents
Ammonium molybdate tetrahydrate, thiourea, ethanol, cobalt(III) acetylacetonate, iron(III) acetylacetonate, oleylamine, and pure graphite powder (99.99%) were purchased from Sigma Aldrich. HNO3, H2SO4, and KClO3 were procured from Fisher Scientific. All chemicals were reagent grade and were used as received without further purification. High purity deionized (DI) water was used in this work as a solvent and for purification.2.2 Preparation of CoFe2O4 nanoparticles
CoFe2O4 nanoparticles were prepared using a facile one-step solvothermal process. In a typical experiment, 0.9 mmol of iron(III) acetylacetonate and 0.45 mmol of cobalt(III) acetylacetonate were mixed and dissolved in 32 ml oleylamine under continuous magnetic stirring for 1 h at ambient temperature to yield a uniform mixture. The reddish uniform solutions were transferred into a 100 ml Teflon-lined stainless-steel autoclave, kept in an oven and maintained at 200 °C for 24 h. After complete reaction, the autoclave was allowed to cool naturally to room temperature, and the final product was collected by centrifuge at 5000 rpm for 10 min. Again, the product was washed several times with ethanol, and finally re-dispersed in 5 ml ethanol for further experimentation.2.3 Preparation of MoS2-rGO/CoFe2O4 nanocomposite
Graphite oxide sheets (GOS) were successfully synthesized from natural bulk graphite powder by a slightly modified Staudenmaier's method.32 The MoS2-rGO/CoFe2O4 nanocomposite was synthesized as follows: first, GOS (4 mg ml−1) were dissolved into 35 ml of DI water by sonication over 1.5 h to form a mixture. Second, 1 mmol of ammonium molybdate tetrahydrate, 30 mmol of thiourea, and a 5 ml solution of CoFe2O4 nanoparticles in ethanol were dissolved in the above mixture under constant magnetic stirring for 50 min at ambient temperature. Finally, the uniform solution was poured into a Teflon-lined autoclave, kept in an oven and maintained at 220 °C for 24 h. At the end of the reaction, the autoclave was allowed to cool naturally to room temperature, before the black product was collected and cleaned several times with DI water and ethanol, and then dried in a vacuum oven at 60 °C for 10 h. We also synthesized an MoS2-rGO nanocomposite by the same experiment without introducing CoFe2O4 nanoparticles, as shown in Fig. 1.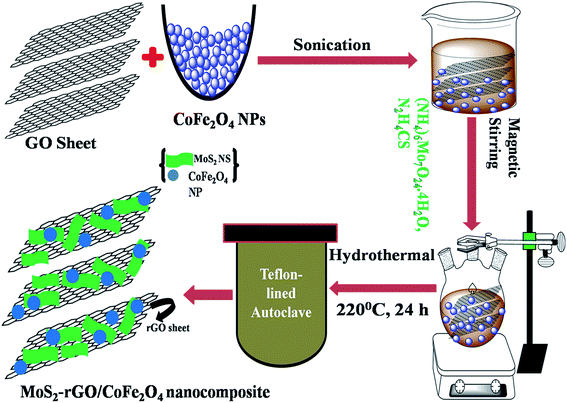 | ||
| Fig. 1 Schematic illustration of the synthetic route to MoS2-rGO and the MoS2-rGO/CoFe2O4 nanocomposite. | ||
2.4 Characterization tools
The synthesized nanocomposite was characterized by powder XRD (pXRD) measurements from 10° to 80° in 2θ angles with the help of a Rigaku Miniflex-600 diffractometer using Cu-Kα radiation (λ = 1.54056 Å) operating at 45 kV and a step size of 0.02°. Raman spectra were recorded using a Wi-Tech alpha Germany 300 RA spectrometer system under an argon laser (wavelength λ = 536 nm) with an output power 20–50 mW. The microstructure, surface morphology and elemental composition of the as-prepared nanocomposite were performed by transmission electron microscope (TEM; model JEOL JEM-2100F) operating at an accelerating voltage of 200 kV, and scanning electron microscope (SEM; Zeiss EVO40) operating at 20 kV to investigate the morphology of the sample. The EM wave absorption parameter and shielding effectiveness measurements were performed using a two-port Vector Network Analyzer (Agilent E8362B) to calculate absorption properties in the frequency range of 8–12 GHz. The powder samples were prepared by pressing into thick rectangular shaped pellets using a hydraulic press at 6 ton pressure. The rectangular shaped sample was inserted into two copper sample holders and sandwiched between two waveguides.3. Results and discussion
3.1 Phase composition and Raman spectra
The phase formation and crystal structure of CoFe2O4 (a), MoS2-rGO (b), and MoS2-rGO/CoFe2O4 (c) nanocomposites were investigated using pXRD, as depicted in Fig. 2. In Fig. 2a, diffraction peaks located at 2θ = 18.22°, 30.18°, 35.44°, 42.96°, 53.36°, 56.74°, 62.50°, and 74.04°, indexed as (111), (220), (311), (400), (422), (511), (440), and (533) crystal planes of pure CoFe2O4 nanoparticles, respectively.33 The XRD pattern of pure MoS2-rGO nanocomposite exhibits four diffraction peaks at around 2θ = 14.02°, 33.56°, 39.82°, and 58.50° are well assigned to the (002), (100), (103), and (110) lattice planes of a hexagonal MoS2 crystal structure, as depicted in Fig. 2b.34–38 As shown in Fig. 2c, the lattice planes of CoFe2O4 nanoparticles did not change after hybridization with MoS2-rGO, and are present in the MoS2-rGO/CoFe2O4 nanocomposite. However, the intensity of CoFe2O4 nanoparticles in the hybrid nanocomposite appears weaker than in pure CoFe2O4 nanoparticles. The reason appears to be the small amount of CoFe2O4 nanoparticles in the MoS2-rGO nanocomposite. Low crystallinity and a broad diffraction peak (002) for rGO (Fig. 2c) appeared at around 2θ = 26.16°, which may be ascribed to the weak scattering power and low concentration of rGO in the hybrid nanocomposite; however, the signature of rGO was readily identified by Raman spectroscopy, as shown in Fig. 3.39 No other additional diffraction peaks are observed, suggesting the successful formation of a 3D flower-like MoS2-rGO/CoFe2O4 nanocomposite during the hydrothermal process.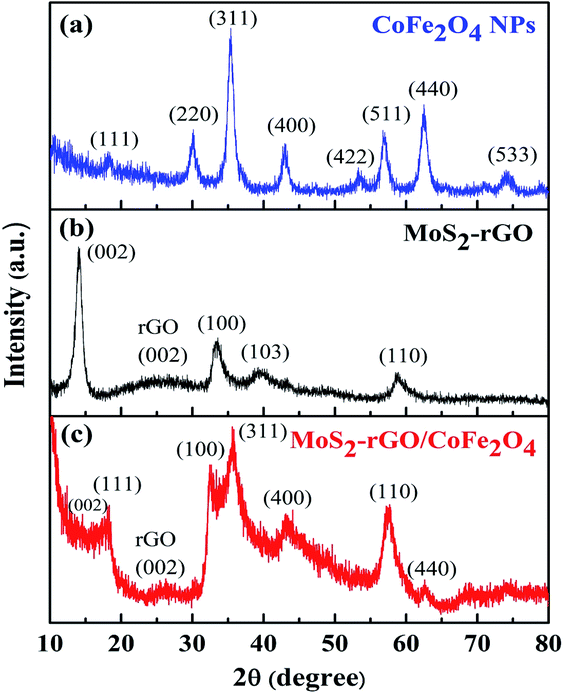 | ||
| Fig. 2 XRD patterns of (a) CoFe2O4 nanoparticles, (b) MoS2-rGO, and (c) the MoS2-rGO/CoFe2O4 nanocomposite. | ||
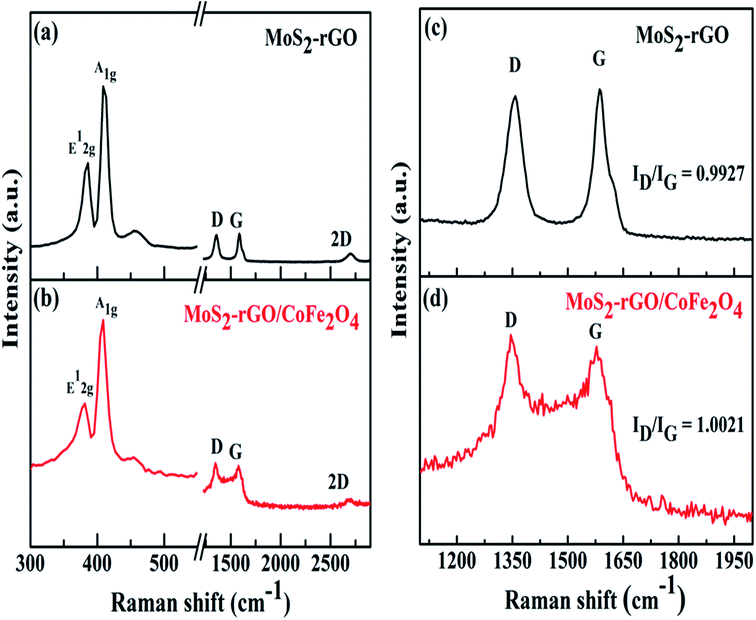 | ||
| Fig. 3 Raman spectra of (a) MoS2-rGO, and (b) the MoS2-rGO/CoFe2O4 nanocomposite, and (c) and (d) enlarged views of the D and G bands. | ||
Raman spectroscopy was used to observe crystal structure changes of carbon atoms in MoS2-rGO (a) and MoS2-rGO/CoFe2O4 (b) nanocomposite, as shown in Fig. 3. In Fig. 3a, two characteristic peaks of hexagonal MoS2 are displayed at 386.06 cm−1 and 408.82 cm−1, respectively, in the MoS2-rGO nanocomposite, belonging to lower energy E12g (in-plane Mo–S phonon mode) and higher energy A1g (out of plane vibration of S atom) Raman modes.40 There are two distinct strong peaks of rGO positioned at 1358 cm−1 (random arrangement of graphite crystallites) called the D-band, and at 1586 cm−1 (stretching vibration of C atoms in the sp2 hybridized plane) called the G-band, as illustrated in Fig. 3c and d.41 It is clear that the intensity ratio of the D- and G-band (ID/IG) for MoS2-rGO was observed at 0.9927, and gradually increased as CoFe2O4 nanoparticles were introduced and were found at 1.0021 for the MoS2-rGO/CoFe2O4 nanocomposite. The higher ID/IG values indicate that introducing CoFe2O4 nanoparticles creates a higher disorder degree and abundant defects edge structure in rGO to increase graphitization of C atoms during the preparation of the 3D hierarchical MoS2-rGO/CoFe2O4 nanocomposite.42
3.2 Morphology analysis and elemental composition
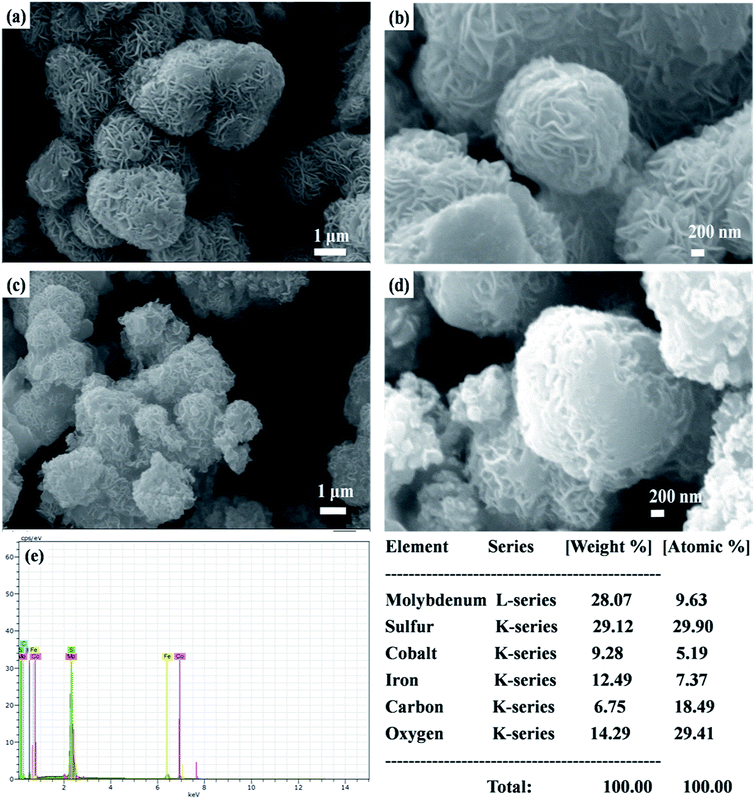
The surface morphologies of MoS2-rGO and MoS2-rGO/CoFe2O4 nanocomposite were characterized using FESEM, and are shown in Fig. 4. From Fig. 4a and b, a uniform 3D flower-like MoS2 microsphere was successfully prepared by self-assembly of a wrapped ultrathin layer MoS2 nanosheet-like structure, and randomly distributed onto the entire surface of the rGO nanosheet with a diameter size of around 1–2 μm.38,43 A flower-like MoS2 microsphere consists of several interconnected massive nanopetals with serious agglomeration due to the high concentration of molybdenum and sulfur vacancies.28 Most of the surface of the rGO nanosheet was uniformly covered by an excellent loading of densely packed MoS2 nanopetals.44 In Fig. 4c and d, spherical CoFe2O4 nanoparticles and hierarchical flower-like MoS2-rGO microspheres are mixed together consistently in the prepared MoS2-rGO/CoFe2O4 nanocomposite. This does not destroy the 3D microsphere structure and shows numerous defect curled sites of the MoS2 nanosheet on the surface of rGO nanosheet, as shown in Fig. 4c. From Fig. 4e, energy dispersive X-ray (EDX) analysis was used to illuminate the composition of the elements. The results confirmed the presence of Mo, S, C, O, Fe, and Co elements in the sample, with an atomic mass percent of 9.63, 29.90, 18.49, 29.41, 7.37 and 5.19%, respectively. The 3D hierarchical microsphere structure can expand the higher specific surface area to enhance interfacial polarization and defect dipole polarization, which is beneficial for greater attenuation of incident EM energy within the shield.HRTEM has been used to examine the microscopic structure of MoS2-rGO and the MoS2-rGO/CoFe2O4 nanocomposite, as depicted in Fig. 5. The dark contrast object MoS2 is a fabricated wrapped nanosheet-like microstructure with plenty of folded edges well dispersed with a gray background rGO wrinkled paper-like morphology to form very close contact with each other, as shown in Fig. 5a.38 The HRTEM image in Fig. 5b indicates that the interplanar distance of the fringes were estimated at around ∼0.62 nm at the edge of the crumpled paper-like structure and indexed to the (002) crystal plane of the layered crystalline MoS2 with a hexagonal structure. MoS2 uniformly dispersed on the surface of rGO nanosheet with d-spacing 0.34 nm corresponds to the (002) crystal plane of the rGO nanosheet.28,29 Three diffraction rings well indexed to the (002), (100), and (110) reflections of MoS2 and the (002) plane of rGO nanosheet were observed on the selected area electron diffraction (SAED) pattern (Fig. 5a). The HRTEM image in Fig. 5c shows that the spherical CoFe2O4 nanoparticles were randomly decorated on the surface of the MoS2-rGO nanocomposite with an average diameter size of around 8–12 nm. From Fig. 5d, the lattice fringe with a d-spacing of spherical CoFe2O4 nanoparticles of 0.48 nm, corresponding to the (111) lattice plane, is consistent with the XRD results.
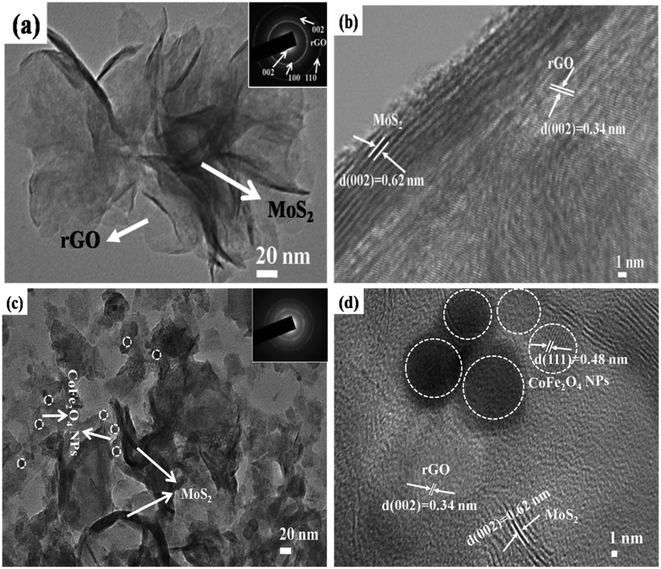 | ||
| Fig. 5 TEM images of (a) MoS2-rGO and (c) MoS2-rGO/CoFe2O4 at low-resolution and (b) MoS2-rGO and (d) MoS2-rGO/CoFe2O4 at high-resolution. | ||
3.3 EMI shield performance of the nanocomposite
Scattering-parameters were carried-out with the help of a Vector Network Analyzer to investigate the incident microwave attenuation performance of the materials. The total shielding effectiveness (SET) of a material can be considered in the following terms; when an incident EM waves pass through a shield material, some is part absorbed (SEA), some is reflected (SER), and the rest is transmitted or undergoes multiple reflections (SEM) through the shield material. Therefore, SET is a function of the logarithmic ratio of incoming power (PI) to outgoing power (PT) of the EM wave, and represented in decibels (dBs) as follows:5
 | (1) |
The multiple reflection term (SEM) value of the shielding material can be neglected when SEA ≥ 10 dB. Therefore, the total SE can be written as:17
| SET (dB) = SER (dB) + SEA (dB) |
Further, the SEA and SER can be obtained regarding electrical conductivity (σac), thickness of the shield (t), relative permeability (μr), and skin depth of the material (δ), expressed as:28
 | (2) |
 | (3) |
The SE due to reflection decreases with increasing frequency and SE due to absorption increases with increasing frequency. A material exhibits higher reflection loss (SER) if it has larger electrical conductivity and smaller magnetic permeability; while a higher SEA value is mainly attributed to both higher electrical conductivity and magnetic permeability of a material. The electrical conductivity (σac) of a material is related to dielectric loss σac = ωεoε′′ and skin depth (δ) as  respectively. The skin depth (δ) of a material decreases with increasing frequency (f), conductivity (σ), and permeability (μ).8
For better understanding of the EMI shielding mechanism, various shielding parameters (SER, SEA, and SET) were further analyzed in the desired frequency range (X-band), and are shown in Fig. 6. SE due to reflection (SER) is shown in Fig. 6a for the samples MoS2, rGO, CoFe2O4, MoS2-rGO, and the MoS2-rGO/CoFe2O4 nanocomposite, and their values were found to be 2.71, 4.17, 1.52, 6.57, and 7.80 dB, respectively. On the other hand, Fig. 6b represents SE due to absorption (SEA) for the same samples, with values 3.61, 9.69, 3.97, 10.60 and 12.62 dB, respectively. These graphs show that the contribution from reflection is much lower than the absorption, suggesting that absorption is the main mechanism for shielding effectiveness. The poor SER value is generally due to microwave impedance mismatching and is proportional to  17 A material represents higher reflection loss (SER) if it has larger electrical conductivity and smaller magnetic content. The higher SEA value attributed mainly to both higher electrical conductivity and magnetic permeability is directly proportional to
  27 These two parameters can be successfully enhanced by introducing rGO and CoFe2O4 nanoparticles in the MoS2 nanosheet, and have a great influence on the EMI shielding effectiveness. The significantly improved EMI SE may contribute to the conductivity as rGO and magnetic content as CoFe2O4 nanoparticles, and serve as an excellent conductive and magnetic network in the MoS2-rGO/CoFe2O4 nanocomposite. Therefore, a moderate value of electrical conductivity and impedance matching is required for materials with less SE due to reflection and more SE due to absorption. A superior MA and shielding performance is strongly dependent on defect dipole polarization, interfacial polarization, eddy current loss, and magnetic hysteresis loss, which ascribed most of the EM energy attenuated inside the shield. It is clear from Fig. 6c that the MoS2 nanosheet shows the least value of SET (6.33 dB) due to the lack of magnetic content, whereas the CoFe2O4 nanoparticles show a similar poor performance SET (5.37 dB) because of low conductivity. The rGO nanosheet represents a higher SET ∼13.87 dB due to higher electrical conductivity. A maximum value of total SE (SET) ∼19.26 dB was achieved by the MoS2-rGO/CoFe2O4 nanocomposite, suggesting more incident EM energy is absorbed inside the sample. This value is higher as compared with SET ∼16.52 dB for MoS2-rGO nanocomposite, indicating transparency to incoming EM energy, as shown in Fig. 6c. The total SE value of the MoS2-rGO/CoFe2O4 nanocomposite continuously decreases with increasing frequency and suggests that the CoFe2O4 nanoparticles decorating the MoS2-rGO nanocomposite exhibit excellent efficiency at a low-frequency range for EMI shielding performance, as displayed in Fig. 6c.
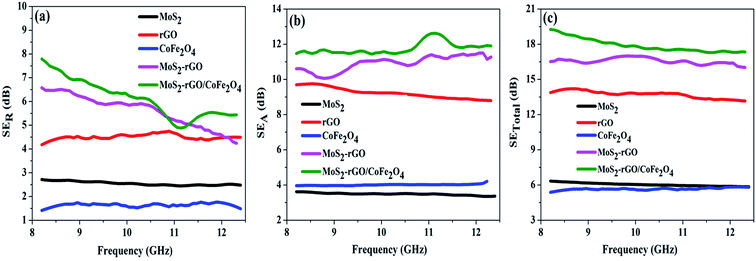 | ||
| Fig. 6 Frequency dependence of the EMI shielding performance: (a) SER, (b) SEA, and (c) SET values of MoS2, rGO, CoFe2O4, MoS2-rGO, and the MoS2-rGO/CoFe2O4 nanocomposite in the X-band range. | ||
3.4 EM wave absorption performance of the nanocomposite
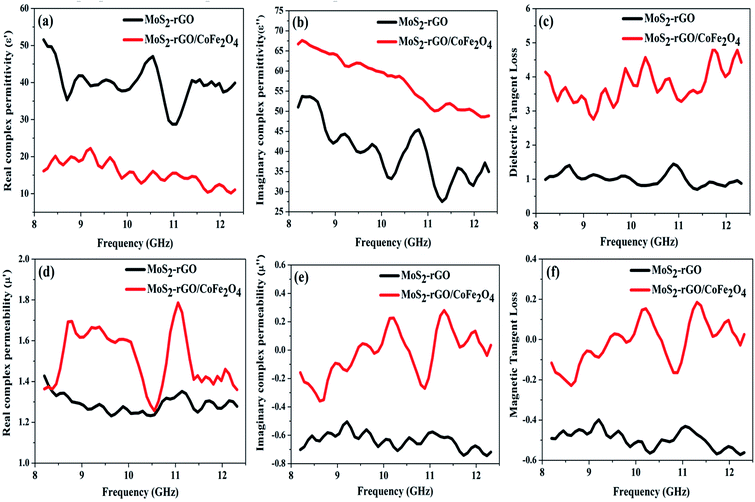
EM wave absorption performance of materials related to the relative complex permittivity (εr) were calculated using the Debye dipolar relaxation process and expressed as:19
 | (4) |
 | (5) |
 and indicates that the moderate of the permittivity and permeability (εr ≈ μr) should be close to Zr = 1. This shows that all incident EM waves can enter inside shield materials.15 In the MoS2-rGO/CoFe2O4 nanocomposite, the imaginary permittivity (ε′′) and dielectric loss
  was too high, at 67.62 and 4.84 as compared with 53.70, 1.44 for MoS2-rGO nanocomposite, which indicates that more attenuation of EM energy can be achieved within the shield compared with pure MoS2-rGO. In other words, the introduction of magnetic nanoparticles plays an important role in higher ε′′ values due to the formation of a highly conductive and magnetic filler with a large surface area, leading to migration of charges at multi-interfaces between MoS2, rGO, and CoFe2O4 and generating interfacial polarization. The complex permeability μ′ and μ′′ values of MoS2-rGO/CoFe2O4 nanocomposite are slightly higher than MoS2-rGO. Reasons that the introduction of CoFe2O4 nanoparticles represents a little sign of a magnetic ascension leading to enhanced complex permeability of materials and the results are presented in Fig. 7d and e. On other hand, low μ′ and μ′′ values of the MoS2-rGO nanocomposite, leads to degradation of the impedance matching performance and originates from the poor magnetic property of the materials.
We have also calculated dielectric loss tangent  and magnetic loss tangent
  of as-prepared nanocomposite with the help of relative complex permittivity (εr), permeability (μr), and used this to appreciate dissipation capacity of the incident EM energy within the medium, as shown in Fig. 7c and f.28 The dielectric loss ability of the material is due to multiple interfacial polarization, defect dipole polarization, conductance loss, and space charge polarization, while magnetic loss ability is mainly associated with natural resonance loss, anisotropy energy loss, eddy current loss, and magnetic hysteresis loss, respectively.24 Ideal MA materials should exhibit higher dielectric loss and magnetic loss, and their ratio should be around ∼1 for proper impedance matching for strong attenuation of EM energy inside the shield sample.13 In Fig. 7c and f, the value of tan
![[thin space (1/6-em)]](https://www.rsc.org/images/entities/char_2009.gif) δμ is much lower than the value of tan
δμ is much lower than the value of tan![[thin space (1/6-em)]](https://www.rsc.org/images/entities/char_2009.gif) δε, suggesting that the magnetic content in the nanocomposite is very low. Thus, this result indicates that the EM wave attenuation mechanism for MA performance is mainly associated with the dielectric loss instead of the magnetic loss. The μ′′ and magnetic loss value for MoS2-rGO and MoS2-rGO/CoFe2O4 nanocomposite are negative in Fig. 7e and f, which suggests that magnetic energy is emitted away from these materials owing to the migration of charge carriers. Further, the existence of a higher disorder degree and abundant defects/functional groups, specific surface area, multiple reflections and scattering inside the shield play an essential role in enhancing the microwave shielding effectiveness of the MoS2-rGO/CoFe2O4 nanocomposite. From these observed outcomes, this may be making a final decision that MoS2-rGO/CoFe2O4 nanocomposite has excellent dissipation ability of the incident EM waves compared with the pure MoS2-rGO nanocomposite.
δε, suggesting that the magnetic content in the nanocomposite is very low. Thus, this result indicates that the EM wave attenuation mechanism for MA performance is mainly associated with the dielectric loss instead of the magnetic loss. The μ′′ and magnetic loss value for MoS2-rGO and MoS2-rGO/CoFe2O4 nanocomposite are negative in Fig. 7e and f, which suggests that magnetic energy is emitted away from these materials owing to the migration of charge carriers. Further, the existence of a higher disorder degree and abundant defects/functional groups, specific surface area, multiple reflections and scattering inside the shield play an essential role in enhancing the microwave shielding effectiveness of the MoS2-rGO/CoFe2O4 nanocomposite. From these observed outcomes, this may be making a final decision that MoS2-rGO/CoFe2O4 nanocomposite has excellent dissipation ability of the incident EM waves compared with the pure MoS2-rGO nanocomposite.
There are several reasons behind the synthesized MoS2-rGO/CoFe2O4 nanocomposite having an excellent MA and EMI shielding performance. The MoS2 nanosheet shows excellent dielectric loss of materials and possesses multiple interface structures and dipole polarization charges on the surface of the nanosheet to enhance interface polarization and defect dipole polarization. The rGO nanosheet represents highly conductive materials with a strong dielectric loss due to abundant defects on its surface and many functional groups with high specific surface area. CoFe2O4 nanoparticles are magnetic loss absorbent, and the introduction can improve the impedance matching properties of the MoS2-rGO/CoFe2O4 nanocomposite. The enhanced dielectric loss and magnetic loss allow a novel route for the development of MA performance and excellent shielding effectiveness due to absorption. A pictorial model of the superb microwave shielding phenomenon is demonstrated in Fig. 8.
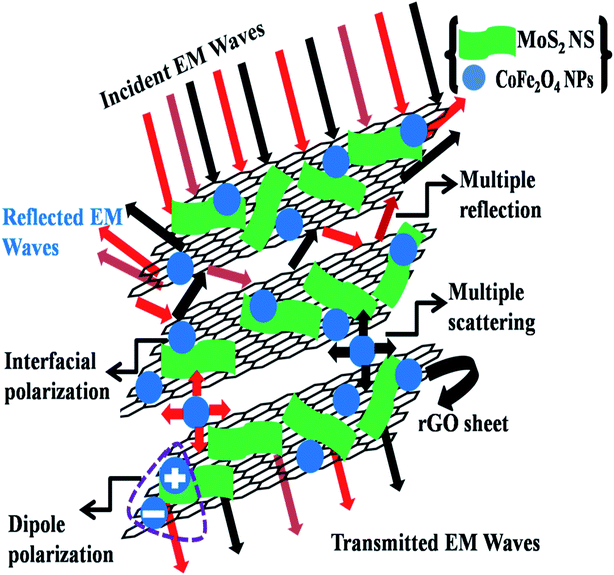 | ||
| Fig. 8 A schematic illustration of the EMI shielding mechanism in the MoS2-rGO/CoFe2O4 nanocomposite. | ||
A detailed comparison of SETotal of MoS2-rGO/CoFe2O4 nanocomposite and some useful EMI shielding materials are listed in Table 1.
| Sr. No. | Sample name | Thickness (mm) | SETotal (dB) | References |
|---|---|---|---|---|
| 1 | MoS2-rGO/Fe3O4 | 1.3 | 8.27 | Prasad et al.28 |
| 2 | Graphene/PMMA (1.8 vol%) | 2.4 | 16 | Zhang et al.45 |
| 3 | La0.7Sr0.3MnO3 (100 wt%) | 2 | 19 | Reshi et al.46 |
| 4 | Carbonyl iron/PVDF (50 wt%) | 1.2 | 20 | Joseph et al.47 |
| 5 | rGO@Fe3O4/poly(etherimide) | 2.5 | 14–18 | Shen et al.48 |
| 6 | rGO/Ba-ferrite | 1 | 18 | Verma et al.49 |
| 7 | 20% Gd@MoS2-rGO | 1.1 | 20.47 | Prasad et al.50 |
| 8 | MoS2-rGO/CoFe2O4 | 1.4 | 19.26 | Present work |
4. Conclusions
In summary, CoFe2O4 nanoparticles decorated onto the surface of a MoS2-rGO nanocomposite have been successfully synthesized by a simple two-step hydrothermal method. HRTEM results confirmed the decoration of CoFe2O4 nanoparticles onto the surface of the MoS2-rGO nanocomposite with a size of around 8–12 nm. CoFe2O4 nanoparticles can act as a highly conductive and magnetic filler with a large surface area and favor proper impedance matching to improve dielectric loss and magnetic loss of the materials. Total SE (SET ∼19.26 dB) was achieved for the MoS2-rGO/CoFe2O4 nanocomposite, suggesting more incident EM energy was absorbed, while the pure MoS2-rGO nanocomposite presents total SE (SET ∼16.52 dB) and indicates transparency to incoming EM energy. The multiple interfacial polarizations, defect dipole polarization and eddy current loss contribute to the strong attenuation loss ability of incident EM energy within the shield materials. Thus, this work suggests that the MoS2-rGO/CoFe2O4 nanocomposite is a potential candidate and can be widely applied to EM pollution cleaning, wireless telecommunications, military weapons, and human health care.Conflicts of interest
There are no conflicts to declare.Acknowledgements
We are thankful to SERB Project (EEQ/2016/000652), UPE-II (172) and DST-PURSE, Govt. of India for financial support. Jagdees Prasad acknowledges the award of a Senior Research Fellowship from UGC. We are also thankful to AIRF and JNU for providing all special features.References
- K. Zhang, X. Gao, Q. Zhang, T. Li, H. Chen and X. Chen, J. Alloys Compd., 2017, 721, 268–275 CrossRef CAS.
- J. Zhang, R. Shu, C. Guo, R. Sun, Y. Chen and J. Yuan, J. Alloys Compd., 2019, 784, 422–430 CrossRef CAS.
- F. Shahzad, P. Kumar, S. Yu, S. Lee, Y. H. Kim, S. M. Hong and C. M. Koo, J. Mater. Chem. C, 2015, 3, 9802–9810 RSC.
- R. Kumar, H. K. Choudhary, S. P. Pawar, S. Bose and B. Sahoo, Phys. Chem. Chem. Phys., 2017, 19, 23268–23279 RSC.
- S. Singh, P. Tripathi, A. Bhatnagar, Ch. R. P. Patel, A. P. Singh, S. K. Dhawan, B. P. Gupta and O. N. Srivastava, RSC Adv., 2015, 5, 107083–107087 RSC.
- S. Umrao, T. K. Gupta, S. Kumar, V. K. Singh, M. K. Sultania, J. H. Jung, I. K. Oh and A. Srivastava, ACS Appl. Mater. Interfaces, 2015, 7, 19831–19842 CrossRef CAS.
- A. P. Guo, X. J. Zhang, S. W. Wang, J. Q. Zhu, L. Yang and G. S. Wang, ChemPlusChem, 2016, 81, 1305–1311 CrossRef CAS.
- A. P. Guo, X. J. Zhang, J. K. Qu, S. W. Wang, J. Q. Zhu, G. S. Wang and L. Guo, Mater. Chem. Front., 2017, 1, 2519–2526 RSC.
- Y. Zhou, Q. Wen, Z. Ren, H. Xie, S. Tao and W. Zhou, J. Alloys Compd., 2018, 733, 33–39 CrossRef CAS.
- W. Zhang, X. Zhang, H. Wu, H. Yan and S. Qi, J. Alloys Compd., 2018, 751, 34–42 CrossRef CAS.
- J. Wang, X. Lin, R. Zhang, Z. Chu and Z. Huang, J. Alloys Compd., 2018, 743, 26–35 CrossRef CAS.
- Q. L. Wen, W. C. Zhou, J. B. Su, Y. C. Qing, F. Luo and D. M. Zhu, J. Alloys Compd., 2016, 666, 359–365 CrossRef CAS.
- M. Li, X. Cao, S. Zheng and S. Qi, J. Mater. Sci.: Mater. Electron., 2017, 28, 16802–16812 CrossRef CAS.
- E. Yang, X. Qi, R. Xie, Z. Bai, Y. Jiang, S. Qin, W. Zhong and Y. Du, Appl. Surf. Sci., 2018, 442, 622–629 CrossRef CAS.
- B. Quan, X. Liang, G. Xu, Y. Cheng, Y. Zhang, W. Liu, G. Ji and Y. Du, New J. Chem., 2017, 41, 1259–1266 RSC.
- B. P. Singh, D. K. Saket, A. P. Singh, S. Pati, T. K. Gupta, V. N. Singh, S. R. Dhakate, S. K. Dhawan, R. K. Kotnala and R. B. Mathur, J. Mater. Chem. A, 2015, 3, 13203–13209 RSC.
- A. P. Singh, P. Garg, F. Alam, K. Singh, R. B. Mathur, R. P. Tandon, A. Chandra and S. K. Dhawan, Carbon, 2012, 50, 3868–3875 CrossRef CAS.
- X. Liang, X. Zhang, W. Liu, D. Tang, B. Zhang and G. Ji, J. Mater. Chem. C, 2016, 4, 6816–6821 RSC.
- A. Xie, M. Sun, K. Zhang, W. Jiang, F. Wu and M. He, Phys. Chem. Chem. Phys., 2016, 18, 24931–24936 RSC.
- B. Zhao, W. Zhao, G. Shao, B. Fan and R. Zhang, ACS Appl. Mater. Interfaces, 2015, 7, 12951–12960 CrossRef CAS.
- X. Sun, J. He, G. Li, J. Tang, T. Wang, Y. Guo and H. Xue, J. Mater. Chem. C, 2013, 1, 765–777 RSC.
- J. Zhang, R. Shu, Y. Ma, X. Tang and G. Zhang, J. Alloys Compd., 2019, 777, 1115–1123 CrossRef CAS.
- M. Q. Ning, M. M. Lu, J. B. Li, Z. Chen, Y. K. Dou, C. Z. Wang, F. Rehman, M. S. Cao and H. B. Jin, Nanoscale, 2015, 7, 15734–15740 RSC.
- M. Cao, C. Han, X. Wang, M. Zhang, Y. Zhang, J. Shu, H. Yang, X. Fang and J. Yuan, J. Mater. Chem. C, 2018, 6, 4586–4602 RSC.
- X. Ding, Y. Huang, S. Li, N. Zhang and J. Wang, Composites, Part A, 2016, 90, 424–432 CrossRef CAS.
- Y. Sun, W. Zhong, Y. Wang, X. Xu, T. Wang, L. Wu and Y. Du, ACS Appl. Mater. Interfaces, 2017, 9, 34243–34255 CrossRef CAS.
- Y. Yang, M. Li, Y. Wu, T. Wang, E. S. Choo, J. Ding, B. Zong, Z. Yang and J. Xue, Nanoscale, 2016, 8, 15989–15998 RSC.
- J. Prasad, A. K. Singh, J. Shah, R. K. Kotnala and K. Singh, Mater. Res. Express, 2018, 5, 055028–055038 CrossRef.
- X. Wang, W. Zhang, X. Ji, B. Zhang, M. Yu, W. Zhang and J. Liu, RSC Adv., 2016, 6, 106187–106193 RSC.
- D. Zhang, Y. Jia, J. Cheng, S. Chen, J. Chai, X. Yang, Z. Wu, H. Wang, W. Zhang, Z. Zhao, C. Han, M. Cao and G. P. Zheng, J. Alloys Compd., 2018, 758, 62–71 CrossRef CAS.
- M. Sabet, H. Jahangiri and E. Ghashghaei, J. Mater. Sci.: Mater. Electron., 2018, 29, 10853–10863 CrossRef CAS.
- L. Staudenmaier, Verfahren zur darstellung der graphitsäure, Ber. Dtsch. Chem. Ges., 1898, 31, 1481–1487 CrossRef CAS.
- V. Georgiadou, C. Kokotidou, B. L. Droumaguet, B. Carbonnier, T. C. Papadopoulou and C. D. Samara, Dalton Trans., 2014, 43, 6377–6388 RSC.
- G. Feng, A. Wei, Y. Zhao and J. Liu, J. Mater. Sci.: Mater. Electron., 2015, 26, 8160–8166 CrossRef CAS.
- W. Zhang, L. Li, W. Zhu, H. Yan and S. Qi, J. Mater. Sci.: Mater. Electron., 2017, 28, 15488–15494 CrossRef CAS.
- X. Su, D. Wang, Q. Yan, X. Guo, S. Fang and Y. Liu, J. Mater. Sci.: Mater. Electron., 2018, 29, 4020–4029 CrossRef CAS.
- J. Yang, M. Ye, A. Han, Y. Zhang and K. Zhang, J. Mater. Sci.: Mater. Electron., 2019, 30, 292–301 CrossRef CAS.
- L. Wu, X. Xu, Y. Zhao, K. Zhang, Y. Sun, T. Wang, Y. Wang, W. Zhong and Y. Du, Appl. Surf. Sci., 2017, 425, 470–477 CrossRef CAS.
- W. Xiao, W. Zhou, T. Feng, Y. Zhang, H. Liu and L. Tian, Materials, 2016, 9, 783–796 CrossRef.
- S. Ahmed, X. Ding, N. Bao, P. Bian, R. Zheng, Y. Wang, P. P. Murmu, J. V. Kennedy, R. Liu, H. Fan, K. Suzuki, J. Ding and J. Yi, Chem. Mater., 2017, 29, 9066–9074 CrossRef CAS.
- Y. Shang, T. Li, Y. Yin, H. Li, L. Zhang, J. Lyu, C. Xiong and T. Zhao, Chem. Lett., 2017, 46, 527–529 CrossRef CAS.
- A. Naskar, H. Khan and S. Jana, J. Sol-Gel Sci. Technol., 2018, 86, 599–609 CrossRef CAS.
- J. Xiang, D. Dong, F. Wen, J. Zhao, X. Zhang, L. Wang and Z. Liu, J. Alloys Compd., 2016, 660, 11–16 CrossRef CAS.
- N. A. Alarfaj, M. F. E. Tohamy and H. Oraby, New J. Chem., 2018, 42, 11046–11053 RSC.
- H. B. Zhang, Q. Yan, W. G. Zheng, Z. He and Z. Z. Yu, ACS Appl. Mater. Interfaces, 2011, 3, 918–924 CrossRef CAS.
- H. A. Reshi, A. P. Singh, S. Pillai, R. S. Yadav, S. K. Dhawan and V. Shelke, J. Mater. Chem. C, 2015, 3, 820–827 RSC.
- N. Joseph and M. T. Sebastian, Mater. Lett., 2013, 90, 64–67 CrossRef CAS.
- B. Shen, W. Zhai, M. Tao, J. Ling and W. Zheng, ACS Appl. Mater. Interfaces, 2013, 5, 11383–11391 CrossRef CAS.
- M. Verma, A. P. Singh, P. Sambyal, B. P. Singh, S. K. Dhawan and V. Choudhary, Phys. Chem. Chem. Phys., 2015, 17, 1610–1618 RSC.
- J. Prasad, A. K. Singh, K. K. Haldar, V. Gupta and K. Singh, J. Alloys Compd., 2019, 788, 861–872 CrossRef CAS.
| This journal is © The Royal Society of Chemistry 2019 |

