 Open Access Article
B-site modified photoferroic Cr3+-doped barium titanate nanoparticles: microwave-assisted hydrothermal synthesis, photocatalytic and electrochemical properties†
I. C. Amaechi a,
G. Kolhatkar
 a,
A. Hadj Youssefa,
D. Rawach
 b,
S. Sun
 a and
A. Ruediger*a
aInstitut National de la Recherche Scientifique, Centre Énergie, Matériaux, Télécommunications (INRS-EMT), 1650 Boulevard Lionel-Boulet, Varennes, Québec J3X 1S2, Canada. E-mail: ruediger@emt.inrs.ca
bDépartement de Chimie, Faculté des Sciences, Université de Sherbrooke, 2500 Boulevard de l'Université, Sherbrooke, Québec J1K 2R1, Canada
First published on 3rd July 2019
Abstract
We report on the synthesis of photoferroic Cr3+-doped BaTiO3 nanoparticles with nominal Cr content ranging from 2–8 mol% by a microwave-assisted hydrothermal method. The absorption properties of the doped systems are significantly enhanced due to the d–d band transition of Cr3+/4+. The structural properties of the materials are examined on the basis of lattice distortions given by the tolerance factor and microstrain. Raman scattering provides complementary information on the lattice vibrations indicating a softening of the longitudinal optic (LO) phonon mode located at 716 cm−1 with increasing Cr concentration. The charge transport properties investigated through electrochemical impedance spectroscopy (EIS) demonstrate that there is a reduction in the charge transfer resistance from 5.2 Ω to 4.3 Ω for the undoped and 4 mol% Cr3+-doped respectively, which favors the degradation kinetics. The photo-oxidation ability of the systems is evaluated by time evolution of photodegradation of methyl orange under standardized solar irradiation. The experimental results confirm that the best photocatalytic performance is achieved with the 4 mol% Cr3+-doped BaTiO3 nanoparticles, which is ∼2.7 times higher than for the undoped sample. Evidence of superoxide radical being the dominant active species is provided by in situ reactive oxide species (ROS) capture experiments.
1 Introduction
Due to the increasing world population and industrialization, water pollution has become a major global challenge that has yet to be addressed. The classical solution to this challenge has shown that various physicochemical treatment techniques e.g. adsorption and membrane filtration have been effectively deployed but the production of sludge and lack of selectivity for target pollutants limit their applications.1 On the other hand, wastewater treatment by means of chemical oxidation is also viable mostly through the advance oxidation processes. Unfortunately, the huge energy consumption alongside catalyst recovery have retarded its applicability.2 Photocatalysis for the decomposition of pollutants has been identified as a promising solution to parts of this challenge. The principle idea consists of employing a semiconducting material to accelerate a photoreaction. Cascades of radicals are generated, leading to photo-oxidation/reduction of the pollutants. Although experimental results are promising, the elimination of water pollutants through photocatalysis remains limited by poor light absorption, charge carrier separation and transport3,4 and redox potential of charge carriers on the surface.5 To address the issue of poor light absorption, both non-metal and metal doping can be employed to improve the light-absorption-improved photocatalytic activities.6–9 In addition, oxides, such as bimetallic oxides have been identified as promising candidates for such applications. In particular, inorganic oxide perovskites of the type ABO3 display a high potential for photocatalysis due to their high stability and chemical resistance in aqueous solution.10 In these materials, A- and B-site are mostly composed of alkaline-earth and transition metals respectively. These materials already find numerous applications as high-temperature (high-TC) superconductors, piezoelectric and ferroelectric materials, magnetoresistors, multiferroic and catalytic materials etc.11,12 Among the most commonly used oxide perovskites is barium titanate (BaTiO3). Though conventional TiO2 has gained wide acceptance, the low absorption cross-section, low adsorption capacity for hydrophobic contaminants, poor charge carrier separation resulting to low quantum yield among others, have placed a limitation on TiO2-based photocatalysis. To overcome the shortcomings particularly the poor charge carrier separation, the use of piezoelectric materials such as BaTiO3 plays remarkably non-trivial role in improving the photoactivity. In mostly the low symmetry crystal phase, it offers the advantage of increasing the lifetime of charge carriers sufficiently long enough before the recombination that happens on a time scale of picoseconds sets in. BaTiO3 is known to exist in different structural phases as a function of temperature, size and dopants. The high-temperature paraelectric phase shows no spontaneous electric polarization due to Ti-atom occupying the centrosymmetric sites with respect to oxygen13 while the orthorhombic (Amm2, <0–5 °C), rhombohedral (R3m, <−80 °C), tetragonal (P4mm, <120 °C)14,15 and high temperature hexagonal (P4/mmm, 1460 °C) phases16 exhibit a ferroelectric response. Ferroelectrics, being non-centrosymmetric, present the bulk photovoltaic effect (BVPE), which significantly contributes to enhanced photoactivity. The BVPE is a second order optical response that can be described by a third rank tensor, , where e, l0, ξ and ϕ are the electronic charge, mean free path of charge carriers, excitation asymmetry and quantum yield respectively, and the denominator corresponds to the photonic energy.17 As a hot carrier effect, this bulk property engenders carrier separation and energy loss in form of heat is drastically reduced. This internal electric field-driven separation of charges significantly increases the lifetime, allowing a larger fraction of the carriers to participate in redox reaction thereby enhancing the photoactivity.
However, the photocatalytic activity of BaTiO3 remains limited by low intrinsic absorption. The absorption property can be improved by introducing a dopant in the crystal structure. The doping element is incorporated through atomic substitution of an A- and/or B-site. It is to be chosen carefully depending on the application as it could lead to tuning of the ferroelectric Curie temperature18 or control of material's permittivity.19 Furthermore, a difference between radii of the dopant and that of the substituted atom can induce strain in the material that in turn may result in a phase change.20 In this context, doped BaTiO3 using donor and/or acceptor atoms for environmental remediation has been reported.6,21,22 Chromium is a promising option, as it is a transition metal with the potential of enhancing the optical properties through an increase in the absorption cross-section in the visible region. That is, its charge transfer center is associated with strong absorption in the visible range, beneficial for energy harvesting. Compared to doping with noble metals, chromium is economically feasible and suitable for large-scale production.
Different chemical routes23 have been established to synthesize BaTiO3. Some require pyrolysis and crystallization of a disordered precursors, which yields poorly crystalized materials.24 The microwave-assisted hydrothermal (MWHT) method offers the advantage of a rapid synthesis usually in one step by interaction of dielectric molecules in solid or liquid phase with nonionizing microwave radiation. First results confirmed the suitability of this method has been identified for the synthesis of Cr-doped BaTiO3 for photocatalytic applications.10 However, although the process was rapid, barium titanate crystallized in the paraelectric phase, while a ferroelectric phase such as the tetragonal structure might be far more beneficial due to the existence of the aforementioned BPVE.
Herein, we synthesize Cr3+-doped BaTiO3 by MWHT and demonstrate its potential for photocatalysis. Structural characterizations reveal that the material is indeed in the tetragonal phase. We use hydrogen peroxide, H2O2 to scavenge excess protons that are the primary cause of leakage in the ferroelectric bulk and also contribute to surface defects acting as recombination sites. XPS reveals a negligible concentration (below the detection limit) of hexavalent chromium and the presence of its trivalent state, more appropriate for water purification and environmentally less problematic. Moreover, the misconception of band gap narrowing arising from doping is addressed (see ESI, Fig. S1†) as it is generally misinterpreted as a reduction in the fundamental absorption of a material.
2 Experimental details
2.1 Synthesis of Cr3+-doped BaTiO3 nanoparticles
The nanoparticles of Cr3+-doped BaTiO3 are synthesized by MWHT using high purity and analytical grade precursors of titanium oxide (TiO2 (>99.7%)), barium hydroxide (Ba(OH)2·8H2O (>98%)), chromium nitrate Cr(NO3)3·9H2O (>98%), and hydrogen peroxide (H2O2 (30%)) purchased from Sigma-Aldrich Chemicals. The nanoparticles are prepared from a mixture of TiO2, Ba(OH)2·8H2O and Cr(NO3)3·9H2O in the molar ratio of 18![[thin space (1/6-em)]](https://www.rsc.org/images/entities/char_2009.gif) :
:![[thin space (1/6-em)]](https://www.rsc.org/images/entities/char_2009.gif) 29
29![[thin space (1/6-em)]](https://www.rsc.org/images/entities/char_2009.gif) :
:![[thin space (1/6-em)]](https://www.rsc.org/images/entities/char_2009.gif) 2 dissolved in distilled water.
2 dissolved in distilled water.
A TiO2 slurry is prepared by dispersing the powder in distilled water. The Ti4+ solution is then magnetically stirred for 10 min followed by the addition of Ba(OH)2·8H2O, Cr(NO3)3·9H2O (Cr3+ = 2, 4, 6 and 8 mol%), and 2 mL of H2O2. The H2O2 is added to scavenge the excess H+ ions, which are the main cause of electronic leakage. The resulting mixture is then stirred for another 20 min to obtain a homogeneous solution.
Subsequently, the mixture is transferred into a Microwave Acid Digestion autoclave (Parr Instrument) with 23 mL capacity. The reactor assembly is placed in a Panasonic Inverter Microwave Oven (2.45 GHz) operating at 120 W for 10 min. These parameters correspond to 1 cycle of microwave irradiation. To avoid overpressure, the reactor assembly is allowed to cool down almost to room temperature for ∼1 h before repeating the process of microwave irradiation. Finally, after a total of three cycles, the final product is washed in distilled water, filtered and dried at 80 °C for 15 h. The same procedure is employed to synthesize the undoped BaTiO3 sample but without the addition of chromium.
2.2 Characterization of samples
The phase identification of the samples is done by powder X-ray diffraction (XRD, Bruker D8 Advance) using Cu-Kα radiation (λ = 1.5406 Å). 2θ scans in the 20–60° range are performed with a 0.02° step size. The absorbance spectra are measured in the 300–600 nm range using a (PerkinElmer, Lambda 750) UV-visible-NIR spectrometer with 1 nm spectral resolution. Samples for the optical absorption are prepared by dispersing a weighed quantity of the nanoparticles in distilled water followed by dip-coating of a pretreated quartz substrate. Also, plain quartz substrate is used as reference. Raman scattering spectra are acquired with a Horiba iHR320 equipped with a 473 nm solid state blue Cobolt 04-01 laser (linearly polarized, TEM00) and a thermoelectrically cooled Horiba Scientific Synapse Back-Illuminated Deep Depletion CCD detector. The bright field surface images of the samples are acquired by transmission electron microscopy (TEM, JOEL Model: JEM-2100F). The chemical composition of the samples is investigated by X-ray photoelectron spectroscopy (XPS) using a VG Escalab 220i XL system equipped with a 1486.6 eV Al-Kα source. The C–C bond of C 1s peak with binding energy of 284.6 eV is used to calibrate the whole spectra.A reactor assembly consisting of a three-electrode system connected to a Zahner Elektrik Zennium Photoelectrochemical Workstation is employed for the electrochemical measurements. In the three-electrode system i.e. counter, reference and working electrode, Pt, Ag/AgCl and photoferroic films on ITO are used, respectively. The cell electrolyte consists of a 0.5 M Na2SO4 solution. The working electrode is prepared by dispersing 50 mg of the photoferroic nanoparticles in 600 μL of a N-methyl-2-pyrrolidone (NMP) and polyvinylidene fluoride (PVDF) composite solution. The resulting solution is ultrasonicated for 10 min before being spin-coated on the pre-treated ITO substrates at 4500 rpm. Lastly, the spin-coated electrodes are dried in the oven at 100 °C for 15 h.
2.3 Photocatalytic activity measurements
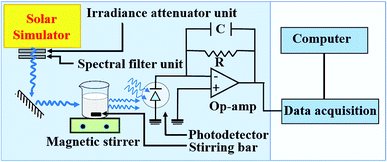
The photocatalytic degradation of methyl orange with Cr3+-doped BaTiO3 nanoparticles is carried out in a photochemical reactor using a calibrated solar simulator equipped with a 150 W xenon (Xe) lamp (Model-#SS50AAA, PET Photoemission Tech., Inc.). The setup is as illustrated in Fig. 1. The light intensity from the solar simulator is adjusted to 100 mW cm−2. In a typical test, 50 mg of the as-synthesized nanoparticles are dispersed in 50 mL of 20 mg L−1 methyl orange solution. The dispersed nanoparticles are magnetically stirred in the dark for 30 min in order to achieve adsorption–desorption equilibrium. The quartz photochemical reactor is placed under continuous stirring and illumination during the experiments. The residual concentration Ct of the dye molecules is determined by evaluating the photovoltage response from a photodetector placed directly behind the reactor. For consistency and reproducibility, the position of the photodetector remains unchanged throughout the experiment. The absorbance can be obtained from a logarithmic ratio of the photovoltages V0 and Vt, where V0 and Vt are the photovoltage responses at initial (C0) and residual (Ct) concentration, respectively.The role of different active species in the photocatalytic degradation of methyl orange with Cr3+-doped BaTiO3 nanoparticles are verified by investigating the effect of adding the following scavengers: benzoquinone (BQ), tert-butyl alcohol (TBA), and ethylene diaminetetraacetic acid (EDTA). Under similar experimental condition outlined, 0.5 mM BQ, 2 mM TBA, and 2 mM EDTA are introduced differently into a 50 mL capacity photochemical reactor to scavenge the following radicals; O2−˙, h+, and OH˙ respectively.
3 Results and discussion
3.1 Structural analysis
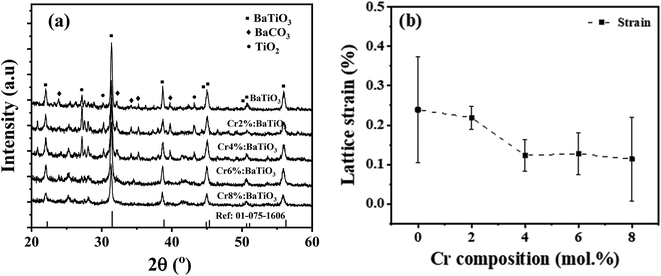
The structural properties of the samples are identified using XRD. Fig. 2a shows the XRD patterns of the as-synthesized samples with different chromium contents. The patterns show diffraction peaks that correspond to tetragonal BaTiO3 of P4mm space group (JCPDS # 01-075-1606).14,22 All the patterns present a secondary phase corresponding to BaCO3, in agreement with literature.14,25 One possible source of this phase comes from the high surface reactivity of BaTiO3 nanoparticles with dissolved CO2 resulting in carbonate formation. Due to high basicity of BaO, which constitutes 50% of the vicinal (100) surfaces, BaCO3 is formed on the surface of the nanoparticles through the formation of CO32− from dissolved CO2 species during synthesis.26While Cr doping may result in the presence of different ions with different radii: Cr2+ (0.80 Å), Cr3+ (0.615 Å), Cr4+ (0.55 Å), Cr5+ (0.49 Å) and Cr6+ (0.44 Å),27 the close ionic radii of Cr3+ and Ti4+ (0.62 Å) make this configuration the most favorable in the system. Since the incorporation of Cr3+ occurs through an aliovalent substitution, the charge compensation mechanism induces the formation of oxygen vacancies  . These oxygen vacancies
  being unstable, they get reduced into singly ionized oxygen vacancies
  according to
  .28,29 However, if the number of oxygen vacancies becomes too high, the BaTiO3 tetragonal structure becomes distorted and transforms into the hexagonal configuration. From the XRD patterns, no peak associated with the hexagonal phase is observed. This indicates that the distortion induced by oxygen vacancies can be accommodated by the tetragonal structure, an advantage of Cr doping over Fe, Co or Mn doping.30,31
To quantify the stability and degree of distortion of the TiO6/CrO6 octahedra, the Goldschmidt tolerance factor t32 is calculated according to
 | (1) |
Moreover, the different ionic radii of chromium and titanium result in strain in the crystal, which is evidenced by a broadening in the diffraction line profile of the host lattice. If this strain is sufficiently large, it can cause a CrO6/TiO6 octahedra tilting causing a structural phase transition. To determine the lattice strain, the XRD peaks are fitted with a Gaussian weighting function.14 The lattice strain ε is determined from33
 | (2) |
Fig. 2b shows the variation of the mean lattice strain thereby obtained as a function of Cr composition. It shows that the strain decreases monotonically with increasing Cr concentration, from 0.25% in the undoped material, down to ∼0.11% in the 8 mol% Cr3+-doped sample. One of the reasons for the observed trend may be likely due to increase in grain size as evidenced from the TEM. The strain may also stem from a shortened Cr–O bond length considering the next unit cell with CrO6 octahedron. These low values indicate that the strain is not high enough to induce a structural phase transition.34 Evidence of this tetragonal phase and absence of octahedra tilting is also provided by Raman scattering results.
3.2 Raman spectroscopy
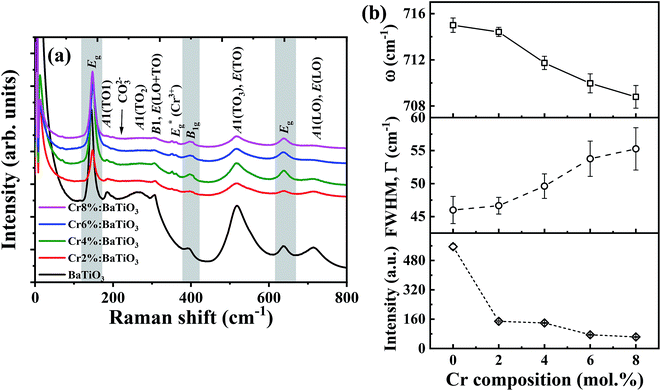
Raman spectroscopy is employed to further study the influence of Cr3+ on the lattice vibration and microstructural properties of the materials. The Raman active phonon modes of undoped and Cr3+-doped BaTiO3 nanoparticles with different Cr compositions are shown in Fig. 3a. Multiple Raman peaks are observed in the 0–800 cm−1 range at 185 cm−1, 264 cm−1, 310 cm−1, 518 cm−1 and 715 cm−1. These peaks corresponds to those reported for the tetragonal phase of BaTiO3.14,35,36 These spectra further confirm that the tetragonal phase remains the dominant phase in all samples. The acquired Raman spectra are deconvoluted into a series of Lorentzian-shaped peaks (Fig. S2†) from where the phonon frequency and FWHM of individual peaks are determined. The peaks centered around 185 cm−1 and 264 cm−1 are attributed to the E(TO) and A1(2TO) mode (stiffened components of the soft mode) respectively; the asymmetric broad peak at ∼518 cm−1 corresponds to the A1(3TO), E(TO) mode, while the sharp peak at ∼310 cm−1 and the broad peak at ∼715 cm−1 are attributed to the B1, E(LO + TO) and A1(LO). E(LO) modes, respectively. While the second order peaks at 270 cm−1 and 518 cm−1 persist in the cubic phase, the Raman peaks located at 310 cm−1 and 715 cm−1 are first order modes of the room temperature tetragonal BaTiO3 phase.13,14,35,37,38 In particular, the 310 cm−1 Raman mode represents the torsional vibration of Ti–O3 when the TiO6 octahedron undergoes an order-disorder transition.39By comparison of the spectra of the different samples, we observe a significant drop in intensity of 306 cm−1 and 713 cm−1 Raman peaks as the Cr3+ content increases. This suggests a gradual suppression of the tetragonality with increasing doping concentration. The decrease in Raman intensity of the 715 cm−1 phonon mode is accompanied by an increase in FWHM of the Raman line shape as shown in Fig. 3b. This indication of a shortened phonon lifetime is generally associated to defect-induced disorder that enhances interference effects between coupled modes.40,41 The two bands at 268 cm−1 and 518 cm−1 can still be observed with enhanced peak broadening indicating local Ti4+ ion disorder as the Cr3+ composition increased in BaTiO3 lattice.37
In addition, the presence of residual TiO2 from the fabrication is indicated by one strong intense peak at low frequency 144 cm−1 and two weak peaks at ∼396 cm−1 and ∼639 cm−1. These bands are assigned to the Eg, B1g and Eg modes of anatase TiO2, respectively.42 The peak at 226 cm−1, due to in-plane bending vibrations of the CO32− ion, denotes the presence of BaCO3 arising from the surface reactivity of CO2 with BaTiO3 phase35,43 in agreement with the XRD results. Finally, the phonon frequency at 354 cm−1 is due to Eg stretching vibration of Cr–O bonds in the structure.44,45 This further confirms that Cr3+ primarily substituted Ti4+ with evidence of local distortion in the vicinity of the CrO6 octahedron.
3.3 X-ray photoelectron spectroscopy
In order to understand the binding energies associated with the chemical states of different elements present in Cr3+-doped BaTiO3, XPS is performed on the undoped sample and on the 4 mol% Cr-doped BaTiO3. The general survey is shown in Fig. 4a. Peaks associated to Ba, O, Ti and Cr are measured. Ba 4d and Ba 4p peaks are also detected. The high-resolution scans for individual elements are shown in Fig. 4b–e. The most intense peak corresponding to Ba 3d5/2 is resolved at 778.28 eV and 780.34 eV for the undoped and (777.96 eV and 779.35 eV) for the 4 mol% Cr-doped sample, respectively (Fig. 4b). These peaks are typical of barium ions in the 2+ oxidation state.46 The addition of dopant causes an energy shift ΔE of 0.32 eV and 0.99 eV to the lower energy state in Ba 3d5/2 respectively. The O 1s peak (Fig. 4c) is also deconvoluted for proper identification. It is composed of two peaks located at 528.99 eV and 530.61 eV linked to oxygen bonded to BaTiO3 lattice and surface-adsorbed oxygen atoms.46 Three Gaussian peaks are used to fit the spectrum for the doped sample. The peak at 529.74 eV may likely be a surface adsorbed oxygen bonded to carbon (C–O) due to the presence of carbonate contaminant consistent with the XRD result. The Ti 2p core level showing the 2p3/2 and 2p1/2 states are shown in Fig. 4d. In the spectrum, the Ti 2p3/2 peak is more intense and narrower than the Ti 2p1/2 peak. The peaks at 457.75 eV and 463.68 eV are binding energies of tetravalent titanium in both states whereas those at 457.58 eV and 463.68 eV correspond to binding energies of reduced titanium (Ti3+) likely initiated by charge compensation mechanism due to defects. The fitted peaks at 457.75 eV and 463.35 eV show a spin–orbit splitting of 5.60 eV which is consistent with the reports of Södergren et al.47 The addition of Cr impurity increases the splitting orbital energy slightly to 5.78 eV with a blueshift of 0.04 eV and 0.37 eV for both peaks respectively.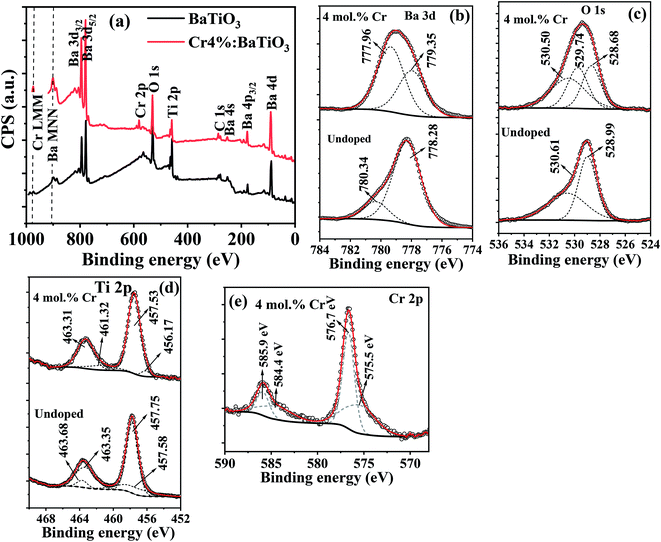 | ||
| Fig. 4 The XPS (a) survey spectra of undoped and 4 mol% Cr3+-doped BaTiO3 nanoparticles; high resolution scan of (b) Ba 3d (c) O 1s (d) Ti 2p and (e) Cr 2p. | ||
Fig. 4e depicts the spectrum of Cr 2p doublet, which is deconvoluted into four different peaks. The most intense peak for the Cr 2p3/2 and Cr 2p1/2 core levels at 576.7 eV and 585.9 eV confirms the presence of Cr3+ state, whereas those at 575.5 eV and 584.4 eV correspond to the tetravalent oxidation state of chromium.48,49 The fit results showing low peak area for the Cr4+ indicate that it manifests through charge compensation mechanism while the Cr3+ state remains the dominant species. In comparison to the Cr 2p1/2 peak, a splitting orbital energy of 9.20 eV is estimated relative to Cr 2p3/2. Based on these observations, the possibility of hexavalent metallic Cr (Cr6+) formation is excluded from the doped samples making our Cr3+-doped BaTiO3 more appropriate for wastewater purification. The report is in agreement with the XRD and Raman results.
3.4 TEM and energy dispersive X-ray spectroscopy (EDX)
The particle size distribution and microstructural properties of the Cr3+-doped BaTiO3 nanoparticles are investigated using TEM. Fig. 5a–e show the bright field TEM images of the undoped and Cr3+-doped BaTiO3 nanoparticles. The surface of the undoped sample is composed of partially aggregated, facetted particles with a high shape isotropy. The addition of chromium appears to promote a shape anisotropy towards rods, this however remains to be statistically consolidated. Beyond 4 mol% Cr concentration, it appears as if individual facets decrease in size, promoting surfaces with higher Miller indices that indicate a weakening of the crystalline bonds. Since the nanograins have different degrees of shape anisotropy, the estimation of the particle size has to take this into consideration. The insets of Fig. 5a–e give an estimate of the particle size distribution deduced from the TEM images. We can see that the particle size increases up to 79 ± 4 nm for the 4 mol% Cr composition before decreasing due to high concentration of chromium. At this point, we would like to point out that due to shape anisotropy of the nanoparticles, it is rather challenging to quantitatively estimate the overall particle size.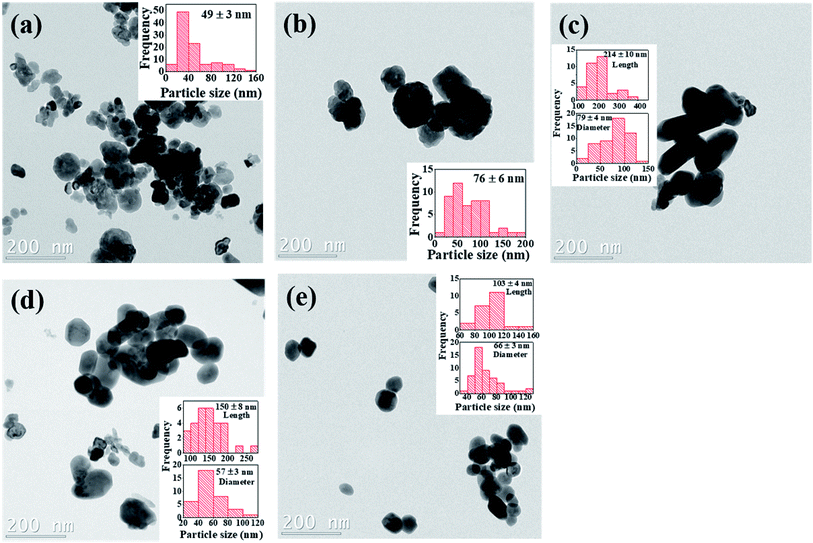 | ||
| Fig. 5 Bright field TEM images of (a) undoped (b) 2 mol% Cr (c) 4 mol% Cr (d) 6 mol% Cr and (e) 8 mol% Cr3+-doped BaTiO3 nanoparticles; insets are the corresponding particle size distribution. | ||
The elements present in the undoped and 4 mol% Cr3+-doped BaTiO3 samples are independently identified by energy dispersive X-ray (EDX) spectroscopy. Fig. S3† shows the elemental composition of the samples as analyzed by EDX. The peaks on the energy scale confirm the presence of Ba, Ti, O, and Cr in the system.
3.5 Optical absorption studies
For photocatalytic applications, light utilization is crucial as it determines the numbers of available photogenerated charge carriers that participate in the catalytic redox reaction. The energy band gap is an important intrinsic property that defines the intrinsic optical absorption of the material. Fig. 6a shows the optical absorption spectra of the samples. The intrinsic absorption is the same for all the samples and can be assigned to charge transfer of valence band electrons to conduction band. In the chromium-doped samples, an additional absorption band appears in the 420–480 nm spectral range. This is due to d–d band transitions between the high spin Cr3+ center and Ti4+ site resulting in a weak shoulder peak.50 The light induced excitation of Cr3+/4+ exchange-coupled pair is also possible due to multivalent state transitions in chromium.51 Furthermore, no other absorption was recorded in the far visible region. The apparent absorption threshold is extracted for these curves and presented in Fig. 6b. In the undoped sample, it is estimated to be near 390 nm. Upon the introduction of 2 mol% Cr, it redshifts to 458 nm. When the Cr content is further increased no significant shift is observed and the apparent absorption edge remains in the 458–475 nm range. The extracted cut-off wavelength dependence on Cr content follows a theoretical model as shown by the fit. Hence as long as the lattice is not completely changed and the unit cells remain within the limit of structural modifications, there is always a slight increment in absorption upon doping. Therefore, Cr3+ doping offers the possibility of modulating the light absorption properties as evidenced by the redshift of the absorption edge.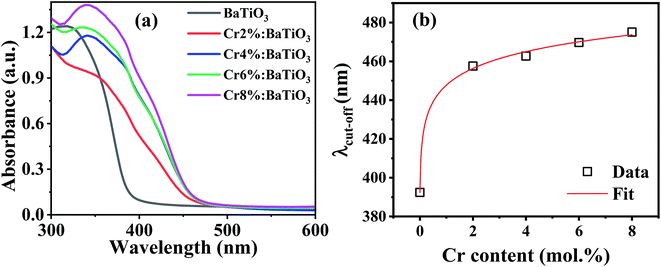 | ||
| Fig. 6 (a) Optical absorption spectra of the undoped and Cr3+-doped BaTiO3 samples, and (b) variation of apparent cut-off wavelength with Cr composition. | ||
3.6 Photoelectrochemical measurements
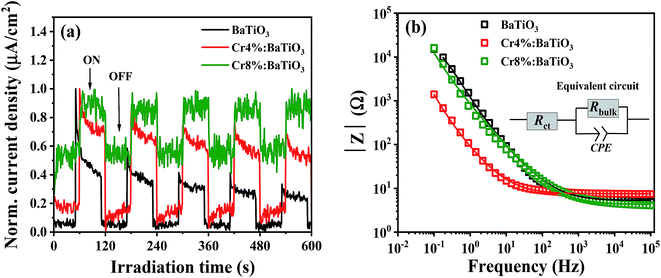
The degradation kinetics of a catalytic redox reaction is mainly determined by the charge transfer properties of the material. For this purpose, photoelectrochemical measurements are conducted to gain insight on the process of charge transfer. We examine the electrochemical behavior of the undoped, 4 mol% and 8 mol% Cr. Fig. 7a shows the time dependent photocurrent response of the 4 mol%, 8 mol% and undoped samples measured by chopped light amperometry (CLA) under simulated sunlight. In all the structures, the photocurrent profiles exhibit a photoresponse that decays over time. Also, the photocurrent density observed under homogenous illumination is low. Such a behavior is typical of ferroelectric crystals and is caused by poor bulk dc conduction, reflecting a low charge carrier mobility.52The electrochemical impedance spectroscopy investigates the interfacial charge transfer properties of the samples under standardized solar light irradiation. The variation of the absolute value of the impedance |Z| with frequency (Bode plots) for the three samples (4%, 8% and undoped) is presented in Fig. 7b. In the low frequency regime, it is observed that the impedance of doped samples decreases in comparison to that of the undoped sample. This feature indicates a low charge transfer resistance of the doped materials in electrolytic solution. Similar observation has been reported by Yu et al.53 which favors the photoactivity of methyl orange. In order to extract the charge transfer resistance of these materials, a Z view software is used for the complex non-linear least-squares regression. The equivalent circuit comprises of charge transfer resistance (Rct) which is in series with a parallel connection of bulk resistance, (Rbulk) and a constant phase element (CPE) as depicted in the inset of Fig. 7b. The electrochemical impedance (Rct) obtained from the regression analysis shows a decrease from 5.2 ± 0.2 Ω to 4.3 ± 0.03 Ω for the samples. This suggests that the kinetics of the electron transfer is faster in the doped nanostructures, an asset for photocatalysis.
3.7 Photocatalytic activity
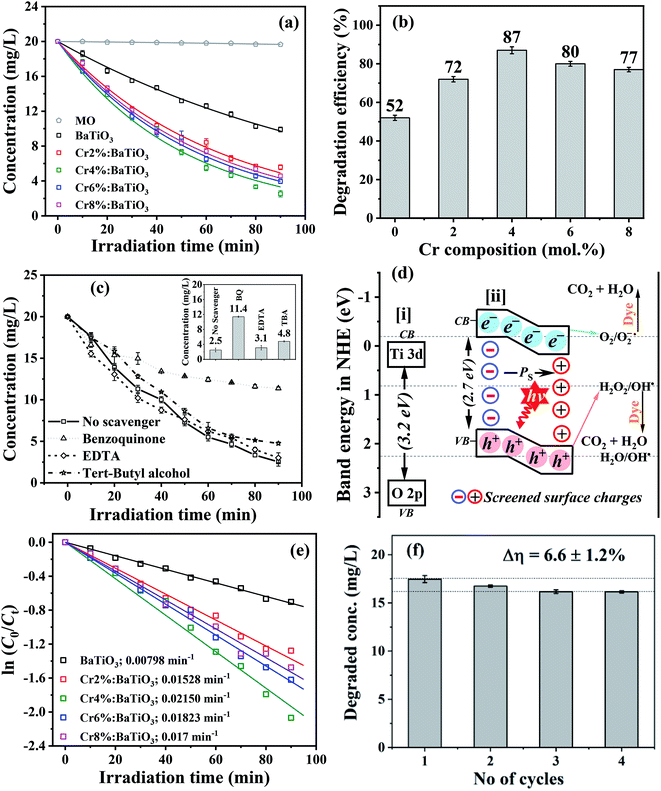
The photocatalytic performance of photoferroic Cr3+-doped BaTiO3 nanoparticles is evaluated by investigating the photodegradation of methyl orange, a common pollutant.54 The time dependent adsorption as well as photodegradation of the organic pollutant by undoped and Cr3+-doped BaTiO3 samples with different molar concentrations of Cr in the dark and under simulated light irradiation is shown in Fig. S4† and 8a respectively. From the plot (Fig. S4†), the adsorption capacities show that the 4 mol% Cr doped sample provides an efficient adsorption due to the aspect ratio offered by a composition of geometries as observed in the morphology. The photo-oxidation of methyl orange under simulated light irradiation without photocatalyst is included as a reference (MO), and does not depict any significant changes over time. This demonstrates that neither photolysis of the methyl orange solution nor contribution of chromium oxide to redox reaction is observed. As photodegradation follows the Beer–Lambert model, all the plots are fitted exponentially. The doped samples show a higher visible light photocatalytic activity than the undoped BaTiO3 due to an enhanced light harvest, as depicted in Fig. 8b. The difference in degradation efficiency between the undoped and doped materials could be due either to the higher absorption cross-section offered by Cr3+ doping, or to the BPVE. Since, the absorption cross-section is extended by a few tens of nanometer, the dominant factor responsible for this increase is attributed to BPVE driven enhanced charge carrier separation. After 90 min of visible light irradiation, the photodegradation efficiency of methyl orange is 52% for undoped BaTiO3 while 72, 87, 80 and 77% are observed for the 2 mol% Cr, 4 mol% Cr, 6 mol% Cr and 8 mol% Cr, respectively. The best photocatalytic performance is therefore achieved with the 4 mol% Cr-doped BaTiO3 and compares well with degradation efficiencies reported in literature (Table S1†). In particular, the presence of asymmetric velocities of charge carriers in the potential of these tetragonal materials makes the difference when compared to the same material for catalytic reduction of nitrobenzene to aniline with a yield of 98.2% in 6 h (i.e. 63.4%, recalculated to 90 min).10Furthermore, the dominant reactive species present during the photocatalytic degradation are explored using BQ, TBA, and EDTA as scavengers for the following radicals; O2−˙, h+, and OH˙ respectively. With the 4 mol% Cr3+-doped BaTiO3 nanoparticles exhibiting the best photocatalytic performance, the irradiation time-dependent photocatalytic degradation (Ct/C0) of methyl orange with and without scavengers are investigated and results are displayed in Fig. 8c. It is observed that 43% of the methyl orange is degraded after 90 min when BQ is added to the system. This demonstrates the inhibiting role of BQ in degrading the organic dye in comparison to the efficiency obtained in the absence of the scavenger. When TBA is added, the kinetics slows down slightly, yielding a degradation efficiency of 76% after 90 min. On the other hand, a recovery of degradation time (∼2 min) is recorded when EDTA is added to the system. Hence, at 80 min of light exposure, the concentration decreased to 3.9 ± 0.25 mg L−1 representing ∼80% degradation efficiency. It suggests an enhanced kinetics through a reduced trapping of holes, which would otherwise cause recombination of charge carriers. In general, the results show the dominance of O2−˙ in the degradation of methyl orange when the photoferroic nanoparticles are illuminated. A further account of the photocatalytic degradation pathway being initiated by majorly a reaction between streams of photoelectrons and surface adsorbed oxygen is discussed next.
To better understand the photocatalytic process, the potential of the photogenerated redox species is investigated using the band alignment or offset of the semiconductor material. The conduction band potential is calculated from the following equation,55
| ECB = χ − Ee − 0.5Eg | (3) |
The kinetics of photodegradation depend on various competing processes such as absorption of photons and excitation of the photogenerated charge carriers, separation and transport of photoexcited charge carriers and surface redox reactions.56,57 The rate of photo-oxidation of methyl orange is examined by plotting ln(C0/Ct) as a function of time, as shown in Fig. 8e. For all the samples, a linear behavior is observed, denoting a pseudo first-order kinetics for the liquid phase heterogeneous photocatalysis.5 The slope corresponds to the observed apparent reaction rate constant, kobs and a value of 0.0215 min−1 is estimated for the 4 mol% Cr3+-doped BaTiO3 nanoparticles, which is 2.7 times higher than that of the undoped sample (0.00798 min−1).
For environmental applications, the photostability test is very important. Furthermore, this stability test excludes the possibility of “dye-sensitized” photoinduced oxidative degradation.58,59 To investigate this, four series of controlled experimental reactions are conducted on the 4 mol% Cr3+-doped BaTiO3 sample, chosen for its high degradation efficiency. At the end of each reaction, the photocatalyst is recovered by: (i) decanting the used organic solution (ii) washing repeatedly in distilled water to remove adsorbed species of organic molecules, and (iii) drying in an oven at 80 °C. As observed in Fig. 8f, the degradation efficiency decreased by ∼6.6 ± 1.2% after the fourth cycle of simulated sunlight illumination. This deviation could be explained in terms of two factors: (i) instability, and (ii) slight loss of mass of the photocatalyst. Since the Raman features of the sample exist without apparent distortion (Fig. S5†), the latter is therefore expected to be the dominant factor.60 This shows that the structural properties remain unchanged and thus Cr3+-doped BaTiO3 nanoparticles exhibit a good photocatalytic performance of up to the fourth cycle.
4 Conclusion
In summary, we describe the successful synthesis of photoferroic Cr3+-doped BaTiO3 nanoparticles by MWHT. The addition of mineralizer, H2O2 is used to control the process-related leakage current by scavenging the precipitated H+/metal ions, making the materials suitable for photocatalytic applications due to the presence of screened surface charges. Both results of XRD and Raman scattering confirm a lattice distortion and a ferroelectric ordering in the non-centrosymmetric BaTiO3 phase. The photoresponse of the host lattice is extended into the visible region up to λcut-off = 480 nm due to the d–d band transition of chromium. Moreover, XPS results show that the chromium exists in trivalent oxidation state while its presence slightly alters the binding energy of the host lattice.We show that the photocatalytic activity, already enhanced with respect to that of BaTiO3 due to the presence of the bulk photovoltaic effect, is further enhanced by the introduction of Cr up to 4 mol%. The latter is mainly attributed to an additional broad absorption band in the visible range. The best photoactivity is obtained with the 4 mol% Cr3+-doped BaTiO3, and remains stable up to the fourth cycle of irradiation. O2−˙ is perceived as the dominant active species from the in situ ROS capture experiments.
Conflicts of interest
There are no conflicts to declare.Acknowledgements
I. C. A. is thankful for the financial support through MATECSS Excellence scholarship. S. S. and A. R. are grateful for the NSERC discovery (RGPIN-2014-05024) and NSERC strategic partnership grants (506289-2017; 506953-17) respectively.References
- T. A. Kurniawan, L. Yanyan, T. Ouyang, A. B. Albadarin and G. Walker, Mater. Sci. Semicond. Process., 2018, 73, 42–50 CrossRef CAS.
- M. S. Mauter, I. Zucker, F. o. Perreault, J. R. Werber, J.-H. Kim and M. Elimelech, Nat. Sustain., 2018, 1, 166–175 CrossRef.
- R. Su, Y. Shen, L. Li, D. Zhang, G. Yang, C. Gao and Y. Yang, Small, 2015, 11, 202–207 CrossRef CAS PubMed.
- S. J. A. Moniz, S. A. Shevlin, D. J. Martin, Z.-X. Guo and J. Tang, Energy Environ. Sci., 2015, 8, 731–759 RSC.
- O. Carp, C. L. Huisman and A. Reller, Prog. Solid State Chem., 2004, 32, 33–177 CrossRef CAS.
- J. Cao, Y. Ji, C. Tian and Z. Yi, J. Alloys Compd., 2014, 615, 243–248 CrossRef CAS.
- N. V. Dang, T. D. Thanh, L. V. Hong, V. D. Lam and T.-L. Phan, J. Appl. Phys., 2011, 110, 043914 CrossRef.
- Y. Guo, T. Guo, J. Chen, J. Wei, L. Bai, X. Ye, Z. Ding, W. Xu and Z. Zhou, Catal. Sci. Technol., 2018, 8, 4108–4121 RSC.
- J. Zhu, Z. Deng, F. Chen, J. Zhang, H. Chen, M. Anpo, J. Huang and L. Zhang, Appl. Catal., B, 2006, 62, 329–335 CrossRef CAS.
- C. Srilakshmi, R. Saraf, V. Prashanth, G. M. Rao and C. Shivakumara, Inorg. Chem., 2016, 55, 4795–4805 CrossRef CAS PubMed.
- A. S. Bhalla, R. Guo and R. Roy, Mater. Res. Innovations, 2000, 4, 3–26 CrossRef CAS.
- M. A. Pena and J. L. G. Fierro, Chem. Rev., 2001, 101, 1981–2017 CrossRef CAS.
- H.-W. Lee, S. Moon, C.-H. Choi, D. K. Kim and S. J. Kang, J. Am. Ceram. Soc., 2012, 95, 2429–2434 CrossRef CAS.
- V. P. Pavlovic, M. V. Nikolic, V. B. Pavlovic, J. Blanusa, S. Stevanovic, V. V. Mitic, M. Scepanovic, B. Vlahovic and M. Hoffman, J. Am. Ceram. Soc., 2014, 97, 601–608 CrossRef CAS.
- S. Nayak, B. Sahoo, T. K. Chaki and D. Khastgir, RSC Adv., 2014, 4, 1212–1224 RSC.
- F. Li, M. Zeng, H. Yu, H. Xu and J. Li, J. Mater. Sci.: Mater. Electron., 2015, 27, 2836–2840 CrossRef.
- K. T. Butler, J. M. Frost and A. Walsh, Energy Environ. Sci., 2015, 8, 838–848 RSC.
- L. Zhang, O. P. Thakur, A. Feteira, G. M. Keith, A. G. Mould, D. C. Sinclair and A. R. West, Appl. Phys. Lett., 2007, 90, 142914 CrossRef.
- S. Anwar, P. R. Sagdeo and N. P. Lalla, J. Phys.: Condens. Matter, 2006, 18, 3455–3468 CrossRef CAS.
- B. Jiang, T. Grande and S. M. Selbach, Chem. Mater., 2017, 29, 4244–4252 CrossRef CAS.
- L. Gomathi Devi and P. M. Nithya, Inorg. Chem. Front., 2018, 5, 127–138 RSC.
- R. Li, Q. Li, L. Zong, X. Wang and J. Yang, Electrochim. Acta, 2013, 91, 30–35 CrossRef CAS.
- J. Rouxel and M. Toumoux, Solid State Ionics, 1996, 84, 141–149 CrossRef CAS.
- R. J. Darton, S. S. Turner, J. Sloan, M. R. Lees and R. I. Walton, Cryst. Growth Des., 2010, 10, 3819–3823 CrossRef CAS.
- Y. Shiratori, C. Pithan, J. Dornseiffer and R. Waser, J. Raman Spectrosc., 2007, 38, 1288–1299 CrossRef CAS.
- H.-J. Freund and M. W. Roberts, Surf. Sci. Rep., 1996, 25, 225–273 CrossRef.
- R. D. Shannon, Acta Crystallogr., Sect. A: Cryst. Phys., Diffr., Theor. Gen. Crystallogr, 1976, 32, 751–767 CrossRef.
- R. Moos, A. Gnudi and K. H. Härdtl, J. Appl. Phys., 1995, 78, 5042–5047 CrossRef CAS.
- O. M. Parkash, D. Kumar and C. C. Christopher, J. Chem. Sci., 2003, 115, 649–661 CrossRef CAS.
- G. M. Keith, M. J. Rampling, K. Sarma, N. M. Alford and D. C. Sinclair, J. Eur. Ceram. Soc., 2004, 24, 1721–1724 CrossRef CAS.
- G. M. Osoro, D. Bregiroux, M. P. Thi and F. Levassort, Mater. Lett., 2016, 166, 259–262 CrossRef CAS.
- V. M. Goldschmidt, Naturwissenschaften, 1926, 14, 477–485 CrossRef CAS.
- G. K. Williamson and W. H. Hall, Acta Metall., 1953, 1, 22–31 CrossRef CAS.
- K. Brajesh, A. K. Kalyani and R. Ranjan, Appl. Phys. Lett., 2015, 106, 012907 CrossRef.
- F. A. Rabuffetti and R. L. Brutchey, J. Am. Chem. Soc., 2012, 134, 9475–9487 CrossRef CAS.
- S. Wada, T. Suzuki and T. Noma, Jpn. J. Appl. Phys., 1995, 34, 5368–5379 CrossRef CAS.
- R. Asiaie, W. Zhu, S. A. Akbar and P. K. Dutta, Chem. Mater., 1996, 8, 226–234 CrossRef CAS.
- R.-j. Li, W.-x. Wei, J.-l. Hai, L.-x. Gao, Z.-w. Gao and Y.-y. Fan, J. Alloys Compd., 2013, 574, 212–216 CrossRef CAS.
- G. Pezzotti, J. Appl. Phys., 2013, 113, 211301 CrossRef.
- Y.-S. Seo, J. S. Ahn and I.-K. Jeong, J. Korean Phys. Soc., 2013, 62, 749–755 CrossRef CAS.
- A. K. Sood, N. Chandrabhas, D. V. S. Muthu and A. Jayaraman, Phys. Rev. B: Condens. Matter Mater. Phys., 1995, 51, 8892–8896 CrossRef CAS.
- K.-R. Zhu, M.-S. Zhang, Q. Chen and Z. Yin, Phys. Lett. A, 2005, 340, 220–227 CrossRef CAS.
- P. Pasierb, S. Komornicki, M. Rokita and M. Rekas, J. Mol. Struct., 2001, 596, 151–156 CrossRef CAS.
- S.-H. Shim, T. S. Duffy, R. Jeanloz, C.-S. Yoo and V. Iota, Phys. Rev. B: Condens. Matter Mater. Phys., 2004, 69, 144107–144112 CrossRef.
- C. Peter, J. Kneer, K. Schmitt, A. Eberhardt and J. Wöllenstein, Phys. Status Solidi A, 2013, 210, 403–407 CrossRef CAS.
- C. Miot, E. Husson, C. Proust, R. Erre and J. P. Coutures, J. Eur. Ceram. Soc., 1998, 18, 339–343 CrossRef CAS.
- S. Sodergren, H. Siegbahn, H. k. Rensmo, H. Lindstrom, A. Hagfeldt and S.-E. Lindquist, J. Phys. Chem. B, 1997, 101, 3087–3090 CrossRef.
- M. C. Biesinger, B. P. Payne, A. P. Grosvenor, L. W. M. Lau, A. R. Gerson and R. S. C. Smart, Appl. Surf. Sci., 2011, 257, 2717–2730 CrossRef CAS.
- I. Ikemoto, K. Ishii, S. Kinoshita, H. Kuroda, M. A. Alario Franco and J. M. Thomas, J. Solid State Chem., 1976, 17, 425–430 CrossRef CAS.
- H. T. Langhammer, T. Müller, R. Böttcher and H. P. Abicht, J. Phys.: Condens. Matter, 2008, 20, 085206 CrossRef.
- S. Eden, S. Kapphan, H. Hesse, V. Trepakov, V. Vikhnin, I. Gregora, L. Jastrabik and J. Seglins, J. Phys.: Condens. Matter, 1998, 10, 10775–10786 CrossRef CAS.
- V. M. Fridkin, Crystallogr. Rep., 2001, 46, 654–658 CrossRef.
- L. Yu, C. Wang, F. Chen, J. Zhang, Y. Ruan and J. Xu, J. Mol. Catal. A: Chem., 2016, 411, 1–8 CrossRef CAS.
- M. Z. Si, Y. P. Kang and Z. G. Zhang, Appl. Surf. Sci., 2009, 255, 6007–6010 CrossRef CAS.
- B. Chai, T. Peng, P. Zeng and X. Zhang, Dalton Trans., 2012, 41, 1179–1186 RSC.
- M. Nakamura, S. Horiuchi, F. Kagawa, N. Ogawa, T. Kurumaji, Y. Tokura and M. Kawasaki, Nat. Commun., 2017, 8, 281 CrossRef CAS.
- C. Paillard, X. Bai, I. C. Infante, M. Guennou, G. Geneste, M. Alexe, J. Kreisel and B. Dkhil, Adv. Mater., 2016, 28, 5153–5168 CrossRef CAS PubMed.
- F. Niu, D. Chen, L. Qin, N. Zhang, J. Wang, Z. Chen and Y. Huang, ChemCatChem, 2015, 7, 3279–3289 CrossRef CAS.
- B. Ohtani, J. Photochem. Photobiol., C, 2010, 11, 157–178 CrossRef CAS.
- H. Huang, Y. He, X. Li, M. Li, C. Zeng, F. Dong, X. Du, T. Zhang and Y. Zhang, J. Mater. Chem. A, 2015, 3, 24547–24556 RSC.
- R. G. Pearson, Inorg. Chem., 1988, 27, 734–740 CrossRef CAS.
Footnote |
| † Electronic supplementary information (ESI) available. See DOI: 10.1039/c9ra03439k |
| This journal is © The Royal Society of Chemistry 2019 |

