
 Open Access Article
 This Open Access Article is licensed under a Creative Commons Attribution-Non Commercial 3.0 Unported Licence
Pressure-induced phase transition of La2Zr2O7 and La0.5Gd1.5Zr2O7 pyrochlore†
Jingjing Niu *ac,
Xiang Wub,
Haibin Zhangc and
Shan Qina
*ac,
Xiang Wub,
Haibin Zhangc and
Shan Qina
aKey Laboratory of Orogenic Belts and Crustal Evolution, School of Earth and Space Sciences, MOE, Peking University, Beijing 100871, P. R. China. E-mail: sessnjj@pku.edu.cn
bState Key Laboratory of Geological Processes and Mineral Resources, China University of Geosciences (Wuhan), 430074, P. R. China
cInnovation Research Team for Advanced Ceramics, Institute of Nuclear Physics and Chemistry, China Academy of Engineering Physics, Mianyang, 621900, China
First published on 17th June 2019
Abstract
In situ high-pressure experiments on La2Zr2O7 and La0.5Gd1.5Zr2O7 have been carried out at up to approximately 40 GPa using synchrotron X-ray diffraction and Raman spectroscopy combined with a diamond anvil cell technique. Both La2Zr2O7 and La0.5Gd1.5Zr2O7 undergo a phase transition from a pyrochlore phase (Fd![[3 with combining macron]](https://www.rsc.org/images/entities/char_0033_0304.gif) m) into a cotunnite-like phase (Pnma) at 22.7 and 23.3 GPa, respectively. This type of phase transition is mainly controlled through the order-disorder occupancy of cations, and Gd3+ substitution of La3+ reduces the stability of zirconate pyrochlore. However, abnormal changes to the unit-cell volumes and vibrational modes observed at 5.5 GPa in La2Zr2O7 and 6.5 GPa in La0.5Gd1.5Zr2O7 are attributed to an anion disorder in the pyrochlore.
m) into a cotunnite-like phase (Pnma) at 22.7 and 23.3 GPa, respectively. This type of phase transition is mainly controlled through the order-disorder occupancy of cations, and Gd3+ substitution of La3+ reduces the stability of zirconate pyrochlore. However, abnormal changes to the unit-cell volumes and vibrational modes observed at 5.5 GPa in La2Zr2O7 and 6.5 GPa in La0.5Gd1.5Zr2O7 are attributed to an anion disorder in the pyrochlore.
1. Introduction
Rare-earth pyrochlore oxides have been extensively studied and widely applied in many different areas, such as catalysis,1–3 fuel cells,4,5 thermal-barrier coatings,6,7 spin liquids,8 and the encapsulation of actinide-rich nuclear waste,9 owing to their various physical and chemical properties. The pyrochlore structure (A2B2O6O′ or A2B2O7), which belongs to Fdm and Z = 8, can be viewed as A and B cations in an ordered 2 × 2 × 2 fluorite (Fmm and Z = 2) superlattice structure, with a 1/8 anion deficiency. The pyrochlore structure can be described with different selections of origin. In this paper, the larger A cations occupy 16d (1/2 1/2 1/2) with eight coordinates located in a distorted cubic polyhedron. The six-coordinate B site located at 16c (0 0 0) is usually occupied by smaller cations centered in an oxygen octahedron. The oxygen O2− anions occupy the 48f (x 1/8 1/8) site, whereas the O′2− anions occupy the 8b (3/8 3/8 3/8) site, and the 8a site is systematically vacant.10 A pyrochlore oxide structure can be viewed as two interpenetrating networks: the first is a corner-shared [BO6] octahedron network and the second is an A2O network similar to an anti cristobalite Cu2O network (Fig. 1a).
 | ||
| Fig. 1 (a) Crystal structure of A2B2O7 pyrochlore oxides, where the purple balls are A3+, the red small balls are O2−, the blue cornered-linked octahedrons are [BO6], and the red tetrahedrons are [OA4]. (b) Cotunnite-like structure of A2B2O7, where the A3+ and B4+ cations are disordered, and 1/8 of O2− are randomly vacant as compared with the cotunnite structure of AX2. | ||
An empirical rule demonstrating that, under ambient conditions, A2B2O7 will crystallize into a pyrochlore structure when the average cationic radii ratio rA/rB satisfies 1.46 < rA/rB < 1.80,11 which indicates the structural flexibility and composition variety of pyrochlore oxides. If rA/rB < 1.46, which indicates that the difference in radii of A3+ and B4+ is small, A2B2O7 crystallizes in a defected fluorite structure (Fmm). Otherwise, when rA/rB > 1.80, a monoclinic perovskite-like structure (P21) will have more stability under ambient conditions.
In addition to crystallography and other basic studies, the high-pressure behavior of pyrochlore oxides is important to the immobilization of toxic radioactive waste. In the safe immobilization of high-level waste (HLW), toxic actinides are substituted into the lattice and isolated from the biosphere for over 10![[thin space (1/6-em)]](https://www.rsc.org/images/entities/char_2009.gif) 000 years underground at a depth of ∼1000 m. A collapse, explosion, and geological changes occurring during isolation may create high pressure on the HLW waste forms, which are enclosed in the disposal repository. As an important thermodynamic parameter, the pressure can strongly affect the structures and properties of the materials, indicating that the high-pressure structure and properties of the substituted pyrochlore oxides are important to high-level waste disposal. Zirconate pyrochlore ceramics are of particular interest because they are resistant to radiation-induced amorphization from the damage arising from the decay of the incorporated actinides.12,13 Theoretical research has revealed that zirconate pyrochlore (B = Zr4+) and titanite pyrochlore (B = Ti4+) oxides will transfer to an orthorhombic cotunnite-like structure under high pressure (Fig. 1b) (Pnma space group, Z = 4).14–16 The transition pressure of most zirconate pyrochlores is 15–25 GPa, whereas that of titanite pyrochlores is mostly over ∼30 GPa. In general, the incorporation of large radius ions may decrease the phase stability under pressure. An actinide substitution will increase the average cationic radius and affect the structure and properties of pyrochlore oxides. So in the present study, we conducted a comparative study of La2Zr2O7 and La0.5Gd1.5Zr2O7 pyrochlores at up to approximately 40 GPa to explore the influence on the phase stability and compression behavior under a Gd3+ substitute. In this manuscript, high pressure phase stability and compression behavior of the two samples are provided. The annealing temperature has an effect on the high-pressure stability and compression behavior,17,18 and in our study, the sample preparation process is carefully controlled.
000 years underground at a depth of ∼1000 m. A collapse, explosion, and geological changes occurring during isolation may create high pressure on the HLW waste forms, which are enclosed in the disposal repository. As an important thermodynamic parameter, the pressure can strongly affect the structures and properties of the materials, indicating that the high-pressure structure and properties of the substituted pyrochlore oxides are important to high-level waste disposal. Zirconate pyrochlore ceramics are of particular interest because they are resistant to radiation-induced amorphization from the damage arising from the decay of the incorporated actinides.12,13 Theoretical research has revealed that zirconate pyrochlore (B = Zr4+) and titanite pyrochlore (B = Ti4+) oxides will transfer to an orthorhombic cotunnite-like structure under high pressure (Fig. 1b) (Pnma space group, Z = 4).14–16 The transition pressure of most zirconate pyrochlores is 15–25 GPa, whereas that of titanite pyrochlores is mostly over ∼30 GPa. In general, the incorporation of large radius ions may decrease the phase stability under pressure. An actinide substitution will increase the average cationic radius and affect the structure and properties of pyrochlore oxides. So in the present study, we conducted a comparative study of La2Zr2O7 and La0.5Gd1.5Zr2O7 pyrochlores at up to approximately 40 GPa to explore the influence on the phase stability and compression behavior under a Gd3+ substitute. In this manuscript, high pressure phase stability and compression behavior of the two samples are provided. The annealing temperature has an effect on the high-pressure stability and compression behavior,17,18 and in our study, the sample preparation process is carefully controlled.
2. Experiment details
The sample in the present study was synthesized using a combustion method. The starting materials n-propyl zirconate [Zr(C12H28O4)] (Aladdin, 70 wt% in n-propanol), Gd(NO3)3·6H2O (Aladdin, 99.9%), and La(NO3)3·6H2O (Aladdin, 99.9%) were dissolved stoichiometrically in nitric acid and deionized water, respectively, with magnetic stirring. The solutions were mixed together. Glycine (Aladdin, 99%) as a fuel with a mole ratio n(Gly)/n(Zr) = 2.8 was added in the mixed solution. This mixture was heated on a hot plate until auto-ignition was reached in a corundum crucible. The solid obtained was annealed at 1773 K for 3 h in an air atmosphere. XRD under ambient conditions using Mo Kα (λ = 0.7093 Å) confirmed that both samples were in a single pyrochlore phase. The unit cell parameters (a-axial length a) of La2Zr2O7 and La0.5Gd1.5Zr2O7 are 10.7949(3) Å and 10.5762(3) Å, respectively, which are in good agreement with the previous reports.19In in situ synchrotron X-ray diffraction experiments, symmetry-type diamond anvil cells (DACs) were employed as a high-pressure apparatus. This was carried out by applying a focused monochromatic beam of λ = 0.6199 Å using a 4W2 beamline at the Beijing Synchrotron Radiation Facility. Rhenium gaskets were pre-indented as sample chambers to ∼40 μm in thickness with a hole ∼150 μm in diameter at the center of the indentation. The samples were compressed into thin slices using a couple of WC anvils and were loaded into the sample chambers. The pressure transmitting medium (PTM) was silicone oil and the pressure was monitored using the ruby fluorescence method.20 Uncertainties in pressure are <1 GPa for pressures of below 40 GPa and ∼2 GPa for pressures above 40 GPa. All XRD spectra were converted from Debye rings into one-dimensional X-ray profiles versus 2θ using the FIT2D code.21 The high-pressure XRD patterns were fitted using the Le Bail method implemented with GSAS+EXPGUI software.22
An in situ high-pressure Raman experiment was carried out at room temperature on a Renishaw inVia reflex laser Raman spectrometer. A 532 nm diode-pumped solid-state laser was employed as the excitation light source. The spectra were calibrated using a silicon wafer, and the scattered light was collected in backscattering geometry using a charge-coupled device detector with a resolution of 1 cm−1. Two samples, La2Zr2O7 and La0.5Gd1.5Zr2O7, were compressed into slices and placed into one single 150 μm diameter hole drilled in pre-indented Rhenium gaskets to avoid differences in the sample loading conditions in the diamond anvil cell. The ruby fluorescence technique was employed to calibrate the pressure.20 The noble gas argon was used as the pressure transmitting medium (PTM). The Raman spectra were fitted using pseudo-Voigt functions to determine the peak position.
3. Results
The in situ high-pressure XRD data of La2Zr2O7 and La0.5Gd1.5Zr2O7 were collected at up to ∼40 GPa, selected XRD patterns of which are shown in Fig. 2. At the beginning of the experiments, all reflections of La2Zr2O7 and La0.5Gd1.5Zr2O7 can be indexed to the Fdm space group. With an increase in pressure, all diffraction peaks shift to a higher 2θ angle owing to the contraction of the lattice. At below ∼20 GPa, the Le Bail refinement using the Fdm space group can account for nearly all of the intense reflections observed.
 | ||
| Fig. 2 In situ high-pressure XRD pattern of (a) La2Zr2O7 and (b) La0.5Gd1.5Zr2O7. The enlargement of patterns from ∼21 to 28 GPa within a 2θ range of 12.4–13.1° shows new reflections arising at 22.7 GPa in La2Zr2O7 and at 23.3 GPa in La0.5Gd1.5Zr2O7, indicating the formation of a high-pressure phase. | ||
La2Zr2O7 and La0.5Gd1.5Zr2O7 underwent a pressure-induced phase transition at above 22 GPa. The onset of the high-pressure stable phase is identified by a new reflection arising between the (222) and (400) reflections of pyrochlore,17,23 and the high-pressure phase is a Pnma cotunnite-like phase. The onset of the high-pressure phase is approximately equivalent for both La2Zr2O7 and La0.5Gd1.5Zr2O7 (22.7 and 23.3 GPa, respectively). The transition is sluggish and both structures co-exist until reaching the highest pressure. The diffraction data collected upon quenching to the ambient condition are difficult to identify in the phase.
According to group theory, pyrochlore structure oxides have six Raman active modes, namely,
| Γ = A1g + Eg + 4F2g | (1) |
In situ high-pressure Raman spectra of La2Zr2O7 and La0.5Gd1.5Zr2O7 recorded from 150 to 800 cm−1 at various pressures in run 1 are shown in Fig. 3. At the beginning of the experiment, comparing with previous studies,24–26 five Raman modes of the pyrochlore phase can be identified in both La2Zr2O7 and La0.5Gd1.5Zr2O7. In La2Zr2O7, the band at ∼300 cm−1 is made up of two Raman modes: one intense Eg mode associated with O–Zr–O bending in [ZrO6] octahedrons and demonstrating M1, and a weak F2g mode associated with La–O′ stretching demonstrating M2. M3 at ∼380 cm−1 is an F2g mode associated with the vibrations of oxygen anions (O–O′), and M4 at ∼500 cm−1 is another F2g mode and is associated with Zr–O stretching. The band at ∼515 cm−1 is an A1g mode and is associated with La–O stretching. In La0.5Gd1.5Zr2O7, M1′ + M2′ are Eg + F2g modes similar to those of La2Zr2O7, M3′ at ∼400 cm−1 and M5′ at ∼600 cm−1 are two F2g modes associated with Zr–O and R–O stretching vibrations, and M4′ at ∼550 cm−1 is A1g mode associated with R–O stretching. The Raman spectra of La2Zr2O7 have sharper and better-defined peaks than those of La0.5Gd1.5Zr2O7. All Raman bands shift to higher frequencies with an increase in pressure. At above 24.9 GPa, new Raman bands (marked using the diamonds in Fig. 3a and b) are shown in both La2Zr2O7 and La0.5Gd1.5Zr2O7. These new bands belong to the vibrations from the cotunnite-like phase, and the identified transition induced by the pressure begins at ∼24.9 GPa, which is slightly higher than the in situ high-pressure XRD results. With a further increase in pressure, the intensity of the M1 peak of both samples decreases. At above 41.8 GPa, the M1 peak in La2Zr2O7 disappears, whereas in La0.5Gd1.5Zr2O7 the peak pressure disappears at 38.3 GPa, which indicates that the transitions are complete. Thus, the pyrochlore-to-cotunnite-like transition ends at 41.8 and 38.3 GPa in La2Zr2O7 and La0.5Gd1.5Zr2O7, respectively. The transition end pressure here is denoted as Pe. The spectrum of La2Zr2O7 and La0.5Gd1.5Zr2O7 recovered from ∼44 GPa has a significantly different characteristic from the cotunnite-like phase. A previous study24 showed that La2Zr2O7 will transfer into a defected fluorite structure from a cotunnite-like structure as the pressure is released. The Raman spectrum recovered from the highest pressure in La2Zr2O7 shows a mixture of a high-pressure phase and a defected-fluorite phase, and thus the transition in La2Zr2O7 is irreversible. However, the spectrum of La0.5Gd1.5Zr2O7 recovered from the highest pressure is quite similar to the starting pyrochlore structure, which means that La0.5Gd1.5Zr2O7 will recover to a pyrochlore structure during quenching, which is reversible.
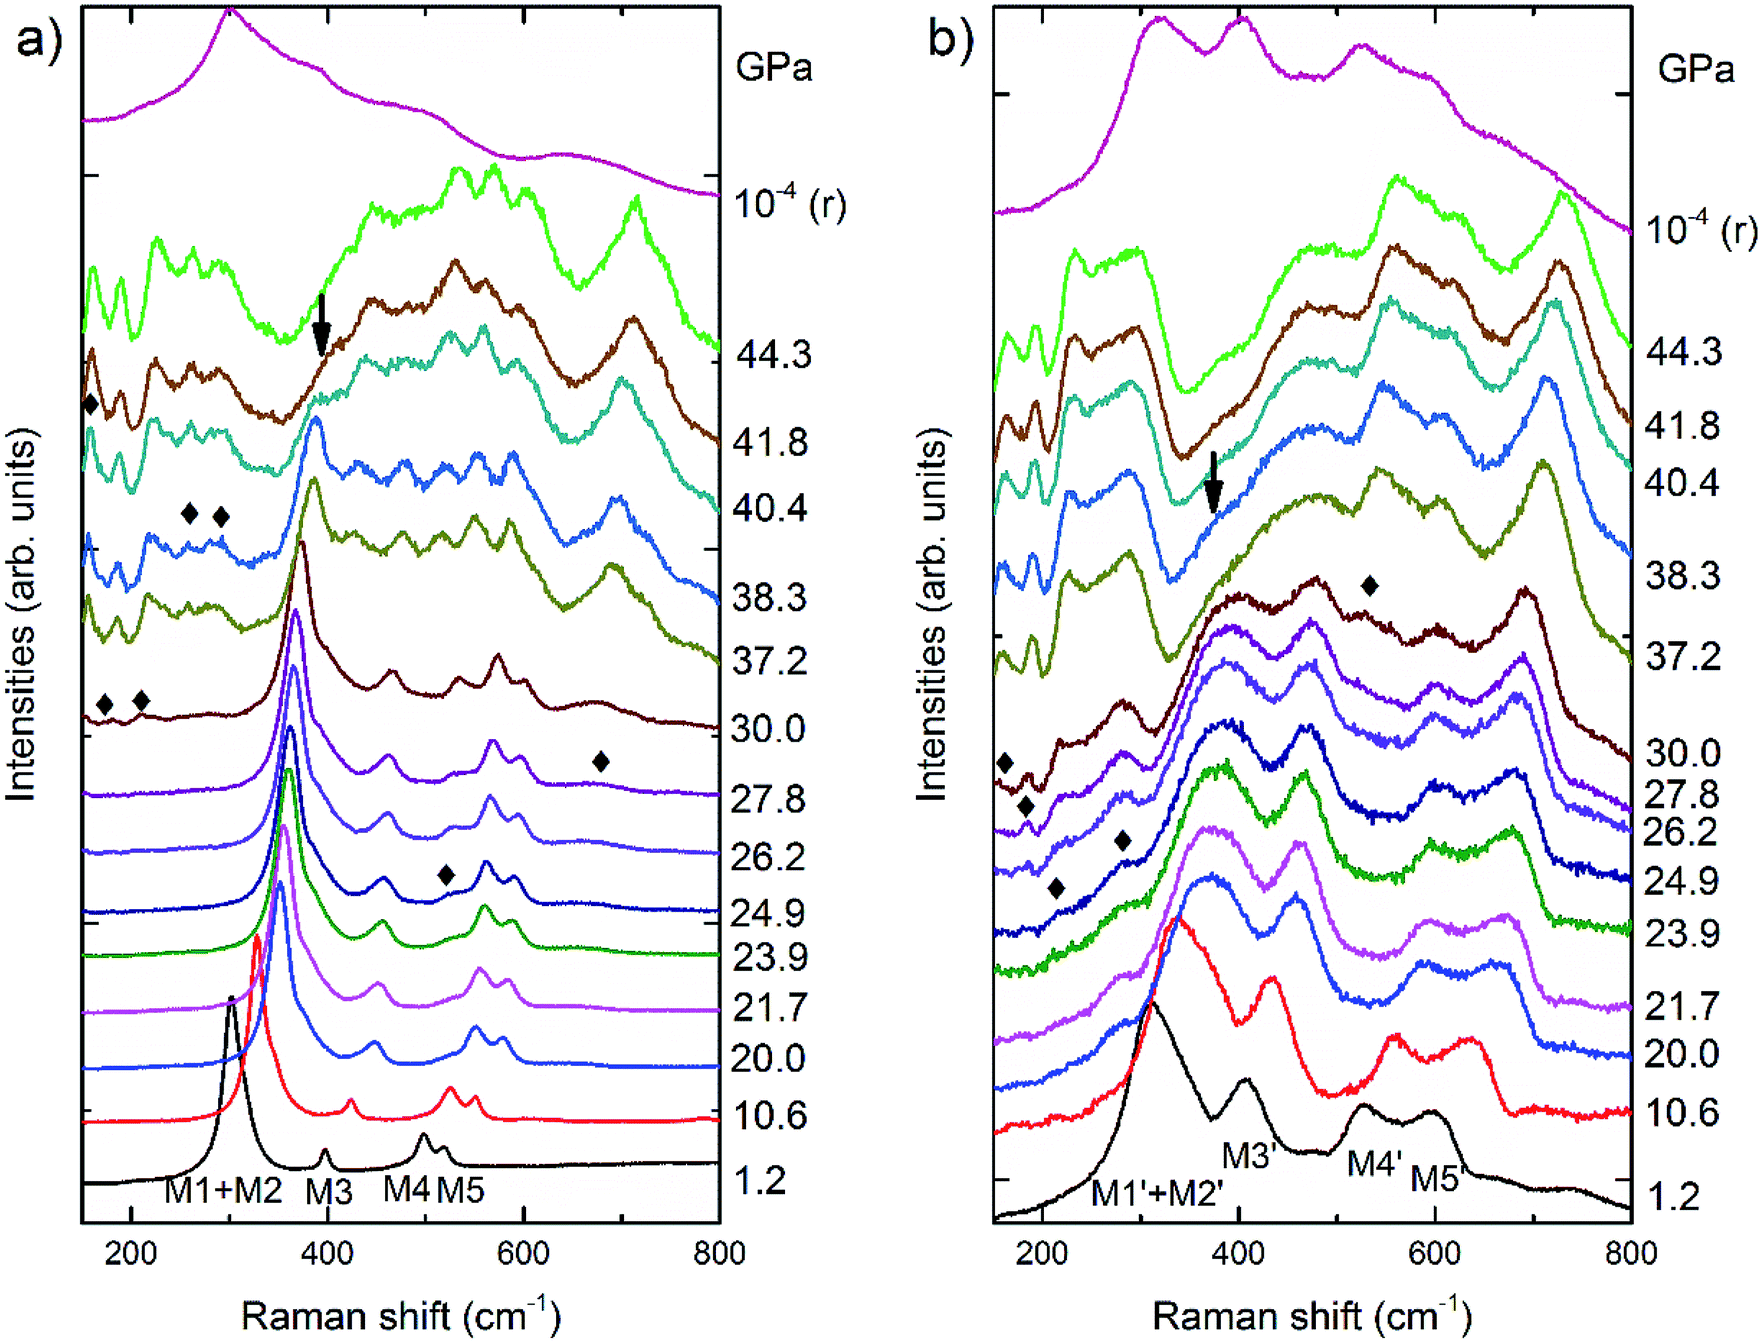 | ||
| Fig. 3 In situ high-pressure Raman spectra in run 1 of (a) La2Zr2O7 and (b) La0.5Gd1.5Zr2O7. The new bands attributed to the high-pressure cotunnite-like phase are marked by black diamonds at the lowest pressure at which they first appear. | ||
The cell volume obtained through the Le Bail refinement of the XRD patterns as a function of pressure is plotted in Fig. 4. The P–V curves of La2Zr2O7 and La0.5Gd1.5Zr2O7 show changes in slope at 5.5 and 6.5 GPa, respectively. The sudden pressure increases in the bulk modulus are indicated by Pc. These P–V data are fitted to the Birch–Murnaghan equation of state (EoS)27 in different pressure regions:
 | (2) |
 is the pressure derivative of B0, and V0 is the unit-cell volume at zero pressure and room temperature. The second-order Birch–Murnaghan P–V EoS
  was employed to obtain the zero-pressure bulk modulus (B0) for both P < Pc and P > Pc, and Pc is calculated from the intersection of the two P–V curves. The EoS parameters are listed in Table 1. In La2Zr2O7, at 5.5 GPa, the bulk modulus increases from 168(3) to 235(4) GPa, and V0 decreases from 1255.3(3) to 1245(1) Å3. In La0.5Gd1.5Zr2O7, when P < 6.5 GPa, the bulk modulus is 142.6(9) GPa, which indicates that the Gd3+ substitution La3+ decreases the bulk modulus and makes the pyrochlore more compressible. When P > 6.5 GPa, the bulk modulus increases to 360(23) GPa, which indicates that the La0.5Gd1.5Zr2O7 becomes strongly incompressible when the pressure is higher than 6.5 GPa. The bulk modulus B0 of the two samples before Pc are both about ∼160 GPa, which is lower than those of other titanite pyrochlores (e.g. B0(Sm2Ti2O7) = 185.4(2) GPa, B0(Gd2Ti2O7) = 176(4) GPa, B0(Tb2Ti2O7) = 199(1) GPa.),28–30 for Zr4+ owns a lager cationic radius and the bond length of Zr–O is longer than that of Ti–O.
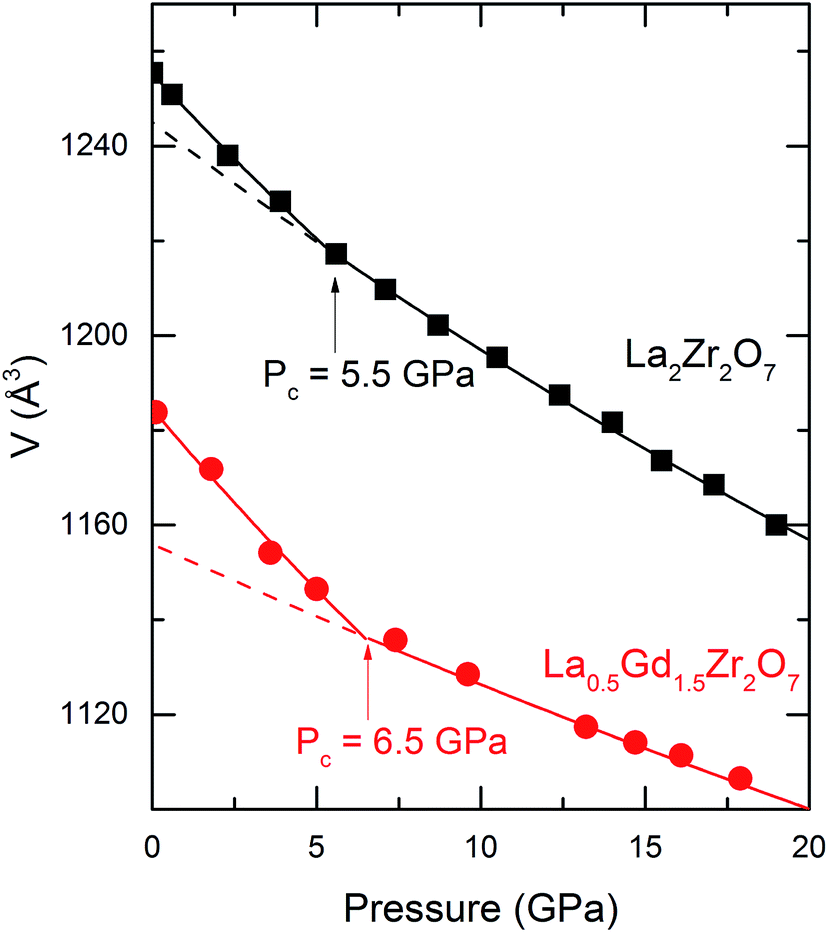 | ||
| Fig. 4 The volume of La2Zr2O7 and La0.5Gd1.5Zr2O7 as a function of pressure. The black squares and red circles are the unit-cell volumes at different pressures. The black and red solid lines correspond to the B–M EoS fitting for La2Zr2O7 and La0.5Gd1.5Zr2O7, respectively. Changes in the compressibility can be observed in both samples. In La2Zr2O7, the changing pressure is 5.5 GPa, and in La0.5Gd1.5Zr2O7 is 6.5 GPa. | ||
| P < Pc | P > Pc | |||||
|---|---|---|---|---|---|---|
| V0 (Å3) | B0 (GPa) |
|
V0 (Å3) | B0 (GPa) |
|
|
| La2Zr2O7 | 1255.3 (3) | 168 (3) | 4 (fixed) | 1245 (1) | 235 (4) | 4 (fixed) |
| La0.5Gd1.5Zr2O7 | 1184.6 (2) | 142.6 (9) | 1156 (2) | 360 (23) | ||

The observed Raman shift frequencies with an increasing pressure of La2Zr2O7 and La0.5Gd1.5Zr2O7 are plotted in Fig. 5. We applied a linear function to fit the Raman frequencies as a function of pressure,
| ν = ν0 + kP | (3) |
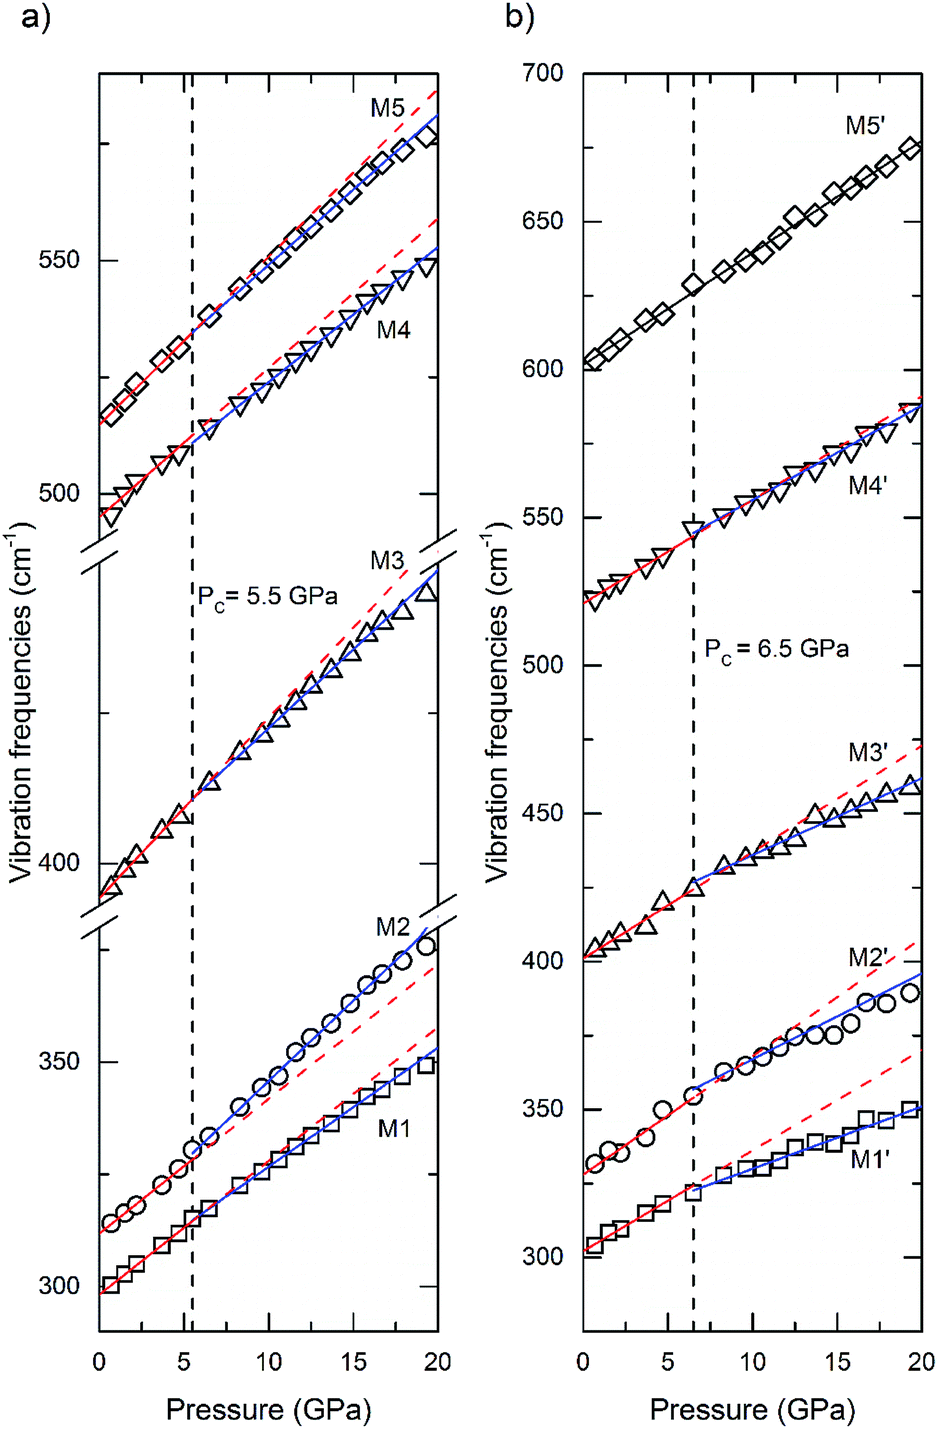 | ||
| Fig. 5 Pressure dependence of Raman modes for (a) La2Zr2O7 and (b) La0.5Gd1.5Zr2O7. The solid lines are the linear function of the vibration frequencies and pressure. The red lines indicate the region below Pc and the blue lines show the region above Pc. | ||
| P < Pc | P > Pc | |||||
|---|---|---|---|---|---|---|
| dν/dp (cm−1/GPa) | γi | ν0 (cm−1) | dν/dp (cm−1/GPa) | γi | ν0 (cm−1) | |
| La2Zr2O7 | ||||||
| M1 | 3.0 (1) | 1.69 | 298.2 (3) | 2.65 (3) | 1.48 | 300.2 (3) |
| M2 | 3.00 (9) | 1.62 | 311.8 (3) | 3.58 (6) | 1.94 | 310.0 (7) |
| M3 | 3.0 (1) | 1.27 | 394.2 (4) | 2.62 (2) | 1.11 | 396.3 (3) |
| M4 | 3.2 (3) | 1.08 | 495 (1) | 2.89 (4) | 0.98 | 495.1 (5) |
| M5 | 3.6 (2) | 1.17 | 514.8 (5) | 3.22 (3) | 1.05 | 516.9 (4) |
|
||||||
| La0.5Gd1.5Zr2O7 | ||||||
| M1′ | 3.4 (2) | 1.89 | 302.2 (6) | 2.1 (2) | 1.14 | 309 (3) |
| M2′ | 4.0 (8) | 2.05 | 328 (2) | 2.9 (3) | 1.44 | 338 (2) |
| M3′ | 3.6 (6) | 1.51 | 401 (2) | 2.6 (1) | 1.07 | 410 (2) |
| M4′ | 3.5 (2) | 1.12 | 521 (5) | 3.2 (1) | 1.02 | 524 (2) |
| M5′ | 3.79 (6) | 1.05 | 601.6 (7) | — | — | — |
4. Discussion
4.1 Transition pressure
The pressures at which the cotunnite-like phase first appears (Ps) and where the high-pressure phase occupies the entire volume of the same (Pe) are listed in Table 3. La2Zr2O7 began to transfer to the cotunnite-like structure at 22.7 GPa, and the transition complete at 41.8 GPa. While the starting pressure of the transition of La0.5Gd1.5Zr2O7 is 23.3, but the transition finishes at 38.7 GPa. The pressure-induced transition from the pyrochlore phase to the cotunnite-like phase is sluggish, and both structures co-exist over a pressure range of approximately 20 GPa. The theoretical calculation predicts that a smaller radius of the A-site cation may lower the transition.16 Here, Ps appears to be constant as a function of the cationic radius ratio. This may be explained based on differences in the sample loading conditions in a diamond anvil cell and/or by a slight overshoot at the onset of the transition when increasing the pressure during the experiment. Here, Pe of La2Zr2O7 is ∼4 GPa higher than that of La0.5Gd1.5Zr2O7. This reveals a tendency that Pe decreases when a decrease in the ionic radius of the A-site cations rA. This is consistent with the Surblé et al.'s high-pressure study on Ln2Zr2O7 pyrochlore (Ln = Ce, Nd, Gd),31 and it has also been predicted that the Pe of La2Zr2O7 is 43 ± 2 GPa, which was confirmed by our results. Usually, the incorporation of a larger radius cation will decrease the transition pressure, e.g. the olivine–spinel transition pressure of Mg2SiO4 (12.5 GPa) and Fe2SiO4 (4.9 GPa).32 However, according to the previous studies,33 the pressure-induced transition from a pyrochlore structure to a cotunnite-like structure is mainly an order-disorder transition. A phase stability study on Gd2Ti2−xZrxO7 pyrochlore has revealed that the transition pressure is positively related to the cationic radius ratio, and the transition is mainly achieved through a cation exchange at A–B position.34 All rare-earth elements have a similar crystal chemistry property. The Gd3+ substitution in La3+ can decrease the average cationic radius of the A-site and lower the differences in the A and B-site cations, making the transition easier. Thus, a smaller cation substitution may lower the transition pressure in the pyrochlore oxides, and decrease the phase stability under pressure. Vice versa, larger radius cation substitution will improve the phase stability under pressure. It indicates that in the immobilization forms of HLW, A-site substitution of actinides will not decrease the transition pressure for their cationic radius are larger than Gd3+ or other REE cations.| Compounds | a0 (Å) | rA/rB | Ps (GPa) | Pe(GPa) |
|---|---|---|---|---|
| La2Zr2O7 | 10.7949 (3) | 1.61 | 22.7 | 41.8 |
| La0.5Gd1.5Zr2O7 | 10.5762 (3) | 1.50 | 23.3 | 38.7 |
The value of Ps for the two samples in the present study is ∼23 GPa, which is higher than that in a previous experimental study24 and in other zirconate pyrochlores. In both the present study and Zhang's research,24 silicone oil was employed as the pressure media during an in situ high pressure XRD, and thus the PTM effect can be excluded. The difference in the transition pressure may be related to the sample preparation. There are two main differences that we believe can increase the pyrochlore phase stability under pressure: first, our samples used in this study were synthesized through a combustion method, whereas others have been synthesized using a solid-state method (similar to Eu2Zr2O7 (ref. 25) or Sm2Zr2O7 (ref. 35)) or an aqueous route (Nd2Zr2O7 or Gd2Zr2O7),31 and the grain size and morphology of the samples from a combustion method are quite different from those of a solid-state method. Second, the annealing temperature in our sample is higher than that in other studies. Rittman et al.'s experimental study17 proved that a higher annealing temperature can significantly reduce the concentration of defects in the lattice, and increase the transition pressure Ps. Usually, a combustion method requires a lower annealing temperature (1500 K, 2–3 h)19 compared with a solid-state method (1800 K, 10 h).36 In our study, the samples were annealed at 1773 K for 3 h, which is higher than the other combustion path synthesized samples. Considering the two points above, the differences in the sample preparation reduce the defects in the lattices in our samples and increase the phase stabilities. This conclusion indicates that reducing the defect concentrations in the lattice by improving the preparation technology or growth of single crystals will be helpful to improve the HLW forms' phase stability.
4.2 Mechanism of abnormal compressibility changes
In the present study, the changing pressure (Pc) of the compressibility and the pressure dependence of the vibration modes are 5.5 and 6.5 GPa in La2Zr2O7 and La0.5Gd1.5Zr2O7, respectively. Le Bail refinements in the in situ synchrotron high-pressure XRD patterns also confirm that the pyrochlore structure remains stable above Pc (Fig. S1†). An anomalous lattice expansion and change in the pressure dependence of the vibration modes were observed in La2Zr2O7 at ∼10 GPa, as reported by Zhang et al., and the mechanism is considered to be related to the water from the PTM intercalation.24 But in the present study, regardless of the silicone oil used in the XRD analysis and the argon shown in the Raman spectra, the PTMs are hydrophobic, water can be excluded in our study, and the incorporation of water in pyrochlore has difficulty explaining the increase in bulk modulus. Cation disorder can be excluded because the intensities of all XRD reflections, particularly the supper lattice reflections (111), (311), (333), and (531) remain constant, which implies that disorder in a cation is rare.We guess that the abnormal compressibility changes in La2Zr2O7 and La0.5Gd1.5Zr2O7 may be related to the anion distortion. A compressibility change under pressure has been observed in many titanite pyrochlores (such as Gd2Ti2O7 (ref. 29) and Tb2Ti2O7 (ref. 30)), and is related to the rearrangement of [TiO6] octahedra. In zirconate pyrochlore, an increase of B0 have been observed in Sm2Zr2O7, and it is thought to be caused by a structural distortion.35 So the increase of B0 in La2Zr2O7 and La0.5Gd1.5Zr2O7 may undergo the same mechanism with other pyrochlores. Another possible mechanism is anion disorder, but the XRD is more focused on a long-range structure, whereas an anion disorder is more likely a change in the arrangement of short-range ions. XAFS and PDF, which are more powerful for sensing short-range arrangements, may be helpful in revealing more details on the structural distortion and provide firmer evidence regarding the mechanism of the compression behavior of the pyrochlore oxides.
Re-thinking of the compressibility results reported by previous literature, the  of Gd2Zr2O7, Nd2Zr2O7, and Ce2Zr2O7 provided in the literature are 8(1), 14(1) and 0.0, which is far from 4.0. These physics violation results indicate that there may be compressibility changes have not been discovered.
4.3 Thermodynamic mechanism of the coexistence of the two phases
In the following, we derive a model from the perspective of thermodynamics to describe the phase ratio of the high-pressure cotunnite-like phase and the pyrochlore phase. The pressure-induced phase transition from a pyrochlore into a cotunnite-like phase can be seen as the following reaction:| A2B2O7 (pyrochlore) → A2B2O7 (cotunnite-like) |
Thus, the chemical equilibrium constant K of the transition can be written as
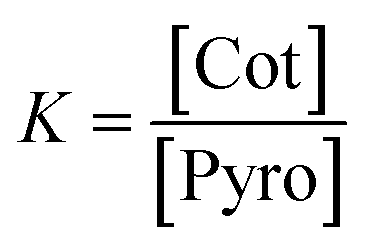 | (4) |
| δΔG = ΔVdP | (5) |
|
−RTdlnK = ΔVdP
| (6) |
Setting P1/2 as the pressure under which the concentration of the high-pressure phase is equal to the pyrochlore phase, we have P = P1/2, K = 1. Solving the function, we obtain
 | (7) |
Although owing to the poor quality of the in situ high-pressure XRD patterns and the limit to the X-ray wavelength, obtaining the phase ratio from reliable Rietveld refinements is quite difficult. In previous studies, the increase in the scattering intensity between the (222) and (400) pyrochlore structures has been used to define the onset of the transition because this is the most intense of the cotunnite peaks.17,23 Here, we use the intensity ratio I/I222 between the intensities of the most intense peak of the cotunnite phase and the (222) peak of the pyrochlore to describe the phase ratio of the high-pressure phase and pyrochlore phase. Clearly, I/I222 is proportional to the phase ratio  where q is the coefficient. We then have
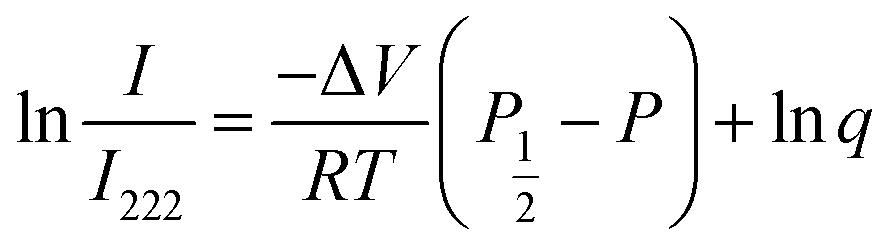 | (8) |
Fig. 6 shows lnI/I222 of La2Zr2O7 and La0.5Gd1.5Zr2O7 at various pressures. From the equation, it can be seen that the slope of lnI/I222 with pressure is determined by the volume change in the transition. Liner fits yield a slope of lnI/I222 with a pressure of 0.20 GPa−1, which is lower than that of La0.5Gd1.5Zr2O7 0.32 GPa−1. This indicates that the ΔV of La2Zr2O7 is smaller during the transition. Theoretical calculations have proven that, during the transition, the ΔV of La2Zr2O7 is 9.9%V0,16 whereas an experimental study has shown that the ΔV of Gd2Zr2O7 is 16.4%V0,37 which is in agreement with our prediction. In addition, the volume changes ΔV during the transition also determine the co-existence of two-phase pressure regions. A larger ΔV means a high-pressure phase generates “faster” under pressure, shortening the co-existing region.
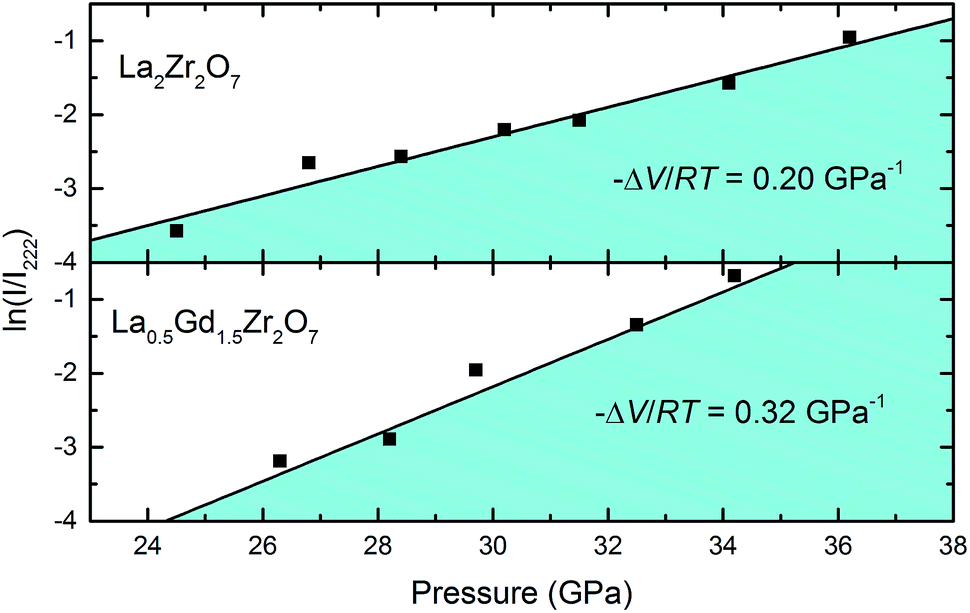 | ||
| Fig. 6 ln(I/I222) of La2Zr2O7 and La0.5Gd1.5Zr2O7 as functions of pressure. | ||
5. Conclusion
The high-pressure phase stability of La2Zr2O7 and La0.5Gd1.5Zr2O7 pyrochlore were examined using synchrotron radiation X-ray diffraction and Raman spectroscopy. Both samples underwent a pressure-induced structural transition leading to a Pnma cotunnite-like phase. The Pe of La0.5Gd1.5Zr2O7 was shown to be lower than that of La2Zr2O7, indicating that the transition pressure has a positive correlation with the cationic radius ratio rA/rB. The compression behavior of the pyrochlore phase of the two samples was determined. The P–V curves reveal that, at over pressure Pc, La2Zr2O7 and La0.5Gd1.5Zr2O7 both show an increase in the bulk modulus, which may be related to the structural distortion under pressure.Conflicts of interest
There are no conflicts to declare.Acknowledgements
This work was support by the National Natural Science Foundation of China (Grant No. 91326102 and 51532009), and the Science and Technology Development Foundation of China Academy of Engineering Physics (Grant No. 2013A0301012). Haibin Zhang is grateful for the support by the Recruitment Program of Global Youth Experts and the Youth Hundred Talents Project of Sichuan Province.References
- Q. Feng, Q. Wang, Z. Zhang, Y. Y. H. Xiong, H. Y. Li, Y. Yao, X. Z. Yuan, M. C. Williams, M. Gu, H. Chen, H. Li and H. J. Wang, Appl. Catal., B, 2019, 244, 494–501 CrossRef CAS.
- L. J. Ai, Z. P. Wang, Y. B. Gao, C. C. Cui, B. Q. Wang, W. Liu and L. G. Wang, J. Mater. Sci., 2019, 54, 4495–4510 CrossRef CAS.
- J. Zhang, D. Wang, L. Lai, X. Fang, J. Xu, X. Xu, X. Zhang, J. Liu, H. Peng and X. Wang, Catal. Today, 2019, 327, 168–176 CrossRef CAS.
- B. J. Wuensch, K. W. Eberman, C. Heremans, E. M. Ku, P. Onnerud, E. M. E. Yeo, S. M. Haile, J. K. Stalick and J. D. Jorgensen, Solid State Ionics, 2000, 129, 111–133 CrossRef CAS.
- K. W. Eberman, B. J. Wuensch and J. D. Jorgensen, Solid State Ionics, 2002, 148, 521–526 CrossRef CAS.
- N. P. Padture, M. Gell and E. H. Jordan, Science, 2002, 296, 280–284 CrossRef CAS PubMed.
- J. Wu, X. Wei, N. P. Padture, P. G. Klemens, M. Gell, E. García, P. Miranzo and M. I. Osendi, J. Am. Ceram. Soc., 2002, 85, 3031–3035 CrossRef CAS.
- M. Gingras, B. Den Hertog, M. Faucher, J. Gardner, S. Dunsiger, L. Chang, B. Gaulin, N. Raju and J. Greedan, Phys. Rev. B: Condens. Matter Mater. Phys., 2000, 62, 6496 CrossRef CAS.
- R. C. Ewing, W. J. Weber and J. Lian, J. Appl. Phys., 2004, 95, 5949–5971 CrossRef CAS.
- J. S. Gardner, M. J. Gingras and J. E. Greedan, Rev. Mod. Phys., 2010, 82, 53 CrossRef CAS.
- M. Subramanian, G. Aravamudan and G. S. Rao, Prog. Solid State Chem., 1983, 15, 55–143 CrossRef CAS.
- K. E. Sickafus, L. Minervini, R. W. Grimes, J. A. Valdez, M. Ishimaru, F. Li, K. J. Mcclellan and T. Hartmann, Science, 2000, 289, 748–751 CrossRef CAS PubMed.
- R. C. Ewing, W. J. Weber and F. W. C. Jr, Prog. Nucl. Energy, 1995, 29, 63–127 CrossRef CAS.
- H. Y. Xiao, F. Gao and W. J. Weber, Phys. Rev. B: Condens. Matter Mater. Phys., 2009, 80, 212102 CrossRef.
- H. Y. Xiao and W. J. Weber, J. Phys.: Condens. Matter, 2011, 23, 035501 CrossRef CAS PubMed.
- H. Y. Xiao, F. Zhang, F. Gao, M. Lang, R. C. Ewing and W. J. Weber, Phys. Chem. Chem. Phys., 2010, 12, 12472–12477 RSC.
- D. R. Rittman, K. M. Turner, S. Park, A. F. Fuentes, C. Park, R. C. Ewing and W. L. Mao, Sci. Rep., 2017, 7, 2236 CrossRef PubMed.
- F. Zhang, M. Lang and R. Ewing, Appl. Phys. Lett., 2015, 106, 191902 CrossRef.
- K. A. Sakharov, E. P. Simonenko, N. P. Simonenko, M. L. Vaganova, Y. E. Lebedeva, A. S. Chaynikova, I. V. Osin, O. Y. Sorokin, D. V. Grashchenkov and V. G. Sevastyanov, Ceram. Int., 2018, 44, 7647–7655 CrossRef CAS.
- H. Mao, J.-A. Xu and P. Bell, J. Geophys. Res.: Solid Earth, 1986, 91, 4673–4676 CrossRef CAS.
- A. Hammersley, S. Svensson, M. Hanfland, A. Fitch and D. Hausermann, High Pressure Res., 1996, 14, 235–248 CrossRef.
- B. H. Toby, J. Appl. Crystallogr., 2001, 34, 210–213 CrossRef CAS.
- D. R. Rittman, K. M. Turner, S. Park, A. F. Fuentes, J. Yan, R. C. Ewing and W. L. Mao, J. Appl. Phys., 2017, 121, 045902 CrossRef.
- F. Zhang, M. Lang, Z. Liu and R. Ewing, Phys. Rev. Lett., 2010, 105, 015503 CrossRef CAS PubMed.
- H. Li, N. Li, Y. Li, Q. Tao, Y. Zhao, H. Zhu, Y. Ma, P. Zhu and X. Wang, High Pressure Res., 2017, 37, 256–266 CrossRef CAS.
- X. L. Xia, Z. G. Liu, J. H. Ouyang and Y. Zheng, Fuel Cells, 2012, 12, 624–632 CrossRef CAS.
- F. Birch, Phys. Rev., 1947, 71, 809 CrossRef CAS.
- B. Winkler, A. Friedrich, W. Morgenroth, E. Haussühl, V. Milman, C. R. Stanek and K. J. McClellan, Chin. Sci. Bull., 2014, 59, 5278–5282 CrossRef CAS.
- S. Saha, D. Muthu, C. Pascanut, N. Dragoe, R. Suryanarayanan, G. Dhalenne, A. Revcolevschi, S. Karmakar, S. M. Sharma and A. Sood, Phys. Rev. B: Condens. Matter Mater. Phys., 2006, 74, 064109 CrossRef.
- S. Saha, D. S. Muthu, S. Singh, B. Dkhil, R. Suryanarayanan, G. Dhalenne, H. Poswal, S. Karmakar, S. M. Sharma and A. Revcolevschi, Phys. Rev. B: Condens. Matter Mater. Phys., 2009, 79, 134112 CrossRef.
- S. Surblé, S. Heathman, P. Raison, D. Bouëxière, K. Popa and R. Caciuffo, Phys. Chem. Miner., 2010, 37, 761–767 CrossRef.
- A. E. Ringwood and A. Major, Phys. Earth Planet. Inter., 1970, 3, 89–108 CrossRef CAS.
- F. Zhang, B. Manoun and S. Saxena, Mater. Lett., 2006, 60, 2773–2776 CrossRef CAS.
- F. Zhang, J. Wang, J. Lian, M. Lang, U. Becker and R. Ewing, Phys. Rev. Lett., 2008, 100, 045503 CrossRef CAS PubMed.
- F. Zhang, J. Lian, U. Becker, L. Wang, J. Hu, S. Saxena and R. Ewing, Chem. Phys. Lett., 2007, 441, 216–220 CrossRef CAS.
- H. Yamamura, H. Nishino, K. Kakinuma and K. Nomura, Solid State Ionics, 2003, 158, 359–365 CrossRef CAS.
- F. Zhang, J. Lian, U. Becker, R. Ewing, J. Hu and S. Saxena, Phys. Rev. B: Condens. Matter Mater. Phys., 2007, 76, 214104 CrossRef.
Footnote |
| † Electronic supplementary information (ESI) available. See DOI: 10.1039/c9ra03438b |
| This journal is © The Royal Society of Chemistry 2019 |