 Open Access Article
pH-induced conformational changes in histamine in the solid state†
Kanchanok Kodchakornab,
Piyarat Nimmanpipug *a,
Suttinun Phongtamrug
 c and
Kohji Tashiro
 *d
*d
aDepartment of Chemistry, Faculty of Science and Center of Excellence for Innovation in Analytical Science and Technology, Chiang Mai University, Chiang Mai 50200, Thailand. E-mail: piyarat.n@cmu.ac.th
bDoctor of Philosophy Program in Chemistry, Faculty of Science, Chiang Mai University, Chiang Mai 50200, Thailand
cDepartment of Industrial Chemistry, Faculty of Applied Science, King Mongkut's University of Technology North Bangkok, Bangkok 10800, Thailand
dDepartment of Future Industry-Oriented Basic Science and Materials, Graduate School of Engineering, Toyota Technological Institute, Tempaku, Nagoya 468-8511, Japan. E-mail: ktashiro@toyota-ti.ac.jp
First published on 20th June 2019
Abstract
Histamine is one of the most basic biogenic amino-compounds, which is composed of imidazole and a flexible ethylamine side chain moiety. Histamine is known to take the form of various types of cations, free base, monocation and dication form, where its conformational change is highly sensitively to the pH conditions. The details of these changes are still controversial due to a lack of detailed information on its crystal structures. Thus, in this study, the molecular packing structures of histidine at various pH were analyzed via X-ray diffraction in combination with vibrational spectroscopy and energy calculations. A variety of molecular conformations including the tautomeric phenomenon was found to be intimately related with intra- and intermolecular hydrogen bonds. The role of the hydrogen bonds was studied also to check the possibility of high proton conductivity of histamine, as predicted by computer simulation. Consequently, the thus-predicted proton conductivity was confirmed for the first time experimentally. During the heating process, the conductivity showed the relatively high maximum value of 10−4 S cm−1 at around 60 °C, which is related to the effective proton transfer between the amino NH group of one histamine unit and the imidazole ring of another.
1. Introduction
Histamine is one of the most important biogenic amines, which is present in mammalian organisms.1 The biological effects of histamine are involved in several defense mechanisms, with four different types of specific histamine receptors. Histamine causes an increase in vasodilation, drop in blood pressure, mediation of smooth contraction of muscle, regulation of allergic conditions (Histamine-H1 receptor, HRH1), control of gastric acid secretion (Histamine-H2 receptor, HRH2), modulation of neurotransmitter release (Histamine-H3 receptor, HRH3),2,3 increased expression of adhesion molecules and modulation of inflammatory conditions (Histamine-H4 receptor, HRH4).4 The sensitivity of histamine to receptors was explored to determine their biological roles in the structure-dependent activity of histamine agonists.5,6 These investigations suggested that the binding of histamine with receptors occurs in the trans conformation. For example, the X-ray structure analysis of the histamine-binding protein complex (found in tick saliva, HBP2) showed that monocation histamine molecules take the trans conformation and interact strongly with the negatively-charged amino acid residues in the binding pocket.5Thus, it is important to know the variable molecular shapes of histamine, which sensitively change depending on the environmental conditions.7–28
(i) Base and acid species: Depending on the pH value, histamine can take the form of three types of ions, free base (H1, pH > 10), monocation (H2, pH 6.5 ∼ 7.5) and dication (H3, pH < 5).
(ii) Tautomerism: A proton is attached to the N atom of the imidazole ring. When the imidazole–NH group is closer to the amine (NH2 or NH3+) unit of the ethyl amine group, this NH group is named the Nπ unit. If the imidazole–NH group is far from the position of the amine unit, it is named the Nτ unit.
(iii) Torsional isomers: 3 types of internal rotations can be defined around the N(im)–C(im)–CH2–CH2 (τ1), C(im)–CH2–CH2–N (τ2), and CH2–CH2–N–H (τ3) bonds, where “im” indicates the imidazole ring. The trans (T, 180°) and gauche (G, 60°) forms are possible for these three torsional angles.
By combining these three different types of local structures (i–iii), histamine molecules can take a variety of molecular forms. Scheme 1 summarizes the various molecular forms proposed for the gas, solution and solid phases of histamine species. For example, the histamine free base molecule in the gas phase is reported to take the Nπ/GG and Nπ/GT forms,15 where factors (ii) and (iii) are combined to express the molecular forms. The concrete forms are illustrated in Scheme 1. In solution, the Nπ/GG, Nπ/GT and Nτ/GG forms are reported to be possible.7,15 In the solid phase, only the Nπ/GT form was reported.8 On the other hand, monocation histamine can take the Nτ/GG and Nτ/GT forms in the gas phase, only the Nτ/GG form in solution and the Nπ/GG and Nτ/GT forms in the solid state.9,15,16,21,22 The dication species cannot be detected in the gas phase, but it exists as TG and GT forms in solution,25,26 and TG and TT forms in the solid state.10–13
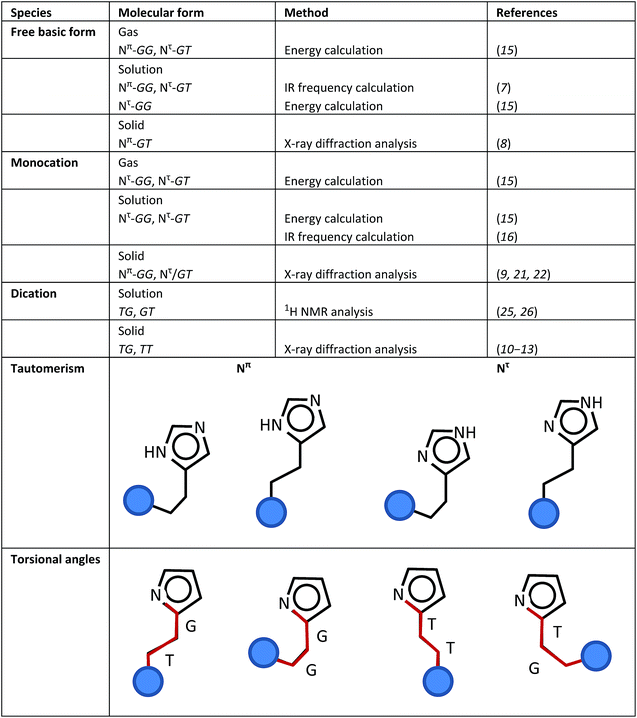 | ||
| Scheme 1 Definitions of the various structure factors of the histamine molecule and its proposed molecular forms in the gas, solution and solid states. | ||
Accordingly, the combination of factors (i)–(iii) makes the structural description of histamine molecule quite complicated. Thus, the behavior of histamine under various conditions is still controversial.
To solve this problem, the structure study of the various histamine forms was investigated using numerous theoretical and experimental methods, but no clear answers have been obtained from a thorough search of the literature.7–28
It is indispensable to know the systematic relation between the molecular conformations (including the tautomeric and internal rotation states) and the molecular packing mode in the solid state for the various cationic species of histamine. However, despite the long history of histamine and its significant role in physiological phenomena, structural studies of histamine are limited in the literature.7–28
Of course, the above-mentioned structural information should be related to the characteristic properties of histamine. For example, as easily predicted from its chemical structure, histamine has an amino group and imidazole ring, which should cause high proton conductivity as a possibility.29–32 However, the experimental evidence on its proton conductivity is quite limited in the literature. If histamine can show high proton conductivity, it may act as a proton-conducting composite for fuel cell applications. For example, Umeyama et al. constructed a composite of an aluminum-based micropore and histamine, and achieved conductivity of over 10−3 S cm−1 at 150 °C under anhydrous conditions. However, no investigation was conducted on the proton conductivity of histamine itself.33
As will be described in the first half part herein, histamine species prepared under various pH conditions were systematically characterized via the combination of various techniques such as X-ray crystal structure analysis, vibrational spectroscopy and quantum chemical calculations in addition to thermal data to the study the possibility of phase transition. The thus-established structural information was applied to determine the possibility of proton conductivity for the first time from both theoretical and experimental points of view, as will be reported in the second half herein.
As mentioned above, histamine is one of the most important basic compounds related to many physiological phenomena,7–28 but its behavior must be understood concretely from a structural point of view. Although many papers have been published thus far about the molecular shape and packing state of histamine, herein, we reveal various new and basic information about the aggregation state of histamine subjected to different environments from various points of view.
2. Experimental
2.1 Samples
Histamine was purchased from Sigma Aldrich Chemical Co. (99% purity, pH ∼ 11). Histamine was dissolved in benzene and recrystallized to obtain long and colorless needle crystals,8 which were denoted as the histamine free base (H1). To prepare histamine monocation (H2), histamine free base was dissolved in an HCl solution of pH ∼ 7.9 Then, the solution was evaporated to obtain a white solid powder at room temperature. The powder was dissolved in methanol and recrystallized to obtain long needle-like crystals of histamine monohydrochloride. For the histamine dication (H3), the histamine free base was dissolved in HCl solution of pH ∼ 4.11 The aqueous solution was filtrated and evaporated at room temperature. Recrystallization from aqueous solution afforded radially grown colorless needle-like crystals of histamine dihydrochloride. Histamine is hygroscopic and quickly deteriorates upon exposure to air. Therefore, the single crystal used for X-ray diffraction measurement was placed inside a glass capillary and filled with liquid paraffin.2.2 Measurements
2.3 Measurements
The proton conductivities of the histamine samples were measured via an impedance method with a μ-AUTOLAB Type-III connected to a PC running electrochemical impedance software in the frequency range of 100 kHz to 1 Hz with an AC signal of 50 mV at 30–190 °C. At each temperature, T, the impedance data was plotted based on the Nyquist equation, from which the conductivity σ(T) (S cm−1) was calculated from impedance data based on eqn (1).
 | (1) |
The sample was dissolved in methanol and dropped on glass filter paper (50 μL) and dried at room temperature. This process was repeated three times before drying under vacuum at room temperature for 4 h, and the thus-prepared samples were kept in desiccators until measurement. Dried glass filter paper was assembled in a sealed Teflon cell using gold-film-coated copper plates as the electrode.
2.4 Conformational analysis
The conformation of an isolated histamine molecule was studied by using the X-ray-analyzed structure as an initial model, which was energetically optimized using the DMol3 software by Materials Studio (Biovia).36–38 DFT (density functional theory) calculation was carried out with the BLYP functional for the generalized gradient approximation (GGA) with a double numerical basis set plus polarization p-function on the hydrogen atoms and d-function of all the non-hydrogen atoms.39The thus-optimized models were used to search the energetically most stable structure by conformational analysis (the Conformers module with COMPASS40 force field in Materials Studio). The most stable geometry of histamine molecule was sought by varying the two torsional angles: τ1, between the plane of the aminoethyl side chain and imidazole ring (N(im)–C(im)–CH2–CH2) and τ2, the plane of the C–C bond of the ethyl side chain (C(im)–CH2–CH2–N). A systematic approach was applied to search the molecular geometry for these two torsional angles with a 3-degree increment of the dihedral angle in the dihedral angle range from −180° to 180°.
2.5 Packing structure prediction
The Polymorph Predictor of Materials Studio (Biovia) was used to predict the possible crystal structures using the COMPASS force field.36–38,40 By referring to the space group symmetries encountered frequently in the X-ray structure analysis, several representative space groups were employed (P1, P![[1 with combining macron]](https://www.rsc.org/images/entities/char_0031_0304.gif) , P21, P21/c, P2/c and Pbca). The initial positions of the molecules in the unit cell and the cell parameters were randomly given. The Metropolis Monte Carlo method was applied for the annealing procedure in the temperature range of 6 × 10⁴ to 300 K to obtain the most stable packing structure. The 250 crystal structure models produced for each selected space group were classified by a clustering process to obtain several representative structure models.41,42 The energies were optimized, and the top ten structures with the lowest energies were picked up and compared with the X-ray-analyzed structure.
, P21, P21/c, P2/c and Pbca). The initial positions of the molecules in the unit cell and the cell parameters were randomly given. The Metropolis Monte Carlo method was applied for the annealing procedure in the temperature range of 6 × 10⁴ to 300 K to obtain the most stable packing structure. The 250 crystal structure models produced for each selected space group were classified by a clustering process to obtain several representative structure models.41,42 The energies were optimized, and the top ten structures with the lowest energies were picked up and compared with the X-ray-analyzed structure.
3. Results and discussion
3.1 Crystal structure analysis
The crystal structures of the three types of histamine species, H1, H2, and H3, were determined by X-ray single crystal analyses, as shown in Fig. 1. The crystallographic data and data collection parameters are listed in Table 1 for these compounds.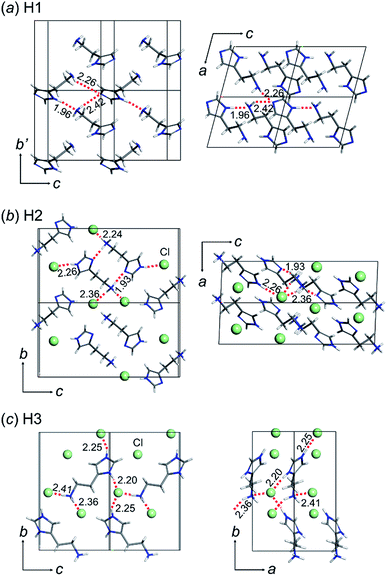 | ||
| Fig. 1 Crystal structures of histamine ionic species: (a) free base (H1: CCDC 1912431), (b) monocation (H2: CCDC 1912450), and (c) dication (H3: CCDC 1912432). The green balls in the monocation and dication forms indicate the chloride anion (Cl−). The hydrogen bonds are shown as a red dotted line and the hydrogen bond distances are shown in Angstroms (Å). | ||
| Model compound | H1 | H2 | H3 |
|---|---|---|---|
| Empirical formula | C5H9N3 | C5H10N3·Cl | C5H11N3·2Cl |
| Formula weight | 111.14 | 147.61 | 184.07 |
| Crystal system | Monoclinic | Monoclinic | Monoclinic |
| Lattice type | Primitive | Primitive | Primitive |
| Space group | P21 | P21/n | P21 |
| a (Å) | 5.698(3) | 4.623(3) | 4.449(6) |
| b (Å) | 7.632(4) | 9.204(9) | 12.694(16) |
| c (Å) | 7.250(4) | 17.413(13) | 7.577(9) |
| α (°) | 90 | 90 | 90 |
| β (°) | 104.92(7) | 92.31(18) | 91.45(3) |
| γ (°) | 90 | 90 | 90 |
| V (Å3) | 304.6(3) | 740.3(10) | 427.7(9) |
| Z | 2 | 2 | 2 |
| Density (g cm−3) | 1.255 | 1.093 | 1.693 |
| μ Mo Kα (cm−1) | 0.817 | 2.679 | 7.216 |
| Radiation | Mo Kα | Mo Kα | Mo Kα |
| Temperature (K) | 296 | 296 | 296 |
| Max and min transmission | 0.992 and 0.429 | 1.000 and 0.377 | 0.930 and 0.315 |
| Reflections measured | 2997 | 6937 | 4129 |
| Independent reflections | 1277 (Rint = 0.0596) | 1675 (Rint = 0.0673) | 1948 (Rint = 0.0628) |
| Observed reflections used for the refinements | 555 | 1170 | 1325 |
| Goodness-of-fit on F2 | 1.178 | 1.194 | 1.142 |
| Final R indices | R1 = 0.0412 [I > 4σ(I)] | R1 = 0.0579 [I > 4σ(I)] | R1 = 0.0850 [I > 4σ(I)] |
| ωR2 = 0.0591 | ωR2 = 0.0751 | ωR2 = 0.1397 | |
| Δρmax and Δρmin (e Å−3) | 0.23 and −0.39 | 0.71 and −0.44 | 3.29 and −1.32 |
3.2 Energy stability of the molecular conformations
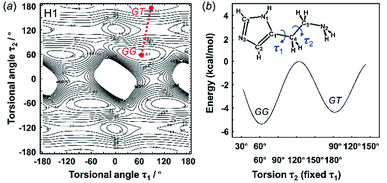
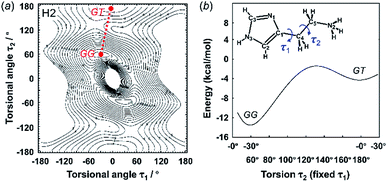
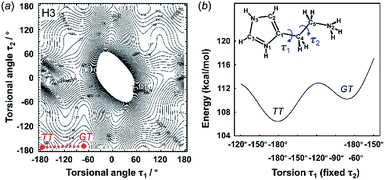
The X-ray crystal structure analysis clarified the molecular shapes of histidine in the solid state, as mentioned above. All the histamine species show the trans conformation with the dihedral angle of τ2 ∼ 180° (Fig. 1). To clarify the reason for the histamine molecules taking the trans conformation, the conformational analysis was performed for an isolated molecule without additional perturbation and the most energetically stable structures were extracted. The dihedral angles τ1 and τ2 were varied at constant intervals and the conformational energy was calculated using the Conformers software of Materials Studio. Table 2 summarizes the energy terms obtained for the most preferable conformations of the histamines (see Fig. S1, ESI†).| Model | Energy (kcal mol−1) | Relative stability | Observed form | ||
|---|---|---|---|---|---|
| GG | GT | TT | |||
| Free base (H1) | −5.36 | −4.44 | — | GG ≈ GT | GT |
| Monocation (H2) | −13.54 | −4.77 | — | GG ≫ GT | GT |
| Dication (H3) | — | 110.21 | 106.45 | TT > GT | TT |
3.3 Prediction of crystal packing structure of histamine molecules
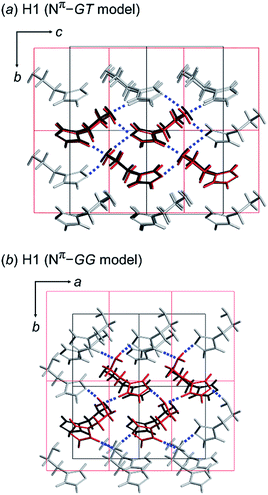
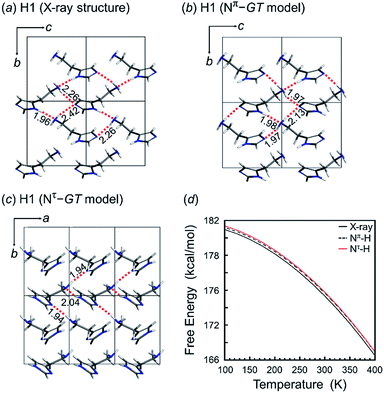
As discussed above, we found that the histamine molecule can take many types of conformations. Among them, the trans conformation (τ2 angle) was found to be the most stable. However, the X-ray structure analysis revealed individually unique conformations in the solid state for the H1, H2 and H3 species. In the previous section, the conformationally-stable forms were predicted by taking only the intramolecular conformational energy into account. However, an energy calculation by considering both the intramolecular and intermolecular interactions must be performed for the prediction of the actually-realized molecular packing structure and the molecular conformation in the lattice. The actual calculation was performed using the annealing Monte Carlo simulation method with the Polymorph Predictor software of Materials Studio. Herein, the case of H1 is analyzed as an example.As described in the previous section, the X-ray analysis revealed that H1 molecules take the GT-type conformation with the imidazole ring in the Nπ–H tautomeric form. The packing structure prediction was carried out using this Nπ/GT conformation as the packing unit. Among the various possible space groups listed in Table 3, the energetically lowest structure has the P21/c space group, but this crystal structure did not match the X-ray analyzed structures. Rather, the Nπ/GT structure of the P21 space group was found to give good agreement with the X-ray result, as judged from the viewpoint of the unit cell parameters and the molecular conformation (GT), although this structure does not necessarily have the lowest energy. In addition, the thus-predicted packing structure has intermolecular hydrogen bonds, consistent with the observed structure (Fig. 5a).
| Space group | Cell parameters | Density, g cm−3 | Total energy, kcal mol−1 | vdW energy, kcal mol−1 | Electrostatic energy, kcal mol−1 | Final shape | Torsion angle/° | |||||||
|---|---|---|---|---|---|---|---|---|---|---|---|---|---|---|
| a/Å | b/Å | c/Å | α/° | β/° | γ/° | τ1 | τ2 | τ3 | ||||||
| Observed | ||||||||||||||
| P21 | 5.69 | 7.63 | 7.25 | 90 | 104.9 | 90 | 1.255 | — | — | — | GT | 64.3 | 170.1 | 62.9 |
![[thin space (1/6-em)]](https://www.rsc.org/images/entities/char_2009.gif) |
||||||||||||||
| Calculated Nπ–H | ||||||||||||||
| P21 | 5.71 | 7.49 | 7.93 | 90 | 59.7 | 90 | 1.259 | −31.52 | −11.20 | −18.30 | GT | 62.4 | 167.8 | 57.6 |
| P1 | 5.61 | 5.13 | 12.57 | 48.6 | 32.7 | 51.1 | 1.275 | −31.40 | −11.59 | −17.20 | GT | 71.5 | 172.0 | 179.2 |
P![[1 with combining macron]](https://www.rsc.org/images/entities/char_0031_0304.gif) |
7.19 | 9.45 | 5.07 | 87.2 | 93.1 | 122.9 | 1.279 | −31.98 | −11.04 | −18.27 | GT | 103.7 | −175.1 | −52.1 |
| P2/c | 8.11 | 4.41 | 18.32 | 90 | 114.1 | 90 | 1.234 | −30.59 | −11.03 | −16.93 | GT | 73.0 | 178.5 | −61.3 |
| P21/c | 17.80 | 4.86 | 14.70 | 90 | 153.6 | 90 | 1.304 | −32.18 | −12.03 | −17.49 | GT | −80.8 | 179.3 | 77.8 |
| Pbca | 13.84 | 15.02 | 5.48 | 90 | 90.0 | 90 | 1.296 | −31.55 | −11.43 | −17.34 | GT | −136.1 | 179.7 | 68.8 |
![[thin space (1/6-em)]](https://www.rsc.org/images/entities/char_2009.gif) |
||||||||||||||
| Nτ–H | ||||||||||||||
| P21 | 5.16 | 7.67 | 7.56 | 90 | 98.6 | 90 | 1.249 | −34.53 | −11.07 | −25.54 | GT | −55.7 | −176.5 | 56.2 |
| P1 | 4.67 | 5.97 | 7.30 | 60.9 | 88.0 | 57.7 | 1.289 | −33.57 | −12.39 | −22.98 | GT | −78.8 | −171.7 | 70.2 |
P![[1 with combining macron]](https://www.rsc.org/images/entities/char_0031_0304.gif) |
7.93 | 5.29 | 9.09 | 123.5 | 104.7 | 98.4 | 1.286 | −33.26 | −12.31 | −23.46 | GT | −63.1 | 173.7 | −57.4 |
| P2/c | 17.09 | 8.63 | 9.70 | 90 | 155.5 | 90 | 1.246 | −33.63 | −11.72 | −24.94 | GT | −81.2 | 175.8 | −57.6 |
| P21/c | 6.81 | 11.80 | 12.10 | 90 | 142.4 | 90 | 1.245 | −35.40 | −11.31 | −25.76 | GT | −97.0 | 177.5 | 175.2 |
| Pbca | 13.80 | 11.20 | 7.51 | 90 | 90 | 90 | 1.273 | −35.45 | −11.31 | −26.04 | GT | 64.0 | 175.4 | 178.3 |
Alternatively, the most preferable Nπ–GG model predicted by the conformational analysis was used as an input in crystal structure prediction under the assumption of the same space group P21. The energetically lowest packing structure of the GG-type molecules is shown in Fig. 5b. The hydrogen bonding mode is different from that found in the X-ray crystal structure (Table 4).
| Model | Cell parameters | Density, g cm−3 | Total energy, kcal mol−1 | vdW energy, kcal mol−1 | Electrostatic energy, kcal mol−1 | Torsion angle/° | ||||||||
|---|---|---|---|---|---|---|---|---|---|---|---|---|---|---|
| a/Å | b/Å | c/Å | α/° | β/° | γ/° | τ1 | τ2 | τ3 | ||||||
| Observed | ||||||||||||||
| GT | 5.69 | 7.63 | 7.25 | 90 | 104.9 | 90 | 1.255 | — | — | — | 64.3 | 170.1 | 62.9 | |
| Calculated | ||||||||||||||
| Initial | Final | |||||||||||||
| GT | GT | 7.92 | 7.49 | 7.05 | 90 | 135.6 | 90 | 1.259 | −31.52 | −11.20 | −18.30 | 62.4 | 167.8 | 57.6 |
| GG | GG | 6.92 | 9.45 | 4.64 | 90 | 107.6 | 90 | 1.276 | −31.13 | −12.09 | −16.39 | 68.1 | 62.7 | 53.3 |
In this way, the packing structure predicted for the Nπ/GT model was found to reproduce the actually observed crystal structure well. However, the energy difference was small among the many possible structures of the different conformations, suggesting the possibility of the detection of another crystal modification by changing the preparation conditions.
The tautomeric state was checked between the Nπ–H and Nτ–H forms of the imidazole ring in the free base structure (H1). The GT-type conformation was predicted for the isolated molecule with the Nτ–H tautomeric form. For this Nτ–H tautomeric form, the packing structures predicted for the P21/c and Pbca space groups were found to show the lowest energy, although the energy difference among the various space groups was only 1–2 kcal mol−1 (Table 3). Good agreement with the X-ray-analyzed structure was found for the models of the space group P21. However, the dihedral angles τ1 −55.7° and τ2 −176.5° of the Nτ/GT form are different from the X-ray values (τ1 64.3° and τ2 170.1°). The hydrogen bonding mode of the Nτ/GT model (Fig. 6c) is slightly different from the X-ray structure. The intermolecular hydrogen bonds formed between the amino group and the imidazole Nτ–H ring of the two adjacent molecules along the b axis are lost. Accordingly, the intermolecular N–H⋯N hydrogen bonds are important for the stability of the packing structure of tautomeric conformation.
On the other hand, as seen in Fig. 6, the crystal structure of H1 predicted for the Nπ/GT model shows the intermolecular hydrogen bonds along the b axis, corresponding to the X-ray crystal structure. The Gibbs free energy calculation indicated that the crystal structure with the Nπ–H tautomeric form has a lower free energy than that of the Nτ–H tautomeric form by an energy difference 0.3 kcal mol−1 at room temperature (Fig. 6d). Conclusively, the most preferable conformation is the Nπ–H tautomeric GT structure for the free base compound (H1).
3.4 Tautomeric state of imidazole ring as checked by vibrational spectra data
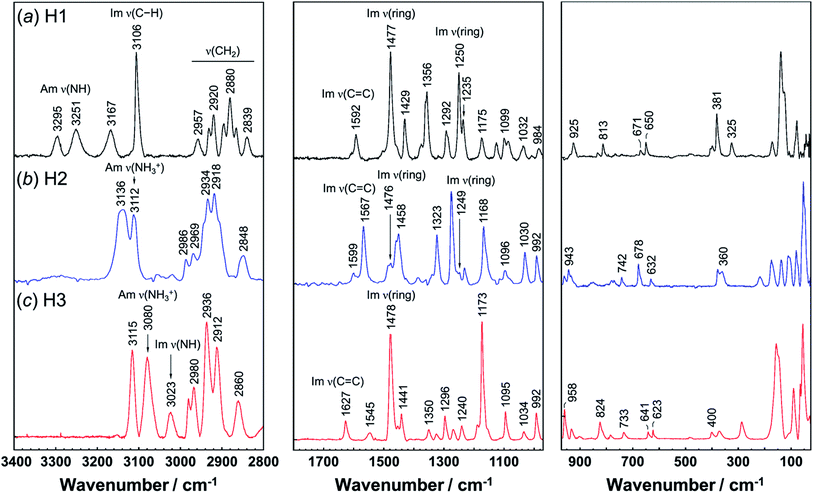
Vibrational spectral patterns are sensitive to the molecular conformation and packing structure of molecules. Thus, the reasonableness of the above-predicted structure models may be checked by comparing the calculated vibrational frequencies with the actually-observed data. The observed Raman and IR spectra of H1 are shown in Fig. 7 and 8, respectively. The band assignments were made by referring to the spectral data of related compounds such as imidazole, histidine, and histamine derivatives and the vibrational frequencies calculated by the DFT method.7,15–17,23,24,45 The vibrational frequencies and the peak assignments are listed in Table 5.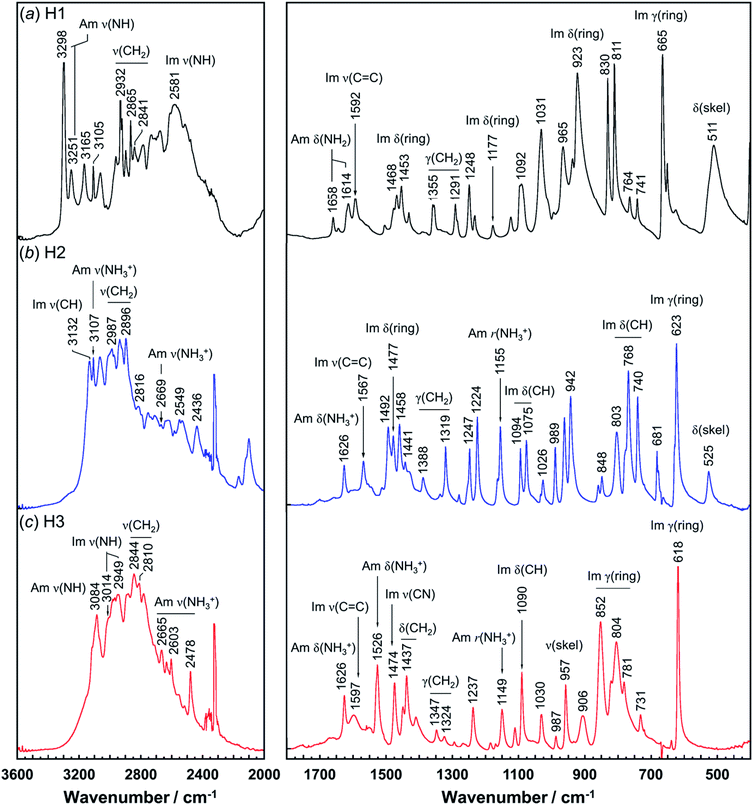 | ||
| Fig. 8 Infrared spectra of histamine species: (a) free base; H1, (b) monocation; H2, and (c) dication; H3. The spectra are shown in the 3600–2000 cm−1 and 1800–400 cm−1 region. | ||
| Free base (H1) | Monocation (H2) | Dication (H3) | Assignments | |||
|---|---|---|---|---|---|---|
| Raman | Infrared | Raman | IR | Raman | IR | |
| a Assignments: Am; amine, Im; imidazole ring, ν; stretching, δ; in-plane bending, γ; out-of-plane bending, r; rocking, ω; wagging, and skel; skeletal side-chain. | ||||||
| 3295 | 3298 | Am ν(NH) | ||||
| 3251 | 3251 | Am ν(NH) | ||||
| 3174 | Am ν(NH3+) | |||||
| 3167 | 3165 | 3136 | 3132 | 3115 | Im ν(CH) | |
| 3106 | 3105 | Im ν(CH) | ||||
| 3112 | 3105 | 3080 | 3084 | Am ν(NH3+) | ||
| 3023 | 3014 | Im ν(NH) | ||||
| 2967 | 2986 | 2987 | 2980 | ν(CH2) | ||
| 2957 | 2955 | 2969 | 2968 | ν(CH2) | ||
| 2957 | 2955 | ν(CH2) | ||||
| 2931 | 2932 | ν(CH2) | ||||
| 2920 | 2894 | 2918 | 2896 | ν(CH2) | ||
| 2880 | 2865 | 2861 | 2844 | ν(CH2) | ||
| 2839 | 2841 | 2848 | 2816 | 2810 | ν(CH2) | |
| 2669 | 2792 | 2665 | Am ν(NH3+) | |||
| 2581 | Im ν(NH) | |||||
| 1614 | 1626 | 1627 | 1626 | Im ν(C![[double bond, length as m-dash]](https://www.rsc.org/images/entities/char_e001.gif) C), Am δ(NH) C), Am δ(NH) |
||
| 1592 | 1592 | 1567 | 1567 | 1597 | Im ν(C![[double bond, length as m-dash]](https://www.rsc.org/images/entities/char_e001.gif) C) C) |
|
| 1545 | 1526 | Am δ(NH3+) | ||||
| 1477 | 1468 | 1476 | 1477 | 1478 | 1474 | Im ν(ring), Im δ(NH) |
| 1456 | 1453 | 1458 | 1458 | 1453 | 1454 | Im ν(CN), Im δ(NH) |
| 1429 | 1429 | 1441 | 1437 | δ(CH2) | ||
| 1356 | 1355 | 1385 | 1388 | 1350 | 1347 | ω(CH2) |
| 1292 | 1291 | 1248 | 1247 | ω(CH2) | ||
| 1250 | 1248 | 1224 | 1240 | 1237 | δ(CH2) | |
| 1175 | 1177 | 1173 | 1178 | Im δ(ring) | ||
| 1168 | 1155 | 1149 | Am r(NH3+) | |||
| 1099 | 1092 | 1096 | 1094 | 1095 | 1090 | Im δ(CH) |
| 1032 | 1031 | 1030 | 1026 | 1034 | 1030 | ν(skel) |
| 984 | 965 | 992 | 989 | 992 | 987 | Im δ(ring) |
| 925 | 923 | 943 | 942 | 901 | 906 | Im δ(ring) |
| 834 | 830 | 851 | 848 | 824 | 852 | Im γ(ring) |
| 671 | 665 | 678 | 681 | 641 | Im γ(ring) | |
| 650 | 628 | 632 | 623 | 623 | 618 | Im γ(ring) |
| 740 | 741 | 742 | 740 | 731 | Im γ(CH), r(CH2) | |
| 511 | 525 | δ(skel) | ||||
In the Raman spectra, the histamine of H1 shows two bands in the frequency region higher than 3200 cm−1, which are assigned to the N–H stretching mode (Am ν(NH)) of the hydrogen-bonded amine groups.7,23,24 These bands correspond to the infrared bands at 3295 and 3251 cm−1 (Fig. 8). These bands were reproduced well by the calculation with the small difference of 5−20 cm−1 (see Table S1, ESI†). However, for the H2 species, the infrared band of the ammonium N–H stretching vibration (Am ν(NH3+)) was detected at 2669 cm−1, at about 600 cm−1 lower than H1. In contrast, the Am ν(NH) bands of the H1 species are located at remarkably higher frequency positions (3295 and 3251 cm−1 in Raman spectra), indicating the weaker NH(Am)⋯N(Im) hydrogen bonds in the crystal lattice of the H1 species compared with the H2 species. However, it may be better to say that the intermolecular hydrogen bonds of the H2 molecules are quite strong. The Raman bands of Am ν(NH) were observed at 3112 and 2934 cm−1 for H2, and at 3080 cm−1 for H3 species. In the infrared spectra, the corresponding bands were detected at 3105 and 3084 cm−1 for the H2 and H3 compounds, respectively.7,24 The imidazole N–H stretching vibration (Im ν(NH)) of the H1 species is observed at 2581 cm−1 in the infrared spectra, which corresponds to the NH(Im)⋯N(Am) hydrogen bond interaction. The calculated vibrational frequency 2567 cm−1 is in good agreement with the observed value (see Table S1 and Fig. S2, ESI†). The bands at around 3100 cm−1 are assigned to the C–H stretching mode of the imidazole ring (Im ν(CH)). The bands in the region of 3000 to 2800 cm−1 are due to the CH2 stretching (ν(CH2)) modes of each histamine form.
The tautomeric equilibrium form of the imidazole ring can be checked using the bands of the imidazole C![[double bond, length as m-dash]](https://www.rsc.org/images/entities/char_e001.gif) C stretching (Im ν(C
C stretching (Im ν(C![[double bond, length as m-dash]](https://www.rsc.org/images/entities/char_e001.gif) C)), where the band position should be shifted depending on the Nπ–H and Nτ–H tautomeric forms.7,16,17,45 The vibrational frequency calculated for the Nπ–tautomer is 1587 cm−1, which is in good agreement with the observed value of 1592 cm−1, indicating H1 takes the Nπ tautomer form. This is consistent with the X-ray structure analysis. H2 shows the Raman band at 1567 cm−1, in good agreement with the value of 1550 cm−1 calculated for the Nτ–tautomer (see Table S1 and Fig. S3, ESI†). This is also in good accordance with the X-ray structure analysis. For the H3 species at low pH (Fig. 7c), the dominant peak of the Im ν(C
C)), where the band position should be shifted depending on the Nπ–H and Nτ–H tautomeric forms.7,16,17,45 The vibrational frequency calculated for the Nπ–tautomer is 1587 cm−1, which is in good agreement with the observed value of 1592 cm−1, indicating H1 takes the Nπ tautomer form. This is consistent with the X-ray structure analysis. H2 shows the Raman band at 1567 cm−1, in good agreement with the value of 1550 cm−1 calculated for the Nτ–tautomer (see Table S1 and Fig. S3, ESI†). This is also in good accordance with the X-ray structure analysis. For the H3 species at low pH (Fig. 7c), the dominant peak of the Im ν(C![[double bond, length as m-dash]](https://www.rsc.org/images/entities/char_e001.gif) C) band was found at 1627 and 1626 cm−1 in the Raman and infrared spectra, respectively.46 The Raman peak at 1545 cm−1 and the IR peak at 1526 cm−1 are assigned to the ammonium in-plane bending mode, consistent with the calculated values of about 1530 cm−1 in both the Raman and infrared spectra (see Table S1 and Fig. S4, ESI†).
C) band was found at 1627 and 1626 cm−1 in the Raman and infrared spectra, respectively.46 The Raman peak at 1545 cm−1 and the IR peak at 1526 cm−1 are assigned to the ammonium in-plane bending mode, consistent with the calculated values of about 1530 cm−1 in both the Raman and infrared spectra (see Table S1 and Fig. S4, ESI†).
3.5 Hydrogen bonding and temperature-dependent experiments
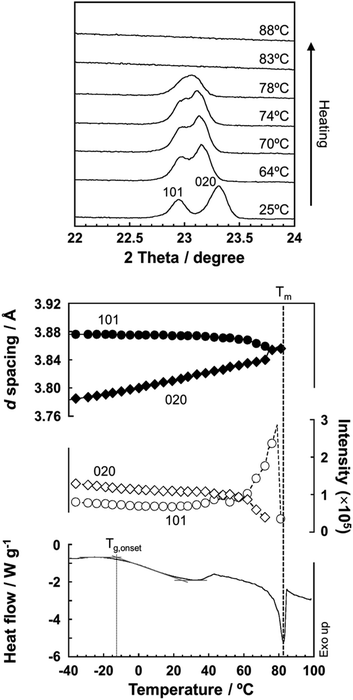
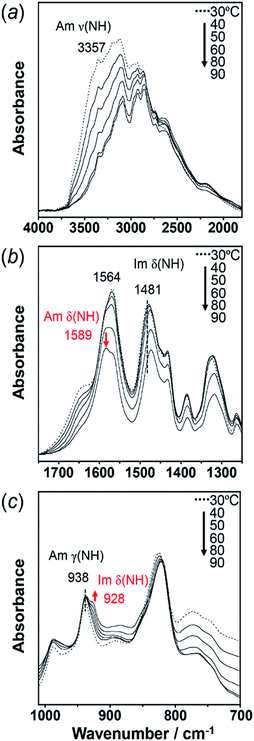
As predicted by the computer simulations, there are many possibilities for the crystal modification of the histamine species under the various conditions. This situation suggests that the crystal form may be changed by changing the temperature or the possibility of phase transition in the heating process. Then, by focusing on the histamine free base (H1), X-ray diffraction (XRD) measurements were performed in the high-temperature region. The thus-measured XRD patterns are shown in Fig. 9 (see Fig. S5, ESI†). No clear phase transition was detected at a temperature below the melting point (83 °C). This suggests that the crystal structure of the H1 species remained stable up to the high temperature region.To check the occurrence of conformational changes in the H1 molecules in the heating process, the temperature-dependent FTIR spectra were measured, as shown in Fig. 10. As the temperature increased, the peak at 3357 cm−1 [hydrogen-bonded Am ν(NH)] shifted to the lower frequency side and became constant above 60 °C (Fig. 11a). Similar behavior was also detected for the peak at 938 cm−1 [Am γ(NH)]. The lower frequency shift of the NH(Am) band in the 3350 cm−1 region indicates the strengthening of the NH(Am)⋯N(Im) intramolecular hydrogen bond in H1 in the temperature region higher than 40 °C (see the DSC thermogram in Fig. 9). The relative intensity ratio of the Am γ(NH) 938 cm−1 band increased in the heating process up to 60 °C. This observation also suggests an increase in the population of these hydrogen bonds.
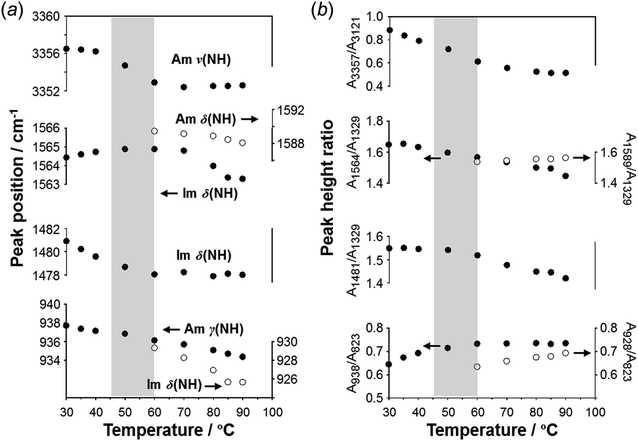 | ||
| Fig. 11 Temperature dependence of (a) peak position (cm−1) and (b) intensity ratio of the various IR peaks measured for the H1 species. | ||
Above 60 °C, new peaks appeared at 1589 and 928 cm−1, which are assigned to the Am δ(NH) and Im δ(NH) modes as indicated by the normal mode calculation, respectively. These observations may correspond to the increase in hydrogen-bonding-free N atoms in the high temperature region.
3.6 Proton conductivity of H1
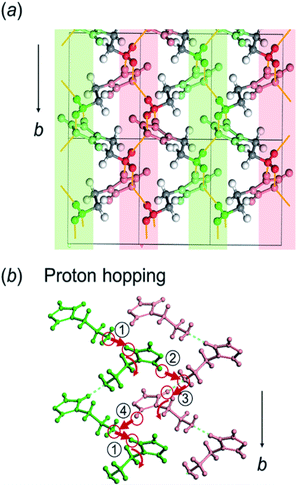
Here, the crystal structure of the H1 species is reviewed again in detail. As shown in Fig. 12, intermolecular hydrogen bonds are formed between the imidazole rings and the end NH2 units. These hydrogen bonds form networks in the ab planes. These networks are alternately arrayed along the c axis, as indicated by the green and pink colors in Fig. 12a. The protons may transfer effectively between the imidazole rings and the NH2 units along the b axis. The route for proton transfer through the hopping motion is illustrated in Fig. 12b. A proton of the NH2 group of a histamine molecule jumps to the N atom of the imidazole ring of a neighboring molecule. This proton on the imidazole ring will be transferred to another NH2 group through the 180° rotational motion of the ring. Then, similar proton hopping may occur continuously (1–2–3–4) between the neighboring molecules. In this way, effective and cooperative proton conduction is predicted to occur in the crystal lattice of the H1 species.This prediction was checked by actually performing in situ impedance measurements during the heating process of the H1 sample (see Fig. S6, ESI†). As shown in Fig. 13, the proton conductivity in the solid state increased steeply with an increase in temperature (30 °C to 60 °C) and then decreased in the temperature region higher than the small endothermic peak in the DSC profile. This behavior of the proton conductivity corresponds well to the IR spectral changes observed in Fig. 11. The highest conductivity observed was 2.81 × 10⁻⁴ S cm−1 at 60 °C. In Table 6, the proton conductivity of the H1 species is compared with that reported for various compounds with the hydrogen bonds. The present value is 1 order higher than that reported in ref. 33.
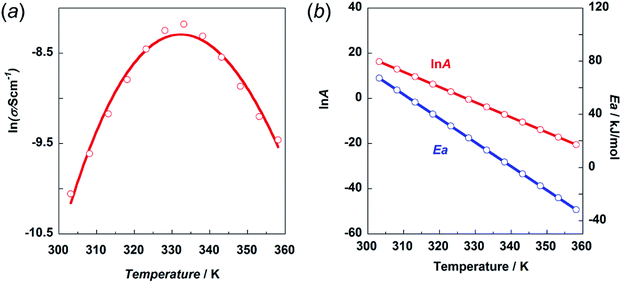 | ||
Fig. 13 (a) Temperature dependence of proton conductivity (s) in the natural logarithmic form. (b) Frequency factor (ln![[thin space (1/6-em)]](https://www.rsc.org/images/entities/char_2009.gif) A) and activation energy Ea vs. temperature. A) and activation energy Ea vs. temperature. | ||
| Sample | σ (S cm−1) | Ea (kJ mol−1) |
|---|---|---|
| Imidazole49 | 1.65 × 10⁻³ | 23 (at 348 K) |
| Ethylene oxide tethered imidazole50 | ||
| Imi-1EO | ∼10−5 | 48 |
| Imi-5EO | ∼10−5 | 60 |
| Imidazolium carboxylates51 | ||
| Im-Suc (parallel to HB) | 4.94 × 10⁻⁷ | 320 |
| Im-Suc (perpendicular to HB) | 3.55 × 10⁻⁹ | 378 |
| Im-Glu (parallel to HB) | 2.40 × 10⁻⁶ | 87 |
| Im-Glu (perpendicular to HB) | 5.92 × 10⁻⁸ | 157 |
| Histamine33 | 9.40 × 10⁻⁶ | |
| H1 (this work) | 2.70 × 10⁻⁴ | 18.9 (at 330 K) |
Then, the activation energy was estimated and compared with that of other compounds, as listed in Table 6. The H1 species melted at around 83 °C. Accordingly, the proton conductivity measurement was performed in the temperature region below the melting point, and thus the proton transfer is speculated to occur under the proton hopping mechanism in the solid state. As shown in Fig. 13, the proton conductivity showed the maximal peak at around 330 K. This cannot be explained by introducing a simple Arrhenius type equation:
σ = A![[thin space (1/6-em)]](https://www.rsc.org/images/entities/char_2009.gif) e−Ea/[R(T−To)] e−Ea/[R(T−To)]
| (2) |
A = A0![[thin space (1/6-em)]](https://www.rsc.org/images/entities/char_2009.gif) eao+a1T eao+a1T
| (3) |
Simultaneously, the activation energy is also dependent on temperature, which may decrease with an increment in temperature. The activation energy, Ea, is now assumed to have the following shape: Ea = Eo + E′T, where Eo and E′ are adjustable parameters. Then, the conductivity due to a Grotthuss-type mechanism47,48 may be expressed as:
σ = A0![[thin space (1/6-em)]](https://www.rsc.org/images/entities/char_2009.gif) eao+a1T eao+a1T![[thin space (1/6-em)]](https://www.rsc.org/images/entities/char_2009.gif) e−(Eo+E′T)/[R(T−To)] e−(Eo+E′T)/[R(T−To)]
| (4) |
In the present case, To was ignored for simplicity. The natural logarithm of σ is expressed as a function of temperature as follows:
ln(σ) = ln![[thin space (1/6-em)]](https://www.rsc.org/images/entities/char_2009.gif) Ao + [ao + a1T − (Eo + E′T)/(RT)] Ao + [ao + a1T − (Eo + E′T)/(RT)]
| (5) |
The experimental data were fitted using eqn (5), as shown in Fig. 13a. The temperature dependence of the ln![[thin space (1/6-em)]](https://www.rsc.org/images/entities/char_2009.gif) A and Ea values is shown in Fig. 13b. The physical meaning of these temperature-dependent values is now clear as mentioned above. The Ea value becomes almost zero or rather minus in the temperature region above the maximum peak. However, the frequency factor also becomes lower in this region, resulting in relatively low conductivity.
A and Ea values is shown in Fig. 13b. The physical meaning of these temperature-dependent values is now clear as mentioned above. The Ea value becomes almost zero or rather minus in the temperature region above the maximum peak. However, the frequency factor also becomes lower in this region, resulting in relatively low conductivity.
As seen in Table 6, the proton conductivity of imidazolium compounds is quite low, which can be attributed to their high activation energy. Imidazole itself has one order higher proton conductivity than H1 species. The Ea is much lower for the H1 species in the same temperature region. The thermal activity of the smaller imidazole molecule may be higher than that of H1 with relatively complicated thermal motion, including the trans–gauche conformational exchange. Also, the frequency factor of imidazole may be larger than that of H1.
4. Conclusions
Herein, we described the molecular conformation and molecular packing structure for the various types of histamine species created under various pH conditions. In addition to the conformational variation of the CH2–CH2–NH2 segment, the imidazole ring shows tautomerism of the N atom, making the description of the molecular structure of the histamine species quite complicated. Initially, a conformational analysis was performed, allowing us to successfully predict the GG, GT and TT conformers for the isolated molecules. Depending on the ionic state, the conformational stability changes. Next, we calculated the packing structure of these variable molecules. When the histamine molecules are packed in the crystal lattice, the lattice energy was found to change sensitively depending on the ionic states. In particular, intra- and intermolecular hydrogen bonds were found to play an important role in the relative stability of the crystal lattice. The thus-predicted structures were found to correspond well to the actual X-ray-analyzed crystal structures. Since the conformational state of histamine is complicated, the assignment of the IR and Raman bands is useful for the characterization of these histamine species. Theoretical calculation was performed to determine the vibrational modes of these histamine species. The vibrational spectroscopic data will be a useful guide for the identification of histamine species in various states.As expected from the hydrogen-bonded network of the crystal lattice, this compound is expected to exhibit high proton conductivity at high temperature. The proton conductivity was actually measured for histamine (free base form) for the first time, which showed the maximum peak at around 60 °C during the heating process in the solid state. The temperature-dependent IR spectral data showed the deflection point in this temperature region, suggesting the good correlation between the proton conductivity and the hydrogen bond network structure.
As mentioned above, histamine is very important in the field of biological and medical science. Thus far, the structural study of histamine has been widely reported in the literature; however, the systematic investigations were not thorough. We believe the present results may contribute to the further development of histamine science.
Conflicts of interest
There are no conflicts to declare.Acknowledgements
The authors would like to acknowledge the scholarships from the Thailand Research Fund (TRF) through the Royal Golden Jubilee PhD Program (Grant No. PHD/0072/2556, 3.C.CM/56/P.1.N.XX to K. K., K. T. and P. N.). The authors also would like to extend their appreciation to Professor Suwabun Chirachanchai, Chulalongkorn University, Thailand, for his kind permission to perform the proton conductivity measurement in his laboratory. K. T. acknowledges the financial support by the MEXT in “the Strategic Project to Support the Formation of Research Bases at Private Universities” (2015-2019). P. N. acknowledges the partially financial support by the TRF Distinguished Research Professor Award (DPG6080002).References
- O. B. Reite, Physiol. Rev., 1972, 52, 778–819 CrossRef CAS PubMed.
- S. Micallef, H. Stark and A. Sasse, Life Sci., 2013, 93, 487–494 CrossRef CAS PubMed.
- P. J. Barnes, Pulm. Pharmacol. Therapeut., 2001, 14, 329–339 CrossRef CAS PubMed.
- E. Zampeli and E. Tiligada, Br. J. Pharmacol., 2009, 157, 24–33 CrossRef CAS PubMed.
- G. C. Paesen, P. L. Adams, K. Harlos, P. A. Nuttall and D. I. Stuart, Mol. Cell, 1999, 3, 661–671 CrossRef CAS PubMed.
- A. M. ter Laak, H. Timmerman, R. Leurs, P. H. J. Nederkoorn, M. J. Smit and G. M. Donné-Op den Kelder, J. Comput.-Aided Mol. Des., 1995, 9, 319–330 CrossRef CAS PubMed.
- F. J. Ramírez, I. Tuñón, J. A. Collado and E. Silla, J. Am. Chem. Soc., 2003, 125, 2328–2340 CrossRef PubMed.
- J. J. Bonnet and J. A. Ibers, J. Am. Chem. Soc., 1973, 95, 4829–4833 CrossRef CAS.
- K. Prout, S. R. Critchley and C. R. Ganellin, Acta Crystallogr., Sect. B: Struct. Crystallogr. Cryst. Chem., 1974, 30, 2884–2886 CrossRef.
- T. Yamane, T. Ashida and M. Kakudo, Acta Crystallogr., Sect. B: Struct. Crystallogr. Cryst. Chem., 1973, 29, 2884–2891 CrossRef CAS.
- S. Louhibi, I. Belfilali, L. Boukli-Hacene and T. Roisnel, Acta Crystallogr., Sect. E: Crystallogr. Commun., 2015, 71, o844–o845 CrossRef CAS PubMed.
- M. V. Veidis, G. J. Palenik, R. Schaffrin and J. Trotter, J. Chem. Soc. A, 1969, 1, 2659–2666 RSC.
- L. B. Cole and E. M. Holt, Acta Crystallogr., Sect. C: Cryst. Struct. Commun., 1990, 46, 1737–1739 CrossRef.
- C. R. Ganellin, J. Pharm. Pharmacol., 1973, 25, 787–792 CrossRef CAS PubMed.
- E. D. Raczyńska, M. Darowska, M. K. Cyrański, M. Makowski, T. Rudka, J.-F. Gal and P.-C. Maria, J. Phys. Org. Chem., 2003, 16, 783–796 CrossRef.
- J. A. Collado, I. Tuñón, E. Silla and F. J. Ramírez, J. Phys. Chem. A, 2000, 104, 2120–2131 CrossRef CAS.
- A. Torreggiani, M. Tamba, S. Bonora and G. Fini, Biopolymers, 2003, 72, 290–298 CrossRef CAS PubMed.
- A. Hernández-Laguna, Z. Cruz-Rodriguez, Y. G. Smeyers, G. A. Arteca, J. L. M. Abboud and O. Tapia, J. Mol. Struct.: THEOCHEM, 1995, 335, 77–87 CrossRef.
- P. I. Nagy, G. J. Durant, W. P. Hoss and D. A. Smith, J. Am. Chem. Soc., 1994, 116, 4898–4909 CrossRef CAS.
- L. B. Kier, J. Med. Chem., 1968, 11, 441–445 CrossRef CAS.
- A. Wojtczak, M. Jaskolski and Z. Kosturkiewicz, Acta Crystallogr., Sect. C: Cryst. Struct. Commun., 1983, 39, 545–547 CrossRef.
- L. B. Cole and E. M. Holt, J. Chem. Soc., Perkin Trans. 1, 1986, 1, 151–154 RSC.
- J. A. Collado and F. J. Ramírez, J. Raman Spectrosc., 1999, 30, 391–397 CrossRef CAS.
- J. A. Collado and F. J. Ramírez, J. Raman Spectrosc., 2000, 31, 925–931 CrossRef CAS.
- C. R. Ganellin, E. S. Pepper, G. N. J. Port and W. G. Richards, J. Med. Chem., 1973, 16, 610–616 CrossRef CAS.
- N. S. Ham, A. F. Casy and R. R. Ison, J. Med. Chem., 1973, 16, 470–475 CrossRef CAS.
- M. Kraszni, J. Kökösi and B. Noszál, J. Chem. Soc., Perkin Trans. 2, 2002, 914–917 RSC.
- A. Wojtczak, M. Jaskolski and Z. Kosturkiewicz, Acta Crystallogr., Sect. C: Cryst. Struct. Commun., 1988, 44, 1779–1781 CrossRef.
- C. Jarumaneeroj, K. Tashiro and S. Chirachanchai, J. Power Sources, 2014, 249, 185–192 CrossRef CAS.
- A. Pangon, P. Totsatitpaisan, P. Eiamlamai, K. Hasegawa, M. Yamasaki, K. Tashiro and S. Chirachanchai, J. Power Sources, 2011, 196, 6144–6152 CrossRef CAS.
- P. Totsatitpaisan, K. Tashiro and S. Chirachanchai, J. Phys. Chem. A, 2008, 112, 10348–10358 CrossRef CAS PubMed.
- K. D. Kreuer, A. Fuchs, M. Ise, M. Spaeth and J. Maier, Electrochim. Acta, 1998, 43, 1281–1288 CrossRef CAS.
- D. Umeyama, S. Horike, M. Inukai, Y. Hijikata and S. Kitagawa, Angew. Chem., Int. Ed., 2011, 50, 11706–11709 CrossRef CAS PubMed.
- A. Altomare, G. Cascarano, C. Giacovazzo and A. Guagliardi, J. Appl. Crystallogr., 1993, 26, 343–350 CrossRef.
- CrystalStructure 4.2, Crystal Structure Analysis Package, Rigaku Corporation, Tokyo 196-8666, Japan, 2000–2015 Search PubMed.
- P. Nimmanpipug, J. Yana, V. S. Lee, S. Vannarat, S. Chirachanchai and K. Tashiro, J. Power Sources, 2013, 229, 141–148 CrossRef CAS.
- P. Nimmanpipug, T. Laosombat, V. Sanghiran Lee, S. Vannarat, S. Chirachanchai, J. Yana and K. Tashiro, Chem. Eng. Sci., 2015, 137, 404–411 CrossRef CAS.
- Materials Studio, Accelrys Software Inc, 2011 Search PubMed.
- K. Kodchakorn, V. S. Lee, J. Yana and P. Nimmanpipug, Surf. Coat. Technol., 2016, 306, 35–40 CrossRef CAS.
- H. Sun, P. Ren and J. R. Fried, Comput. Theor. Polym. Sci., 1998, 8, 229–246 CrossRef CAS.
- K. Tashiro, P. Nimmanpipug and O. Rangsiman, J. Phys. Chem. B, 2002, 106, 12884–12895 CrossRef CAS.
- P. Nimmanpipug, K. Tashiro and O. Rangsiman, J. Phys. Chem. B, 2003, 107, 8343–8350 CrossRef CAS.
- U. Thewalt and C. E. Bugg, Acta Crystallogr., Sect. B: Struct. Crystallogr. Cryst. Chem., 1972, 28, 1767–1773 CrossRef CAS.
- G. J. Durant, C. R. Ganellin, D. W. Hills, P. D. Miles, M. E. Parsons, E. S. Pepper and G. R. White, J. Med. Chem., 1985, 28, 1414–1422 CrossRef CAS.
- J. G. Mesu, T. Visser, F. Soulimani and B. M. Weckhuysen, Vib. Spectrosc., 2005, 39, 114–125 CrossRef CAS.
- W. F. Reynolds, I. R. Peat, M. H. Freedman and J. R. Lyerla, J. Am. Chem. Soc., 1973, 95, 328–331 CrossRef CAS PubMed.
- P. Leiderman, R. Gepshtein, A. Uritski, L. Genosar and D. Huppert, J. Phys. Chem. A, 2006, 110, 9039–9050 CrossRef CAS PubMed.
- C. J. de Grotthuss, Biochim. Biophys. Acta, 2006, 1757, 871–875 CrossRef CAS PubMed.
- A. Kawada, A. R. McGhie and M. M. Labes, J. Chem. Phys., 1970, 52, 3121–3125 CrossRef CAS.
- G. R. Goward, M. F. H. Schuster, D. Sebastiani, I. Schnell and H. W. Spiess, J. Phys. Chem. B, 2002, 106, 9322–9334 CrossRef CAS.
- Y. Sunairi, A. Ueda, J. Yoshida, K. Suzuki and H. Mori, J. Phys. Chem. C, 2018, 122, 11623–11632 CrossRef CAS.
Footnote |
| † Electronic supplementary information (ESI) available. CCDC 1912431, 1912432 and 1912450. For ESI and crystallographic data in CIF or other electronic format see DOI: 10.1039/c9ra03418h |
| This journal is © The Royal Society of Chemistry 2019 |

