 Open Access Article
Creative Commons Attribution 3.0 Unported Licence
Highly efficient red-emitting Ca2YSbO6:Eu3+ double perovskite phosphors for warm WLEDs†
Meijiao Liua,
Biao Shenb,
Keyuan Wangb,
Jiasong Zhong *b and
Daqin Chen
 *c
*c
aDepartment of Chemistry, Zhejiang Sci-Tech University, Hangzhou 310018, China
bCollege of Materials and Environmental Engineering, Hangzhou Dianzi University, Hangzhou 310018, China. E-mail: jiasongzhong@hdu.edu.cn
cCollege of Physics and Energy, Fujian Normal University, Fuzhou, 350117, P. R. China. E-mail: dqchen@fjnu.edu.cn
First published on 3rd July 2019
Abstract
Highly efficient red-emitting Eu3+-doped double perovskite Ca2YSbO6 phosphors have been successfully prepared by the traditional high-temperature solid state method. The phase purity, photoluminescence and decay properties as a function of the Eu3+ concentration have been investigated in detail. The XRD results demonstrate that all of the obtained phosphors can be assigned to a pure monoclinic structure. Upon 464 nm excitation, a strong red emission situated at 614 nm (5D0–7F2) indicates that Eu3+ ions occupy a site with low symmetry. The quenching concentration of Eu3+ ions reaches as high as 70 mol% and the quenching mechanism is discussed. Especially, the prepared phosphor exhibits a high quantum efficiency of 92.1% and superior thermal stability, with PL intensity at 423 K up to 81.6% of that at room temperature. Moreover, a warm white light with a correlated color temperature of 4720 K and a color rendering index of 82.6 is achieved by fabricating a Ca2YSbO6:Eu3+ phosphor in a 460 nm blue-InGaN chip together with the commercial Y3Al5O12:Ce3+ yellow phosphor.
1. Introduction
In the past couple of decades, white light-emitting diodes (WLEDs), as the fourth generation of illumination appliances, have received significant interest due to their superior characteristics such as low electricity consumption, long operating lifetime, high brightness, good reliability, fast response, environmental friendliness, etc.1–4 Currently, the mainstream commercial phosphor-converted WLEDs (pc-WLEDs) are realized by combining a blue InGaN LED chip with a yellow YAG:Ce3+ phosphor.5,6 Although this combination has some advantages, this kind of white light demonstrates a low color rending index (CRI) and high correlated color temperature (CTT) owing to the deficiency of red light in the emission spectra.7 Therefore, in order to improve the CRI and CCT of pc-WLEDs, much effort has been devoted to develop a novel red phosphor.8,9 However, the most widely used rare earth ion activated red phosphors such as Y2O3:Eu3+, Y2O2S:Eu3+ and CaAlSiN3:Eu2+ also exhibit several limitations including low efficiency, chemical instability and complicated preparation processes, which prevent their broad application for lighting.10–12 Thus, it is urgent to search for a novel red phosphor with excellent stability, high conversion efficiency and low concentration quenching, which can be synthesized easily.As the most important factor to acquire efficient red-emitting phosphors, different host lattices will demonstrate diverse optical properties due to the surrounding of the given optical center.13 It is well known that Eu3+ has generally been used as a luminescent center, however, the high efficiency red emission is mainly to be blamed for the low quenching concentration and improper coordination environment.14 Therefore, it is essential to find a suitable host matrix, in which the crystal structure benefits an increase in distance among the Eu3+ ions.15 Recently, ordered double perovskite type oxides with the general formula A2BB′O6 (A = Ca, Sr, Ba, Y, La, Gd; B = Y, La, Gd, Mg, Zn, Li; B′ = Sb, Ta, Nb, Ti) or AA′BB′O6 (A = Ca, Sr, Ba, Na, Li; A′ = Y, La, Gd; B = Mg, Zn; B′ = W, Mo, Sb, Ta, Nb) have been intensively investigated owing to their good thermal stability and chemical properties.10,16 In typical crystal structures of double perovskites, both the B and B′ sites are coordinated with six oxygen atoms by corner-sharing alternately, while the A (or A′) site is coordinated with eight or twelve oxygen atoms based on the distortion of the crystal structure. Besides, the BO6 and B′O6 sites can reduce the symmetry of the A (or A′) ones and produce various coordination environments for doping with rare earth ions.17,18 Therefore, the double perovskite oxide is a suitable candidate matrix for phosphors by structurally modulating.
Hence, we chose Ca2YSbO6 as the host for a red phosphor, in which the B and B′ sites are occupied by Y3+ and Sb5+ ions, respectively. In addition, Ca2YSbO6 belongs to an ordered perovskite structure and has a monoclinic crystal system with the space group of P21/m, which is very suitable for luminescent ions.19 A Y3+ ion and six O2− ions are coordinated to form [YO6] octahedrons, providing the opportunity for an Eu3+ ion to occupy the Y3+ lattice according to its similar ionic radius and the same valence. Recently, Bi3+ and Eu3+ ion co-doped Ca2YSbO6 phosphor materials have been synthesized, and the luminescence enhancement mechanism was also investigated.10 However, the influences of structure symmetry on high concentration quenching, thermal stability and quantum efficiency of Ca2YSbO6:Eu3+ red phosphors have not been studied in detail. Besides, the potential application for WLEDs is also unconsidered. Therefore, in this study, a series of Ca2Y1−xEuxSbO6 (0.1 ≤ x ≤ 1.0) red-emitting phosphors have been prepared by the conventional high temperature solid-state reaction. In addition, the relationship between crystal structure and optical performance is also investigated and discussed in detail.
2. Experimental section
2.1 Preparation samples
A series of Ca2Y1−xSbO6:xEu3+ (x = 0.1, 0.2, 0.3, 0.4, 0.5, 0.6, 0.7, 0.8, 0.9, and 1.0) phosphors were synthesized by the high-temperature solid state reaction method. Raw materials of CaCO3 (99.9%), Y2O3 (99.99%), Sb2O5 (99.99%) and Eu2O3 (99.99%) were weighed according to the stoichiometric ratio and ground thoroughly in an agate mortar for 30 min. After that, the mixtures were put into alumina crucibles and sintered at 1400 °C for 4 h. Subsequently, the final products were cooled to room temperature and ground again for further characterization.2.2 Characterization
The crystal structure and phase purity of the final products were recorded on a MiniFlex 600 X-ray diffractometer with CuKα radiation (λ = 1.5405 Å) at a scanning rate of 1° min−1 in the 2θ range from 10° to 80°. The crystal structure parameters were refined by the Rietveld method using the General Structure Analysis System (GSAS). The morphology of the as-obtained product was studied using an FEI Apreo HiVac scanning electron microscope (SEM). The photoluminescence excitation (PLE) and emission (PL) spectra as well as luminescence decay lifetimes of the prepared phosphors were performed on an Edinburgh FS5 spectrometer using a 150 W continuous and pulsed xenon lamp as the excitation source, respectively. The internal quantum efficiency (IQE) of the synthesized phosphors was recorded on the Edinburgh FS5 spectrometer using an integrating sphere coated with BaSO4. The temperature dependent emission spectra were measured using a home-made temperature control system in the temperature range of 303–523 K.2.3 Fabrication of WLEDs
The WLED devices were fabricated with the commercial YAG:Ce3+ yellow phosphor (purchased from XinLi Illuminant Co. LTD) and blue GaN chips (∼460 nm) with/without the as-prepared Ca2YSbO6:Eu3+ red phosphor. The mass ratio of yellow phosphor versus red one was 1![[thin space (1/6-em)]](https://www.rsc.org/images/entities/char_2009.gif) :
:![[thin space (1/6-em)]](https://www.rsc.org/images/entities/char_2009.gif) 3. These phosphors were mixed with epoxy resin thoroughly and coated on the surface of the LED chips. The photoelectric parameters of the assembled WLEDs, including electroluminescence (EL) spectra, color rendering index (CRI), correlated color temperature (CCT), and luminescent efficiency (LE), were collected using an integrating sphere equipped with a CCD detector (HAAS-2000).
3. These phosphors were mixed with epoxy resin thoroughly and coated on the surface of the LED chips. The photoelectric parameters of the assembled WLEDs, including electroluminescence (EL) spectra, color rendering index (CRI), correlated color temperature (CCT), and luminescent efficiency (LE), were collected using an integrating sphere equipped with a CCD detector (HAAS-2000).
3. Results and discussion
3.1 Phase characterization and morphology analysis
The representative Ca2YSbO6:0.1Eu3+ sample was measured using powder X-ray diffraction (XRD), and the related data were analyzed using the Rietveld refinement method, as illustrated in Fig. 1a. Owing to the absence of structural information on Ca2YSbO6, we used the crystallographic data of Ca3TeO6 (ICSD #230130) as the initial structural model.10 The final refinement results of Ca2YSbO6:Eu3+ are listed in Table S1,† which index to a monoclinic structure with the lattice parameters a = 5.611 Å, b = 5.806 Å, c = 8.057 Å, and V = 262.48 Å3. The enlargement in cell volume certifies that the smaller Y3+ (r = 1.019 Å, CN = 8) lattice has been successful replaced by the larger Eu3+ (r = 1.066 Å, CN = 8) ions in the Ca2YSbO6. The schematic illustration of the Ca2YSbO6 structure is displayed in Fig. 1b, in which the Y3+ and Sb5+ ions form an alternative arrangement of [YO6] and [SbO6] octahedrons by sharing an O atom. Especially, the abundant [YO6] provides a better opportunity for Eu3+ ions to occupy the Y3+ lattice.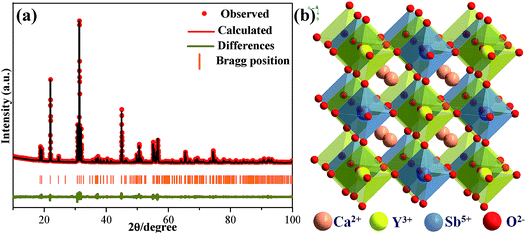 | ||
| Fig. 1 (a) Rietveld refinement XRD pattern of Ca2YSbO6:0.1Eu3+ sample. (b) Crystal structure of Ca2YSbO6. | ||
The phase structures of the as-obtained Ca2YSbO6:Eu3+ phosphors with various Eu3+ concentrations were verified by XRD, as demonstrated in Fig. 2a. All the diffraction peak positions and relative intensities of the products appear at the same angles. No impurity and other phases can be found even with a doping concentration of 100 mol%, indicating that the final products have been successfully prepared and the doping with Eu3+ ions does not affect the crystal structure of the Ca2YSbO6 lattice. Magnification of the dominant diffraction peaks ranging from 30–33° is presented in Fig. 2b. It can be clearly seen that these peaks shift slightly to a lower angle value with the increase in Eu3+ concentration. This phenomenon can be explained according to Bragg’s equation, 2d![[thin space (1/6-em)]](https://www.rsc.org/images/entities/char_2009.gif) sin
sin![[thin space (1/6-em)]](https://www.rsc.org/images/entities/char_2009.gif) θ = nλ, in which θ represents diffraction angle, d corresponds to interplanar distance, and n and λ are constants. Based on the effective ionic radii and the same valence state, Eu3+ (r = 1.066 Å, CN = 8) ions should substitute the Y3+ (r = 1.019 Å, CN = 8) lattice. Thus, the peak shifting is attributed to the replacement of the smaller Y3+ ions by larger Eu3+ ones. This result further indicates that Eu3+ ions have successfully entered into the Ca2YSbO6 lattice.
θ = nλ, in which θ represents diffraction angle, d corresponds to interplanar distance, and n and λ are constants. Based on the effective ionic radii and the same valence state, Eu3+ (r = 1.066 Å, CN = 8) ions should substitute the Y3+ (r = 1.019 Å, CN = 8) lattice. Thus, the peak shifting is attributed to the replacement of the smaller Y3+ ions by larger Eu3+ ones. This result further indicates that Eu3+ ions have successfully entered into the Ca2YSbO6 lattice.
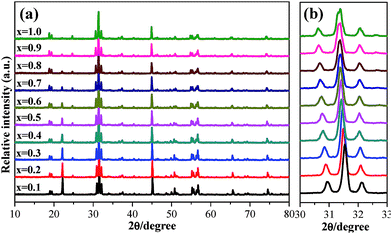 | ||
| Fig. 2 (a) XRD patterns of Ca2YSbO6:xEu3+ with various Eu3+ content. (b) Partial enlarged diffraction peaks in the region between 30° and 33°. | ||
The surface morphology of the obtained Ca2Y0.3SbO6:0.7Eu3+ sample was measured using SEM analysis, as illustrated in Fig. S1.† Regular phosphor particles with the size range from 0.5 to 2.5 μm can be observed.
3.2 Luminescence properties
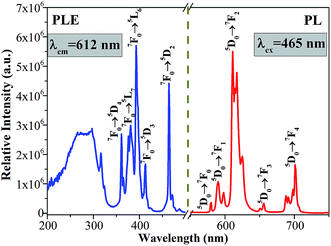
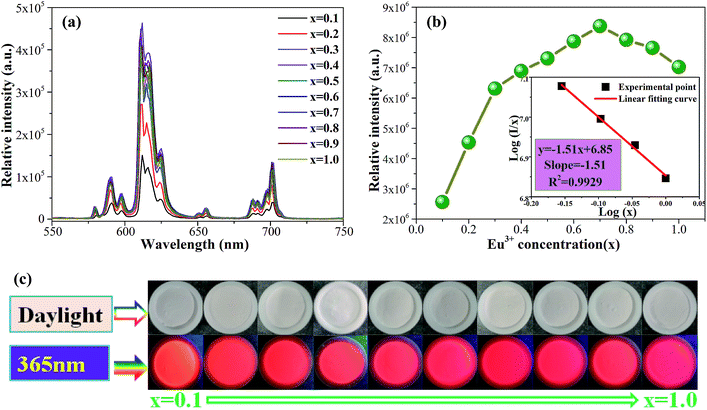
The PLE and PL spectra of the as-synthesized Ca2Y0.3SbO6:0.7Eu3+ powders are given in Fig. 3. When monitored at 612 nm, the PLE spectrum consists of several sharp peaks in the range of 350–500 nm and a broad band ranging from 200–350 nm, which are ascribed to the Eu3+ ions’ characteristic inner-4f transitions and the charge transfer band (CTB) of the O2−–Eu3+ interaction, respectively. The sharp peaks located at 316 nm, 361 nm, 380 nm, 393 nm, 413 nm and 464 nm are mainly attributed to the 7F0 → 5H5, 7F0 → 5D4, 7F0 → 5L7, 7F0 → 5L6, 7F0 → 5D3 and 7F0 → 5D2 transitions of the Eu3+ ion, respectively. Among them, two of the strongest sharp peaks at 393 nm and 464 nm can be found, which are in good agreement with the emission wavelength of NUV and blue LED chips.20 Upon 464 nm excitation, the characteristic emission peaks of Eu3+ ions corresponding to the 5D0 → 7FJ (J = 0, 1, 2, 3, 4) transitions are clearly observed. Especially, the most intense emission peak situated at 612 nm results from the electric dipole transition 5D0 → 7F2, which demonstrates that Eu3+ occupies a site with low symmetry in the double perovskite Ca2YSbO6 lattice.21,22 This non-inversion center environment of Eu3+ ions is beneficial to acquire a red phosphor with high color purity.23In order to study the effect of Eu3+ concentration on the luminescence, the PL spectra of Ca2Y1−xSbO6:xEu3+ (0.1 ≤ x ≤ 1.0) samples under the excitation of 464 nm are collected and presented in Fig. 4a. All of the samples display similar spectral profiles with the dominant red emission band located at 612 nm. As expected, the emission intensity was enhanced with the increase in Eu3+ doping concentration and reaches maximum at x = 70 mol%, as depicted in Fig. 4b. Then, the strength gradually decreases with further increasing Eu3+ concentration due to the well-known concentration quenching effect, which is ascribed to the probability of the energy migration between Eu3+–Eu3+ increasing. Herein, the high quenching concentration (70 mol%) in the Eu3+ doped Ca2YSbO6 double perovskite mainly originates from the different energy migrations between intralayer and interlayer luminescence centers.21,24 In the structure of Ca2YSbO6, [YO6] and [SbO6] are connected by corner-sharing alternately with a layered structure, which is beneficial to damp the concentration quenching among Eu3+–Eu3+ ions. Thus, higher emission intensity and luminescence efficiency can be realized via doping with a higher Eu3+ concentration.15 Besides, the critical distance (Rc) among Eu3+ ions for energy transfer is an important parameter, which can be evaluated based on the Blasse theory.25 In this study, the Rc is estimated to be ∼7.1 Å, which is larger than 5 Å. Therefore, the concentration quenching is mainly governed by multipolar interactions. Herein, the type of interaction mechanism of Eu3+ ions in Ca2YSbO6 is determined by the relationship between log(I/x) and log(x) using the following expression:26
 | (1) |
In order to obtain additional information on the concentration quenching behavior of the Eu3+ ions, the luminescence decay curves of Ca2YSbO6:Eu3+ with various Eu3+ concentrations under the excitation of 464 nm are investigated, as illustrated in Fig. 5. All the decay curves of Eu3+ emission can be well fitted with a first order exponential as follows:27
I(t) = I0 + A![[thin space (1/6-em)]](https://www.rsc.org/images/entities/char_2009.gif) exp(−t/τ) exp(−t/τ)
| (2) |
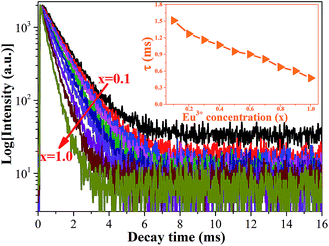 | ||
| Fig. 5 PL decay curves of Ca2YSbO6:xEu3+ samples with different Eu3+ content. Inset is the average lifetime versus Eu3+ concentration. | ||
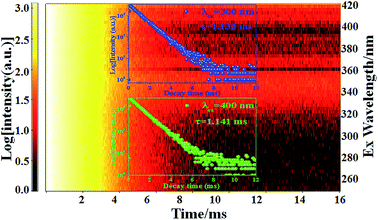 | ||
| Fig. 6 2D decay curves of Ca2Y0.8SbO6:0.2Eu3+ phosphor under various excitations ranging from 250–420 nm. Insets are the decay curves for excitation at 300 nm and 400 nm. | ||
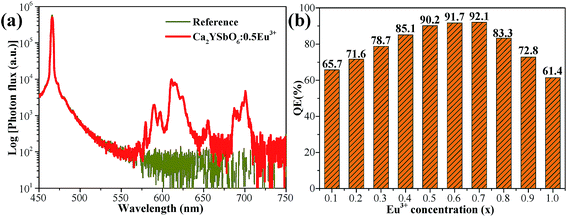
To evaluate the luminescence performance of the as-obtained phosphor materials for practical application, the internal quantum efficiency (IQE) was recorded. The measured spectrum of the Ca2Y0.5SbO6:0.5Eu3+ phosphor as an example and reference sample is given in Fig. 7, and the value can be estimated using the formula28
 | (3) |
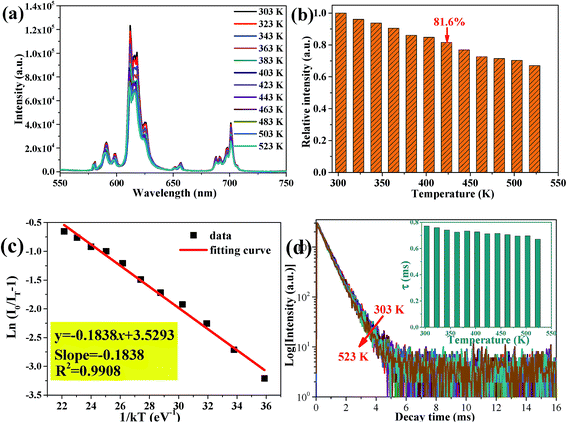
As an indispensable performance objective in evaluating practical applications in solid-state lighting, the temperature quenching property has been investigated. The temperature-dependent PL emission spectra of the Ca2Y0.3Eu0.7SbO6 sample recorded from 303 to 523 K are illustrated in Fig. 8a. Unsurprisingly, as the temperature rises from 303 to 523 K, the emission peak remained almost unchanged except the PL emission intensity decreased gradually. Especially, the as-prepared Ca2YSbO6:Eu3+ demonstrates a very low luminescence quenching behavior with its PL intensity still maintaining 81.6% at 423 K in comparison with that of the initial intensity at 303 K, as depicted in Fig. 8b. The excellent thermal stability is mainly attributed to its rigid network structure of double perovskite, which could adequately minimize the emission loss with enhancing temperature.30,31 Besides, in order to investigate the temperature dependence of luminescence in depth, the activated energy ΔE can be obtained by using the modified Arrhenius equation as follows32–34
 | (4) |
Additionally, the temperature-dependent luminescence decay curves of Ca2Y0.3Eu0.7SbO6 monitored at 612 nm were also measured, as illustrated in Fig. 9d. All the curves are well fitted to a single exponential and the decay behavior of Ca2Y0.3Eu0.7SbO6 weakly depends on the temperature. With the temperature increased to 523 K, the lifetime has slight variation, which further verifies that the as-prepared phosphor has excellent thermal stability.
3.3 Electroluminescent performance of the fabricated WLEDs
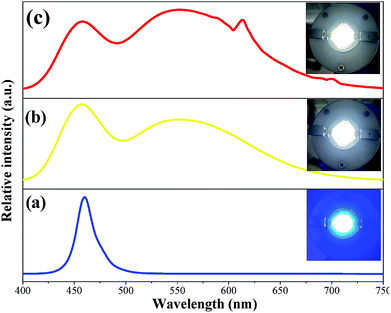
To further evaluate the potential applications of the Ca2YSbO6:Eu3+ phosphor, a prototype WLED device was fabricated by coupling a blend of the as-prepared red phosphor, the commercial YAG:Ce3+ yellow phosphor and transparent silicon resin on a 460 nm blue LED chip. The electro-luminescence (EL) spectra of the InGaN blue chip, the fabricated YAG:Ce3+-based and Ca2YSbO6:Eu3+–YAG:Ce3+ LEDs under 60 mA current excitation are depicted in Fig. 9. The corresponding EL spectrum in Fig. 9b contains two emission bands: the one at 460 nm belongs to the blue chip and the other at 550 nm is ascribed to the emission of YAG:Ce3+. Except the above emission bands, the peak located at 612 nm attributed to the emissions of Ca2YSbO6:Eu3+ can be observed in Fig. 9c. Bright cool white light is found (Fig. 9b, inset), and the CIE chromaticity coordinates, luminescent efficiency (LE), color rendering index (Ra) as well as correlated color temperature (CCT) are measured to be (0.308, 0.341), 118.6 lm W−1, 75.4 and 6666 K, respectively. Thus, in order to improve the Ra and CCT of the LED, the as-prepared Ca2YSbO6:Eu3+ phosphor was added and the high performance warm WLEDs with a low CCT of 4720 K and high CRI of 82.6 can be achieved. Besides, the CIE diagram shifts to (0.353, 0.377) and the LE is 101.9 lm W−1. These results illustrate that the added Ca2YSbO6:Eu3+ red-emitting phosphor can effectively improve the photoelectric parameter of WLED devices.4. Conclusions
In summary, highly efficient red-emitting Ca2Y1−xSbO6:xEu3+ (0.1 ≤ x ≤ 1.0) phosphors with high concentration quenching and quantum efficiency have been successfully prepared by the traditional high-temperature solid state route. All the samples can be indexed to a pure monoclinic structure. The PLE and PL spectra demonstrate that the Ca2YSbO6:Eu3+ phosphors can be efficiently excited by NUV (393 nm) and blue light (464 nm), which match well with the UV and blue LED. Upon 464 nm excitation, a bright red emission located at 612 nm corresponding to the electric dipole transition 5D0–7F2 of Eu3+ can be observed. The optimal Eu3+ doping concentration reaches as high as 70 mol%, and the concentration quenching mechanism is attributed to the dipole–dipole interaction. Besides, the high quenching concentration mainly originates from different energy migrations between intralayer and interlayer luminescence centers in the Ca2YSbO6 lattice. Importantly, the IQE of Ca2Y0.3SbO6:0.7Eu3+ reaches up to 92.1%. Besides, the obtained phosphor demonstrates excellent thermal stability, where the emission intensity still maintains 81.6% at 423 K compared to that of the initial intensity at 303 K. This result is ascribed to its rigid network structure of double perovskite. Finally, a warm white light with CIE chromaticity coordinates of (0.353, 0.377), CCT of 4720 K and CRI of 82.6 can be achieved by efficiently fabricating Ca2YSbO6:Eu3+ phosphor in a 460 nm blue-InGaN chip together with the commercial Y3Al5O12:Ce3+ yellow phosphor. All of the results illustrate the promising prospect of Ca2YSbO6:Eu3+ as a potential red-emitting phosphor for application in blue/UV converted WLEDs.Conflicts of interest
There are no conflicts to declare.Acknowledgements
This work was supported by the National Nature Science Foundation of China (21704091 and 51502066), Zhejiang Province Natural Science Foundation (LY18E020006), and the college students’ activities of Science and Technology Innovation in Zhejiang Province (2018R407003).References
- H. Lin, T. Hu, Y. Cheng, M. X. Chen and Y. S. Wang, Laser Photonics Rev., 2018, 12, 1700344 CrossRef.
- Z. G. Xia and Q. L. Liu, Prog. Mater. Sci., 2016, 84, 59–117 CrossRef CAS.
- J. S. Zhong, D. Q. Chen, Y. Z. Peng, Y. D. Lu, X. Chen, X. Y. Li and Z. G. Ji, J. Alloys Compd., 2018, 763, 34–48 CrossRef CAS.
- K. Li, J. Fan, M. M. Shang, H. Z. Lian and J. Lin, J. Mater. Chem. C, 2015, 3, 9989–9998 RSC.
- Z. Zhou, N. Zhou, M. Xia, M. Yokoyama and H. T. Hintzen, J. Mater. Chem. C, 2016, 4, 9143–9161 RSC.
- J. S. Zhong, D. Q. Chen, S. Yuan, M. J. Liu, Y. J. Yuan, Y. W. Zhu, X. Y. Li and Z. G. Ji, Inorg. Chem., 2018, 57, 8978–8987 CrossRef CAS PubMed.
- C. C. Lin, A. Meijerink and R. S. Liu, J. Phys. Chem. Lett., 2016, 7, 495–503 CrossRef CAS PubMed.
- J. H. Li, J. Yan, D. W. Wen, W. U. Khan, J. X. Shi, M. M. Wu, Q. Su and P. A. Tanner, J. Mater. Chem. C, 2016, 4, 8611–8623 RSC.
- J. S. Zhong, Y. Z. Peng, D. Q. Chen, M. J. Liu, X. Y. Li, Y. W. Zhu and Z. G. Ji, J. Mater. Chem. C, 2018, 6, 13305–13315 RSC.
- Z. H. Sun, M. Q. Wang, Z. Yang, Z. Q. Jiang and K. P. Liu, J. Alloys Compd., 2016, 658, 453–458 CrossRef CAS.
- X. C. Wang, Z. Y. Zhao, Q. S. Wu, Y. Y. Li and Y. H. Wang, Inorg. Chem., 2016, 55, 11072–11077 CrossRef CAS PubMed.
- X. G. Zhang, L. Y. Zhou and M. L. Gong, Opt. Mater., 2013, 35, 993–997 CrossRef.
- R. P. Cao, X. F. Ceng, J. J. Huang, X. W. Xia, S. L. Guo and J. W. Fu, Ceram. Int., 2016, 42, 16817–16821 CrossRef CAS.
- T. Honma, K. Toda, Z. G. Ye and M. Sato, J. Phys. Chem. Solids, 1998, 59, 1187–1193 CrossRef CAS.
- L. X. Wang, Q. Liu, K. Shen, Q. T. Zhang, L. Zhang, B. Song and C. P. Wong, J. Alloys Compd., 2017, 696, 443–449 CrossRef CAS.
- J. Liang, L. L. Sun, B. Devakumar, S. Y. Wang, Q. Sun, H. Guo, B. Li and X. Y. Huang, RSC Adv., 2018, 8, 31666–31672 RSC.
- S. Vasala and M. Karppinen, Prog. Solid State Chem., 2015, 43, 1–36 CrossRef CAS.
- J. C. Zhu, Z. G. Xia, Y. Y. Zhang, M. S. Molokeev and Q. L. Liu, Dalton Trans., 2015, 44, 8536–18543 Search PubMed.
- X. Yin, Y. M. Wang, F. Q. Huang, Y. J. Xia, D. Y. Wan and J. Y. Yao, J. Solid State Chem., 2011, 184, 3324–3328 CrossRef CAS.
- X. H. Li, B. Milićević, M. D. Dramićanin, X. P. Jing, Q. Tang, J. X. Shi and M. M. Wu, J. Mater. Chem. C, 2019, 7, 2596–2603 RSC.
- L. Wang, Q. Liu, K. Shen, Q. Zhang, L. Zhang, B. Song and C. Wong, J. Alloys Compd., 2017, 696, 443–449 CrossRef CAS.
- Q. Liu, L. X. Wang, W. T. Huang, L. Zhang, M. X. Yu and Q. T. Zhang, J. Alloys Compd., 2017, 717, 156–163 CrossRef CAS.
- Q. Zhang, X. C. Wang, X. Ding and Y. H. Wang, Inorg. Chem., 2017, 56, 6990–6998 CrossRef CAS PubMed.
- J. H. Li, Q. Y. Liang, Y. F. Cao, J. Yan, J. B. Zhou, Y. Q. Xu, L. Dolgov, Y. Y. Meng, J. X. Shi and M. M. Wu, ACS Appl. Mater. Interfaces, 2018, 10, 41479–41486 CrossRef CAS PubMed.
- G. Blasse, Philips Res. Rep., 1969, 24, 131–144 CAS.
- J. S. Zhong, S. Zhou, D. Q. Chen, J. J. Li, Y. W. Zhu, X. Y. Li, L. F. Chen and Z. G. Ji, Dalton Trans., 2018, 47, 8248–8256 RSC.
- P. Du, Y. Guo, S. H. Lee and J. S. Yu, RSC Adv., 2017, 7, 3170–3178 RSC.
- X. Y. Huang, S. Y. Wang, B. Li, Q. Sun and H. Guo, Opt. Lett., 2018, 43, 1307–1310 CrossRef CAS PubMed.
- D. Wen, J. Feng, J. Li, J. Shi, M. Wu and Q. Su, J. Mater. Chem. C, 2015, 3, 2107–2114 RSC.
- Y. H. Kim, P. Arunkumar, B. Y. Kim, S. Unithrattil, E. Kim, S. H. Moon, J. Y. Hyun, K. H. Kim, D. Lee, J. S. Lee and W. B. Im, Nat. Mater., 2017, 16, 543 CrossRef CAS PubMed.
- S. Y. Xin, F. G. Zhou, L. Zhao, B. T. Liu, C. Wang, X. J. Wang, Z. W. Li and G. Zhu, ECS J. Solid State Sci. Technol., 2018, 7, R94–R98 CrossRef CAS.
- Y. Wei, L. Cao, L. M. Lv, G. G. Li, J. R. Hao, J. S. Gao, C. C. Su, C. C. Lin, H. S. Jang, P. P. Dang and J. Lin, Chem. Mater., 2018, 30, 2389–2399 CrossRef CAS.
- J. S. Zhong, X. Chen, D. Q. Chen, M. J. Liu, Y. W. Zhu, X. Y. Li and Z. G. Ji, J. Alloys Compd., 2019, 773, 413–442 CrossRef CAS.
- X. J. Zhang, J. Wang, L. Huang, F. J. Pan, Y. Chen, B. F. Lei, M. Y. Peng and M. M. Wu, ACS Appl. Mater. Interfaces, 2015, 7, 10044–10054 CrossRef CAS PubMed.
- M. Xia, X. B. Wu, Y. Zhong, Z. Zhou and W. Y. Wong, J. Mater. Chem. C, 2019, 7, 2385–2393 RSC.
- D. Q. Chen, Z. Y. Wan and S. Liu, Anal. Chem., 2016, 88, 4099–4106 CrossRef CAS PubMed.
Footnote |
| † Electronic supplementary information (ESI) available. See DOI: 10.1039/c9ra03410b |
| This journal is © The Royal Society of Chemistry 2019 |

