DOI:
10.1039/C9RA03335A
(Paper)
RSC Adv., 2019,
9, 24603-24616
Synthesis and adsorption behavior of hydroxypropyl-β-cyclodextrin–polyurethane magnetic nanoconjugates for crystal and methyl violet dyes removal from aqueous solutions
Received
4th May 2019
, Accepted 18th July 2019
First published on 8th August 2019
Abstract
In this study, hydroxypropyl-β-cyclodextrin (HPβCD), HPβCD-conjugated magnetic nanoparticles (HPMN) and HPβCD-conjugated magnetic nanoparticles with polyurethane networks (HPMNPU) were synthesized and used as adsorbents for the removal of crystal violet (CV) and methyl violet (MV) dyes from aqueous solutions. Magnetic nanocomposites were characterized by Fourier transform infrared spectroscopy, X-ray diffraction and scanning electron microscopy. The results of characterization analyses indicated that HPβCD was successfully modified with magnetic nanoparticles and polyurethane networks. In this work, a novel definitive screening design (DSD) was initially used to investigate the adsorption and elimination of dye impurities. This method allows a drastic reduction in the number of experiments needed to investigate those systems characterized by a large number of variables. The effects of nine quantitative parameters were investigated: initial dye concentration, adsorbent dose, contact time, temperature, pH, ionic strength, HMDI/HP ratio, MN/HP ratio, and stirrer speed. Analysis of a DSD model revealed that only four variables, namely, adsorbent dose, contact time, initial dye concentration and HMDI/HP ratio were statistically significant. Compared with HPMN, HPMNPU nanocomposites showed better adsorption performance for the removal of CV and MV from aqueous solutions. The maximum adsorption capacity values of HPMNPU were approximately 1269 mg g−1 and 1667 mg g−1 for CV and MV, respectively. This study showed that HPMNPU adsorbents exhibited high adsorption performance for the removal of CV and MV from water and could be promising adsorbent materials for the efficient removal of cationic dyes from wastewaters.
1. Introduction
Organic dye contaminants have received increasing attention in recent years because of the fast development of industrial processing. Hence, the removal of the dye contaminants prior to their discharge into the environment is necessary. The most notable feature of cyclodextrin (CD) is its ability to form host–guest complexes with a wide range of molecules including dyes,1,2 due to its special molecular structure. Until now, various adsorbents such as activated carbons,3 carbon nanotubes,4 magnetic carbon nanotubes,5,6 and clays7 have been successfully used to remove dyes and other pollutants from water. The most widely used adsorbent for the adsorption process in industrial wastewater treatment systems is activated carbon due to its large specific surface area. Owing to the high cost of activated carbon, the use of this adsorbent is limited. Therefore, extensive research has been going on for searching inexpensive alternative adsorbents having reasonable adsorption efficiencies.8 Crystal violet and methyl violet are a family of organic compounds that are mainly used as dyes. Crystal violet and methyl violet belong to the cationic type of dyes that are more toxic, mutagenic and carcinogenic than anionic and nonionic dyes and are included in the triaryl methane dye category. They cause various eye-related problems such as irritation, conjunctivitis and cornea injury. In severe cases, these can cause respiratory and kidney failure, permanent blindness, and cancer. These dyes are potential biohazards as they have been proved to be mitotic poisoning agents.9 Therefore, it is essential to treat these toxic and carcinogenic pollutants using eco-friendly adsorbents.
β-Cyclodextrin (βCD) contains 21 (7 primary and 14 secondary) hydroxyl groups, which can be utilized for network formation. A system with a combination of cyclodextrin and MNPs can give the synergistic advantage of magnet-responsive transport. The design of such a system is possible due to the presence of hydroxyl groups on both the moieties, which can be linked to isocyanate molecules to form multiple urethane linkages. The added advantage of multiple urethane linkages is its biocompatibility, stability, strength, and adaptability for modification, which enhances applicability.10 Specifically, in the case of urethane linkages, this task is more feasible as it can be achieved by varying the mole ratio of NCO/OH.11,12 The cyclodextrin-based urethane networks have been achieved by the reaction of cyclodextrin with diisocyanate for the intended applications such as adsorbents, a binder for active pharmaceutical ingredients and molecular imprinting.13 There is a dual advantage since both the cyclodextrin cavity and the urethane network can remove dyes.
HPβCD has been replaced by CD owing to its high aqueous solubility with a safe biological profile in most industries. In the structure of HPβCD where the hydroxypropyl group occupies the primary face, this hydroxyl group assists the formation of nanoparticles and the hydrophobic interaction stabilizes it by preventing the aggregation in an alkaline medium.14
Magnetic nanoparticles (MNPs) such as iron oxide respond to an external magnetic field for easy magnetic guided transport. However, they carry no residual magnetization, so that aggregation can be avoided to some extent. They offer an exceptional combination of properties including adaptability for external manipulation, controllable size, and the possibility of surface modification and enhancement of contrast in magnetic resonance imaging (MRI). The agglomeration of MNPs can be further prevented by coating/covalent bonding with polymeric materials. Iron oxides, such as magnetite (Fe3O4), are commonly used for the synthesis of magnetic nanoparticles. With a polymeric coating of the MNPs, lots of functional groups from the polymer could be used for further functionalization and thus to increase potentiality.15 Usually, the magnetic nanoparticles tend to aggregate due to their large surface area/volume ratio and due to the magnetic dipole–dipole interaction between particles. This property limits their applications and, therefore, dispersion of the magnetic nanoparticles is a crucial step in their production.16 Polymer shells can prevent aggregation and the MNPs can be handled in an aqueous dispersion.
Magnetic nanoparticles (MNPs) are a class of nanoparticles that can be manipulated using a magnetic field. MNPs have the advantages of large surface area, high number of surface active sites and high magnetic properties, which result in high adsorption efficiency, the high removal rate of contaminants, and easy and rapid separation of adsorbents from the solution via a magnetic field. After magnetic separation, the contaminants can be easily removed from nanoparticles using adsorbents, and the recovered MNPs can be reused.17
Polyurethane (PU) is a widely used polymer material, and it possesses excellent mechanical properties and good water resistance.18–21 The polyurethane foam material has a network structure, small bulk density, large surface area, and high adsorption efficiency, so it has been widely used in various fields as a carrier.22 Although several kinds of βCD-based polymers have been reported to be useful in removing a contaminant from wastewaters and proved to be simple and effective for the treatment,23,24 no work has been done as yet on the adsorption of MV and CV onto HPβCD, Fe3O4 and polyurethane materials. The network structure and large surface area of HPβCD, Fe3O4 and polyurethane can facilitate the adsorption of dyes present in the wastewater.
In the analysis of problems caused by several factors with possible interactions, statistical screening methods are often adopted to select the parameters that actually affect the response variable and to exclude the irrelevant ones. This is particularly useful at the beginning of an investigation, when little or no information is available for the system of interest. The significant factors are then investigated by applying designs of higher sensitivity. In the most commonly used screening designs, each continuous factor is usually set at two levels. However, these methods are not able to provide information on the possible curvature or on active pure-quadratic effects. The customarily addition of center runs to these designs to get a global assessment of curvature does not allow for separate estimation of the quadratic effects of each factor. To overcome this limitation, three-level methods should be used. Recently, a new class of three-level designs, the so-called definitive screening designs (DSDs), has been proposed by Jones and Nachtsheim.25 DSDs allow for the assessment of active effects, two-factor interactions and pure-quadratic effects in the presence of effect sparsity. Moreover, since each run, except for the center point, has one factor level at its zero levels and all others at one of the extremes, the number of experimental tests required for k factors is only 2k + 1. For an odd number of factors, the authors suggest the inclusion of two extra runs to generate orthogonal designs for main effects. Compared to traditional screening methods such as central composite designs and orthogonal arrays, this allows a drastic reduction in the number of experiments, thus significantly saving time and reducing the cost of materials. This article shows how to take advantage of the special structure of the DSD to obtain the most clear-cut analytical results possible. One important property of a DSD is that all linear effects are orthogonal to bilinear and quadratic effects, so that the estimates of linear effects are not biased by the presence of active second-order effects.
In this study, a series of HPβCD, Fe3O4 and polyurethane materials were prepared for the adsorption of MV and CV dyes. We use a definitive screening design (DSD) approach for investigation. The prepared materials were characterized by FT-IR spectroscopy, SEM and XRD. The effects of several parameters and adsorption properties of the material were investigated and discussed. To the best of our knowledge, this is the first time that MV and CV dye adsorption applications of HPβCD, Fe3O4 and polyurethane materials are reported. We found that the removal efficiency was affected by a variety of factors such as initial dye concentration, adsorbent dose, contact time, temperature, pH, ionic strength, HMDI/HP ratio, MN/HP ratio, and stirrer speed.
2. Experimental
2.1. Materials
All reagents were of analytical-grade. βCD (98%), polyethylene glycol PEG 1500 (99%), and ethylene glycol (99.8%) were products of Sigma-Aldrich (USA). Propylene oxide (99%), sodium hydroxide (99%), sulfuric acid (98%), FeCl3·4H2O (99%), sodium acetate (99%), N,N-dimethyl formamide (99%) and hexamethylene diisocyanate (HMDI, 99%) were obtained from Merck (Germany).
2.2. Synthesis
2.2.1. Synthesis of Fe3O4 nanoparticles. FeCl3·6H2O (1.350 g), PEG 6000 (1.000 g), anhydrous sodium acetate (3.600 g) and ethylene glycol (40 mL) were mixed in a beaker under constant stirring. After 30 minutes of stirring, the mixture was transferred into a stainless steel autoclave and maintained at 200 °C for 8 h. Then, a black precipitate was obtained by magnetic separation, washed with ethanol three times and dried in vacuum at 60 °C for 6 h. Finally, Fe3O4 nanoparticles were obtained.26
2.2.2. Synthesis of HPβCD. 0.1 g βCD was dissolved in NaOH (4.8%) at 60 °C under stirring. After cooling in an ice-bath, the clear solution was treated with 0.07 g propylene oxide added dropwise under stirring. After overnight stirring at 0–5 °C, the solution was kept at room temperature for 3 h. The pH was made neutral with H2SO4 (10%, and pH 7.0), and the solution was allowed to evaporate. Thereafter, the product was extracted from the insoluble Na2SO4 with ethanol (95%) or isopropyl alcohol (99%), and the extract was evaporated.27
2.2.3. HPβCD-conjugated magnetic nanoparticles. To obtain the HPβCD-conjugated magnetic nanoparticles, abbreviated as HPMN, 0.15 g Fe3O4 and 0.5 g HPβCD were dispersed in 60 mL deionized water and then ultrasonicated for 30 min. The mixture was then transferred into an oven and heated at 150 °C for 5 h. The resulting composite was washed several times with deionized water. Finally, the obtained sample was dried in a vacuum oven at 80 °C for 24 h.26
2.2.4. Synthesis of HPMN–polyurethane. The previously reported procedure was adopted for the covalent conjugation of MNPs with HMDI. Briefly, MNPs (0.4 g) were dispersed in DMF (60 mL) by sonication. HMDI (1.767 g in 10 mL DMF) was added dropwise during the course of 15 min. The reaction mixture was sonicated for further 3 h at 25 °C. Next, HPβCD (2 g, dissolved in 30 mL DMF) was added dropwise during the course of 30 min. The reaction was allowed to proceed at 70 °C for another 3 h. The product was separated by magnetic decantation followed by washings with distilled water (25 mL) and acetone (25 mL). The HPMN–polyurethane abbreviated as HPMNPU was dried in vacuum for 24 h at 40 °C.28
2.3. Characterization
The absorption spectra were obtained using a Shimadzu 1800 UV-Vis spectrophotometer at (25 ± 0.1) °C. The morphology of the obtained nanocomposites was characterized using a field-emission scanning electron microscope (SEM, LEO-1430 VP). The samples were mounted on a stub of metal with adhesive, coated with 40–60 nm of gold and then observed using the microscope. For FTIR spectroscopic investigations, 10 mg of the sample were mixed with 100 mg KBr and pressed into a pellet. The measurements were carried out in the mid-infrared range of 4000 cm−1 to 400 cm−1 using a Nicolet model Protege 460 Magna FTIR spectrometer equipped with the OMNIC software. The resolution was set to 4 cm−1; 100 scans were recorded, averaged for each spectrum. The X-ray diffraction (XRD) patterns of nanocomposites were studied using a X-ray powder diffractometer (XRD – Inel EQUINOX 3000) equipped with a Cu radiation source, wavelength of 1.540560 Å, step scan size of 0.031 and counting time of 10 min with a detector.
2.4. Experimental design
The DSD proposed by Jones and Nachtsheim25 was adopted to investigate the effects of nine continuous factors (k = 9) that were identified, in preliminary runs, as potentially important for the dye removal process. They were: initial dye concentration, adsorbent dose, contact time, temperature, pH, ionic strength, HMDI/HP ratio, MN/HP ratio, and stirrer speed. For each factor, natural values corresponding to the coded levels of −1, 0 and 1 were selected to cover a range of values of practical interest and on the basis of the results of preliminary experiments conducted to assess their individual effect on the adsorption efficiency. Coded and actual values of the design factors are reported in Table 1.
Table 1 Coded and actual values of the design factors
| Factor |
Factor level |
Unit |
| −1 |
0 |
+1 |
| X1 |
Adsorbent dose |
6 |
12 |
18 |
mg |
| X2 |
Contact time |
1 |
3 |
5 |
h |
| X3 |
Initial concentration |
2 |
4 |
6 |
mg L−1 |
| X4 |
Temperature |
20 |
30 |
40 |
°C |
| X5 |
pH |
5 |
7 |
9 |
— |
| X6 |
Ionic strength |
0 |
5 |
10 |
mg L−1 |
| X7 |
HMDI/HP |
10 |
25 |
40 |
Ratio |
| X8 |
MN/HP |
0.5 |
1 |
1.5 |
Ratio |
| X9 |
Stirrer speed |
50 |
100 |
150 |
rpm |
Overall, the experimental design consisted of 2k + 3 = 21 runs, which were conducted randomly to minimize the effects of uncontrolled factors. The design layout and the observed dye removal efficiencies are shown in Table 2. The design and analysis of experiments were performed using the statistical software mini tab 18 and Design Expert 11.
Table 2 Experimental design layout and observed response (y) for the DSD
| Run |
X1 |
X2 |
X3 |
X4 |
X5 |
X6 |
X7 |
X8 |
X9 |
Y (%) |
| 1 |
18 |
1 |
4 |
20 |
9 |
0 |
10 |
1.5 |
50 |
66.89 |
| 2 |
6 |
5 |
2 |
20 |
5 |
10 |
25 |
1.5 |
50 |
60.47 |
| 3 |
18 |
1 |
2 |
40 |
7 |
10 |
40 |
1.5 |
150 |
62.96 |
| 4 |
12 |
3 |
4 |
30 |
7 |
5 |
25 |
1 |
100 |
72.97 |
| 5 |
6 |
3 |
2 |
40 |
9 |
0 |
40 |
0.5 |
50 |
58.96 |
| 6 |
18 |
1 |
2 |
20 |
5 |
5 |
40 |
0.5 |
50 |
53.11 |
| 7 |
6 |
1 |
6 |
20 |
5 |
0 |
40 |
1 |
150 |
33.07 |
| 8 |
12 |
1 |
6 |
40 |
5 |
10 |
10 |
0.5 |
50 |
47.20 |
| 9 |
18 |
5 |
6 |
40 |
5 |
0 |
40 |
1.5 |
50 |
60.90 |
| 10 |
6 |
1 |
2 |
20 |
9 |
10 |
10 |
0.5 |
150 |
51.93 |
| 11 |
18 |
5 |
2 |
40 |
9 |
10 |
10 |
1 |
50 |
93.05 |
| 12 |
6 |
1 |
2 |
40 |
5 |
0 |
10 |
1.5 |
100 |
53.32 |
| 13 |
18 |
5 |
6 |
20 |
9 |
10 |
40 |
0.5 |
100 |
59.47 |
| 14 |
6 |
5 |
6 |
40 |
9 |
5 |
10 |
1.5 |
150 |
59.53 |
| 15 |
18 |
1 |
6 |
40 |
9 |
0 |
25 |
0.5 |
150 |
53.90 |
| 16 |
18 |
3 |
6 |
20 |
5 |
10 |
10 |
1.5 |
150 |
68.65 |
| 17 |
12 |
5 |
2 |
20 |
9 |
0 |
40 |
1.5 |
150 |
68.04 |
| 18 |
18 |
5 |
2 |
30 |
5 |
0 |
10 |
0.5 |
150 |
87.98 |
| 19 |
6 |
5 |
4 |
40 |
5 |
10 |
40 |
0.5 |
150 |
51.33 |
| 20 |
6 |
1 |
6 |
30 |
9 |
10 |
40 |
1.5 |
50 |
37.39 |
| 21 |
6 |
5 |
6 |
20 |
7 |
0 |
10 |
0.5 |
50 |
53.66 |
2.5. Adsorption measurement
The absorption spectra were obtained using a Shimadzu 1800 UV-Vis spectrophotometer. A known amount of adsorbent was added to 50 mL of each of these dye solutions and was mixed using a mixer with 200 rpm velocity at ambient temperature for a definite time. After completing the time of mixing using a mechanical mixer, adsorbents were separated from the dye solution in a short duration using a proper magnet. The remaining concentration of the solution containing both dyes treated with different adsorbents was calculated using a UV-Vis instrument in λmax and using a calibration curve. The eliminated amount of dye and the adsorption capacity were calculated using the following equation:| | |
Removal percentage (%) = (C0 − Ce)/C0 × 100
| (1) |
To obtain the maximum absorption, we used the following equation of the Langmuir isotherm model:29–32
where
C0 and
Ce are the initial and equilibrium concentrations of the dye solution (mg L
−1),
qe and
qm are the equilibrium adsorption capacity and the maximum adsorption capacity and
KL (L mg
−1) is a parameter correlated with the sorption energy. The values of
qm and
KL of the linear expression of Langmuir adsorption isotherm were calculated from the slopes and intercept of the linear plot of
Ce/
qe versus Ce according to
eqn (3).
| | |
1/qe = 1/qm + (1/qmKL) × (1/Ce)
| (3) |
3. Results and discussion
3.1. Characterization
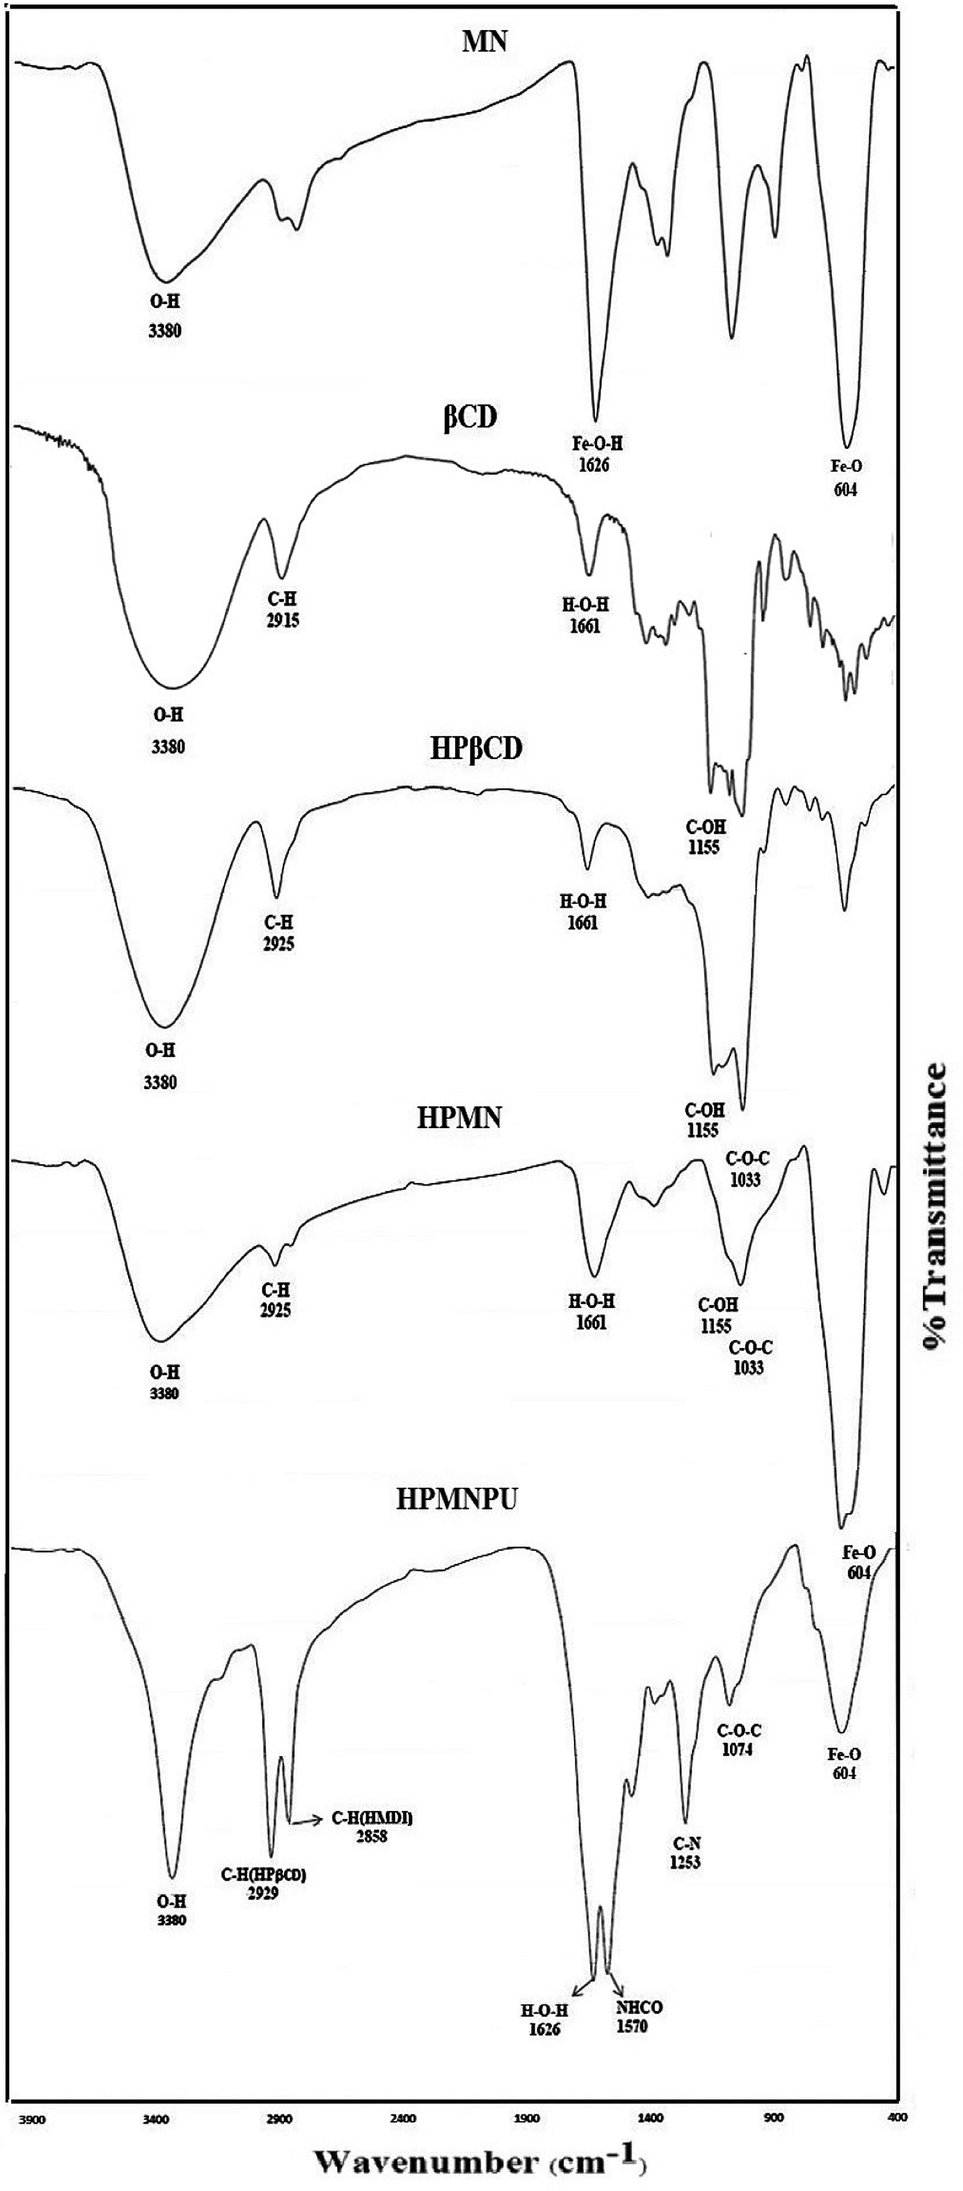
Spectroscopic investigation of the synthesized materials has been performed to evidence the synthesis procedures. In the FTIR spectrum related to nanoparticles of Fe3O4 in Fig. 1, an absorption band is seen at 604 cm−1 that is related to the Fe–O bond. Although the absorption band related to the Fe–O bond is about 573 cm−1 in the bulk state, but with respect to the size of Fe3O4, the absorption band related to the Fe–O bond is variable from 537 to 656 cm−1. The particle size is smaller; the absorption band appears at a higher wavenumber and a smaller wavelength. Here, the absorption band appeared at a wavenumber of 604 cm−1, which confirmed Fe3O4 formation and an accomplished shift to higher wavenumber confirmed that it is a nanoparticle.33,34
 |
| | Fig. 1 FT-IR spectra of Fe3O4, βCD, HPβCD, HPMN and HPMNPU. | |
The IR spectrum of β-CD showed characteristic bands that are in agreement with a previous report. In the FTIR spectrum related to HPβCD shown in Fig. 1, a peak appeared at 3380 cm−1 attributed to the stretching vibration of the O–H bond. The absorption was wide and strong because of the decrease in the bond force constant caused by the intramolecular hydrogen bonding. The peak of β-CD was wider than that of HPβCD, which indicates that the introduction of hydroxypropyl groups cleaved the intramolecular hydrogen bond formed between C-2 and C-3. The peak at 2925 cm−1 could be assigned to the anti-symmetric vibration of methyl groups, but the spectrum of β-CD did not have this absorption peak, whereas that of HPβCD had the peak for the methyl group in hydroxypropyl groups. The peak at 2915 cm−1 in the spectrum of βCD is attributed to the stretching vibration of C–H bond, which appears as a shoulder for HPβCD. In addition, an absorption peak at about 1372 cm−1 ascribed to the bending vibration of the methyl group was found in the IR spectrum of HPβCD; it is the characteristic peak of the methyl group. A peak at 1661 cm−1 is assigned to the bending vibration of the H–O–H bond, that at 1155 cm−1 to the bending vibration of the C–O–H bond and that at 1033 cm−1 to the bending vibration of the C–O–C bond.35,36
As can be observed from the FTIR spectrum related to modified HPβCD with Fe3O4 (HPMN) shown in Fig. 1, in addition to the existing peaks for HPβCD, there is a comb-like peak at 604 cm−1, which is obviously assigned to the Fe–O bond. Fig. 3 shows the SEM image of this compound, which indicates the interaction of nanoparticles of Fe3O4 with HPβCD.
In the FTIR spectrum related to modified HPβCD with Fe3O4 and polyurethane (HPMNPU) shown in Fig. 1, in addition to the existing peaks for HPMN, there are evidently two types of peaks ascribed to the C–H bond. One of them is at 2929 cm−1 assigned to the C–H bond of HPβCD molecules and another at 2858 cm−1 ascribed to the C–H bond of HMDI molecules. The peak appearing at 1570 cm−1 is ascribed to the stretching vibration of NHCO and that appearing at 1253 cm−1 is ascribed to the C–N bond vibration, which confirms the final compound of HPMNPU and the interaction among molecules.37
The XRD patterns of pure Fe3O4 nanoparticles, HPβCD, PU and HPMNPU nanoconjugates are shown in Fig. 2. The XRD pattern of pure Fe3O4 nanoparticles exhibited the peaks at 2θ = 32°, 37°, 43°, 53°, 57° and 63°, which correspond to (220), (311), (400), (422), (511) and (440) planes of Fe3O4, respectively. This could be indexed to its inverse cubic spinel structure (JCPDS no. 19-629).38–40 We can also see that no characteristic peaks of impurities were observed.
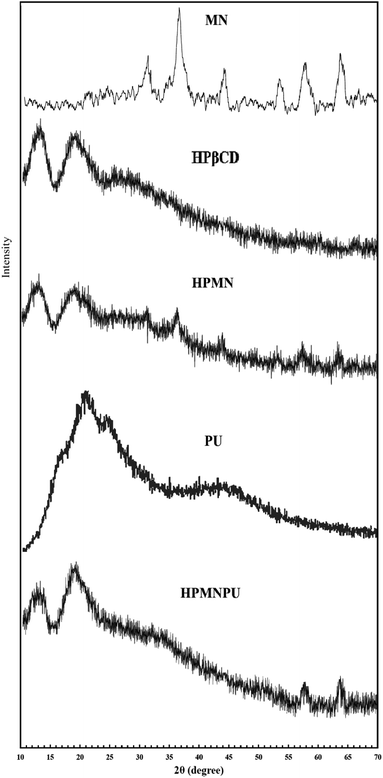 |
| | Fig. 2 XRD patterns of synthesized Fe3O4 MNPs, HPβCD, HPMN, PU and HPMNPU. | |
The XRD pattern of HPβCD showed two broad peaks in the range of 10–15° and 15–25°. The XRD pattern of HPMN peaks related to Fe3O4 nanoparticles is clearly seen. The XRD pattern of PU showed one broad peak in the range of 20–30°, confirming that they are amorphous in nature.41,42 The XRD pattern of the HPMNPU inclusion complex showed two broad peaks that were similar to that of the amorphous structure of HPβCD, and the peaks at 2θ = 57° and 63° are related to Fe3O4 nanoparticles.
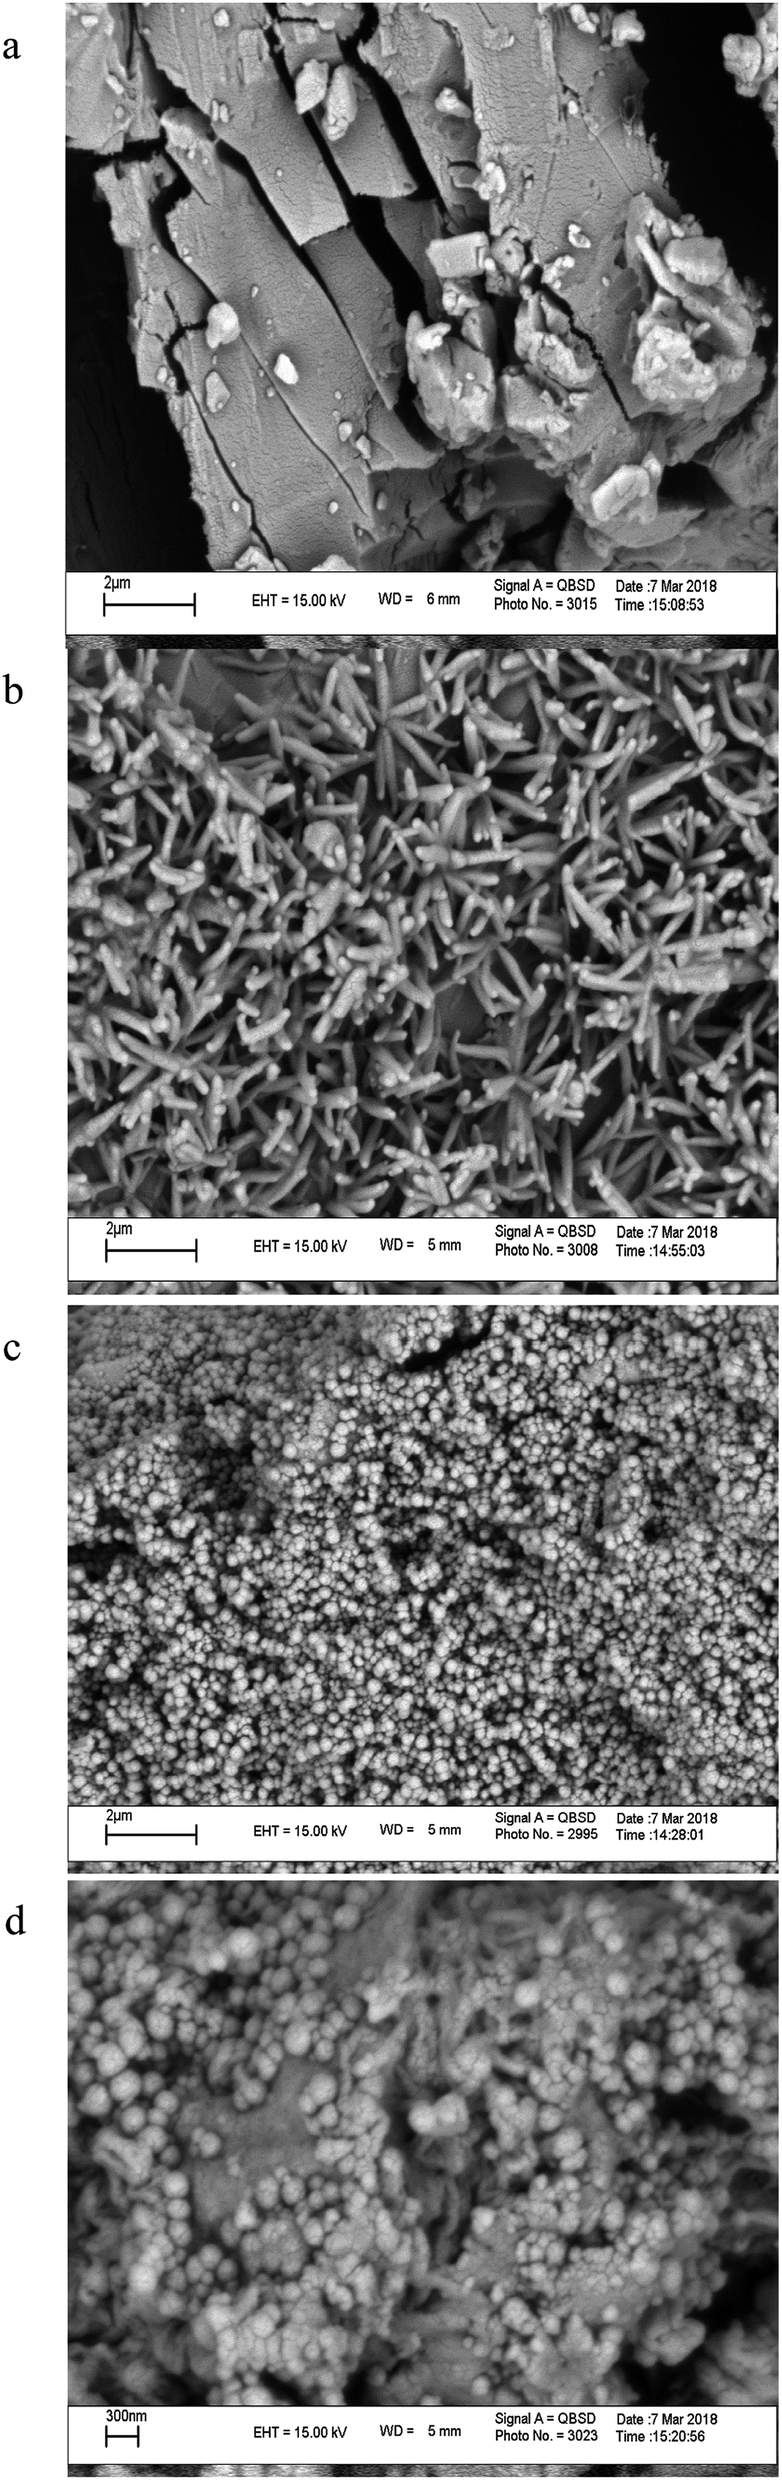
3.2. Morphological analysis
SEM is a qualitative technique to visualize changes in the surface morphology of a substance. Fig. 3 shows the SEM photographs of (a) βCD, (b) HPβCD, (c) Fe3O4 MNPs, and their inclusion complex (HPMNPU). Nanoparticles were aggregated seriously, which was due to the nano size of the Fe3O4, which connects nanoparticles Fe3O4 to HPβCD/PU surface(d).
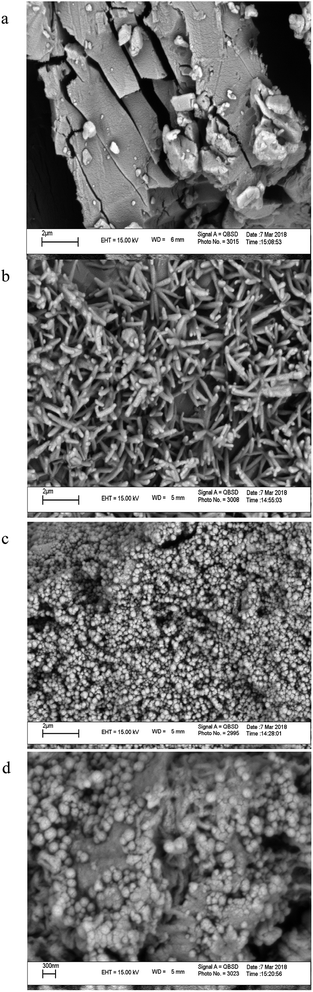 |
| | Fig. 3 SEM images of (a) βCD, (b) HPβCD, (c) Fe3O4 MNPs and (d) HPMNPU. | |
3.3. Evaluation of significant variables by DSD
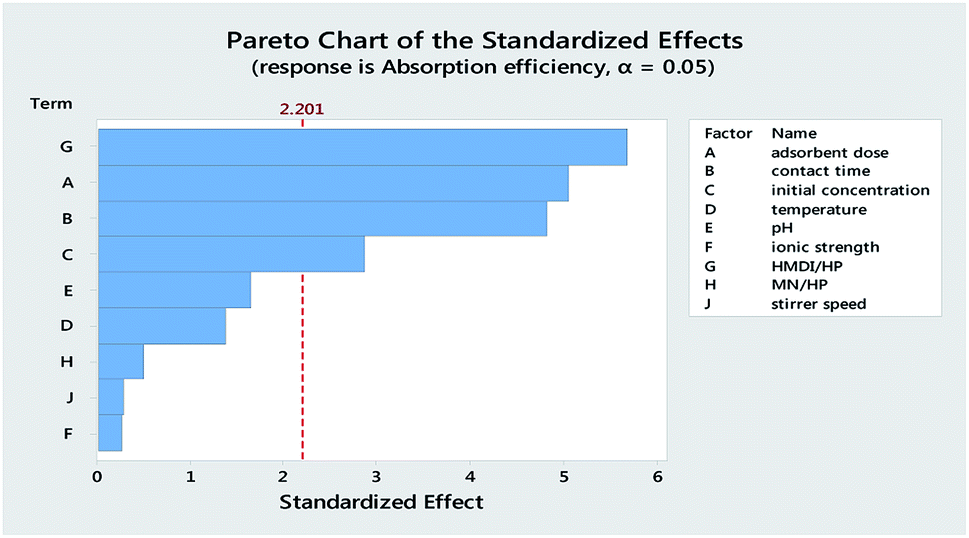
Analysis of DSD data was carried out by a two-step procedure involving a forward stepwise regression analysis. In the first step, the forward stepwise regression method with a full quadratic regression model (containing main, two-way interaction and quadratic terms) was used to evaluate the total number of effects that were likely to be active. In the second step, the all-subsets regression analysis was used to examine all possible models of sizes up to and including that of the largest model determined from the forward stepwise regression. Only hierarchical models were considered for model selection. The forward selection procedure indicated that a model containing k = 5 terms was sufficient. It is worth noting that the same result, and the same model, could be obtained using the forward selection procedure with a p-value to enter terms in the model of 0.05, which resulted in model eqn (4).| | |
Adsorption efficiency = 53.67 + 1.400 adsorbent dose + 3.811 contact time − 3.329 initial concentration − 0.3476 HMDI/HP
| (4) |
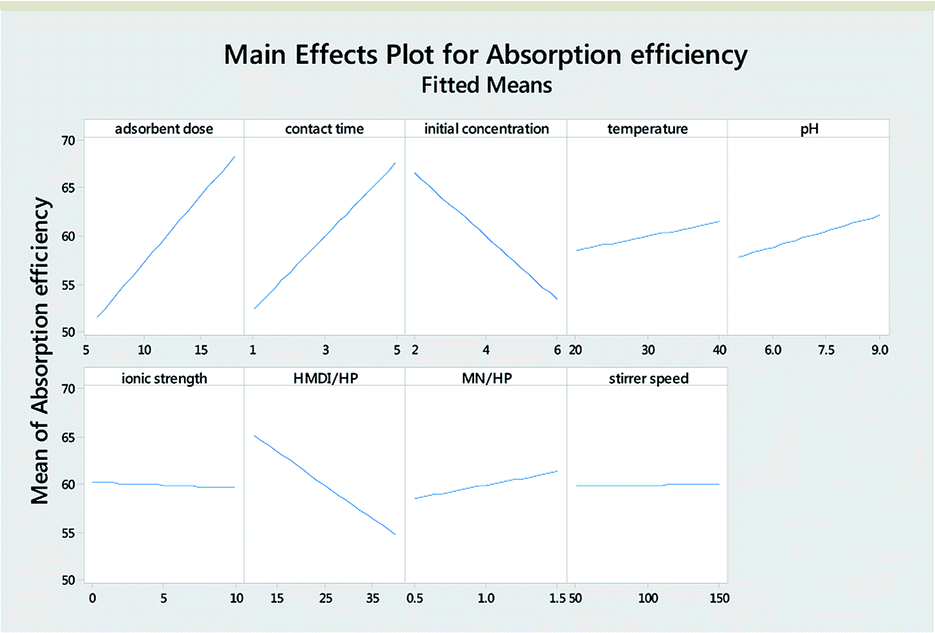
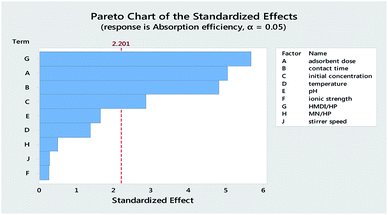
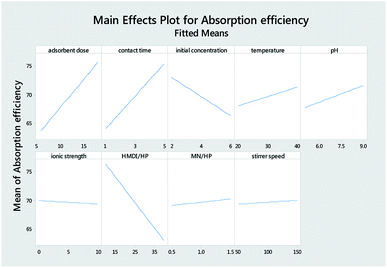
Table 3 reports the estimates of the model coefficients together with the associated statistics. The coefficient of determination (R2) was equal to 87.73%. From Table 3, Fig. 4 and 5, it can be seen that the adsorbent dose and contact time were the most influential factors and both had a positive effect on the adsorption efficiency. Dye concentration and HMDI/HP ratio had a negative effect on the adsorption efficiency. All factors that were not included in the model and p-value > 0.05 (temperature, pH, ionic strength, MN/HP ratio, and stirrer speed) were screened out. For some of them, it is not difficult to explain the absence or the small significance of their effect on the adsorbent.
Table 3 Estimates of the regression coefficients of the model described by eqn (2) together with their corresponding standard errors (SE), t values (t) and p values (p)
| Term |
Coef. |
SE Coef. |
t-Value |
p-Value |
| Constant |
59.90 |
1.21 |
49.37 |
0.000 |
| Adsorbent dose |
8.40 |
1.31 |
6.41 |
0.000 |
| Contact time |
7.62 |
1.31 |
5.82 |
0.000 |
| Initial concentration |
−6.66 |
1.31 |
−5.08 |
0.000 |
| Temperature |
1.49 |
1.31 |
1.14 |
0.280 |
| pH |
2.19 |
1.31 |
1.67 |
0.123 |
| Ionic strength |
−0.31 |
1.31 |
−0.24 |
0.817 |
| HMDI/HP |
−5.21 |
1.31 |
−3.98 |
0.002 |
| MN/HP |
1.41 |
1.31 |
1.08 |
0.305 |
| Stirrer speed |
0.09 |
1.31 |
0.07 |
0.945 |
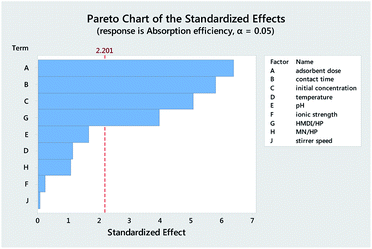 |
| | Fig. 4 Pareto chart of the standardized effects. | |
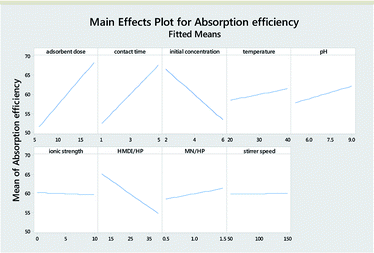 |
| | Fig. 5 Main effects plot for adsorption efficiency. | |
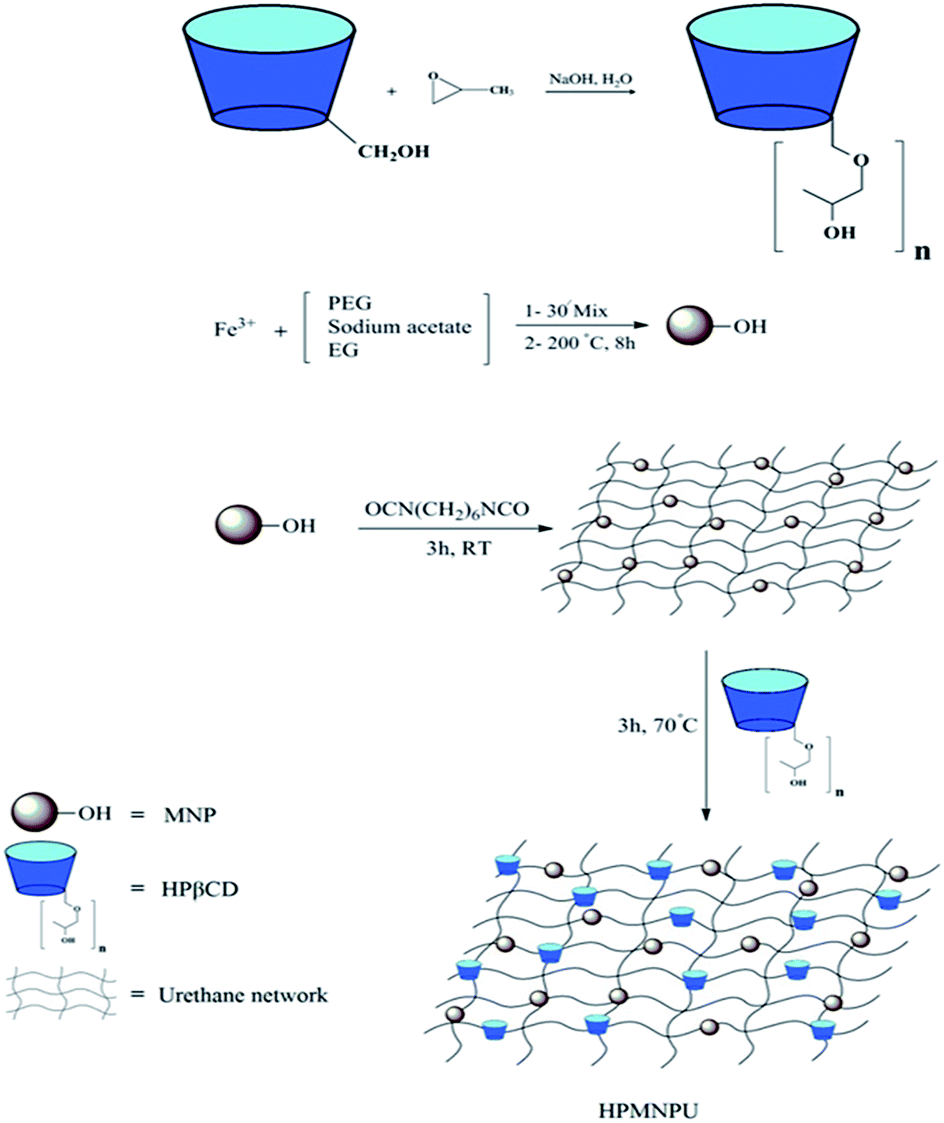
3.4. Mechanism of adsorbent synthesis
In Fig. 6, the mechanism of adsorbent synthesis is shown step by step; HPβCD was synthesized from βCD and then magnetic nanoparticles were synthesized from FeCl3·6H2O, after which magnetic nanoparticles were attached to polyurethane and HPβCD to the previous compound. A grid that has a magnetic particle and cyclodextrins is an active agent for dye adsorption on the grid.
 |
| | Fig. 6 Mechanism of adsorbent synthesis. | |
3.5. Adsorption optimization of crystal violet dye
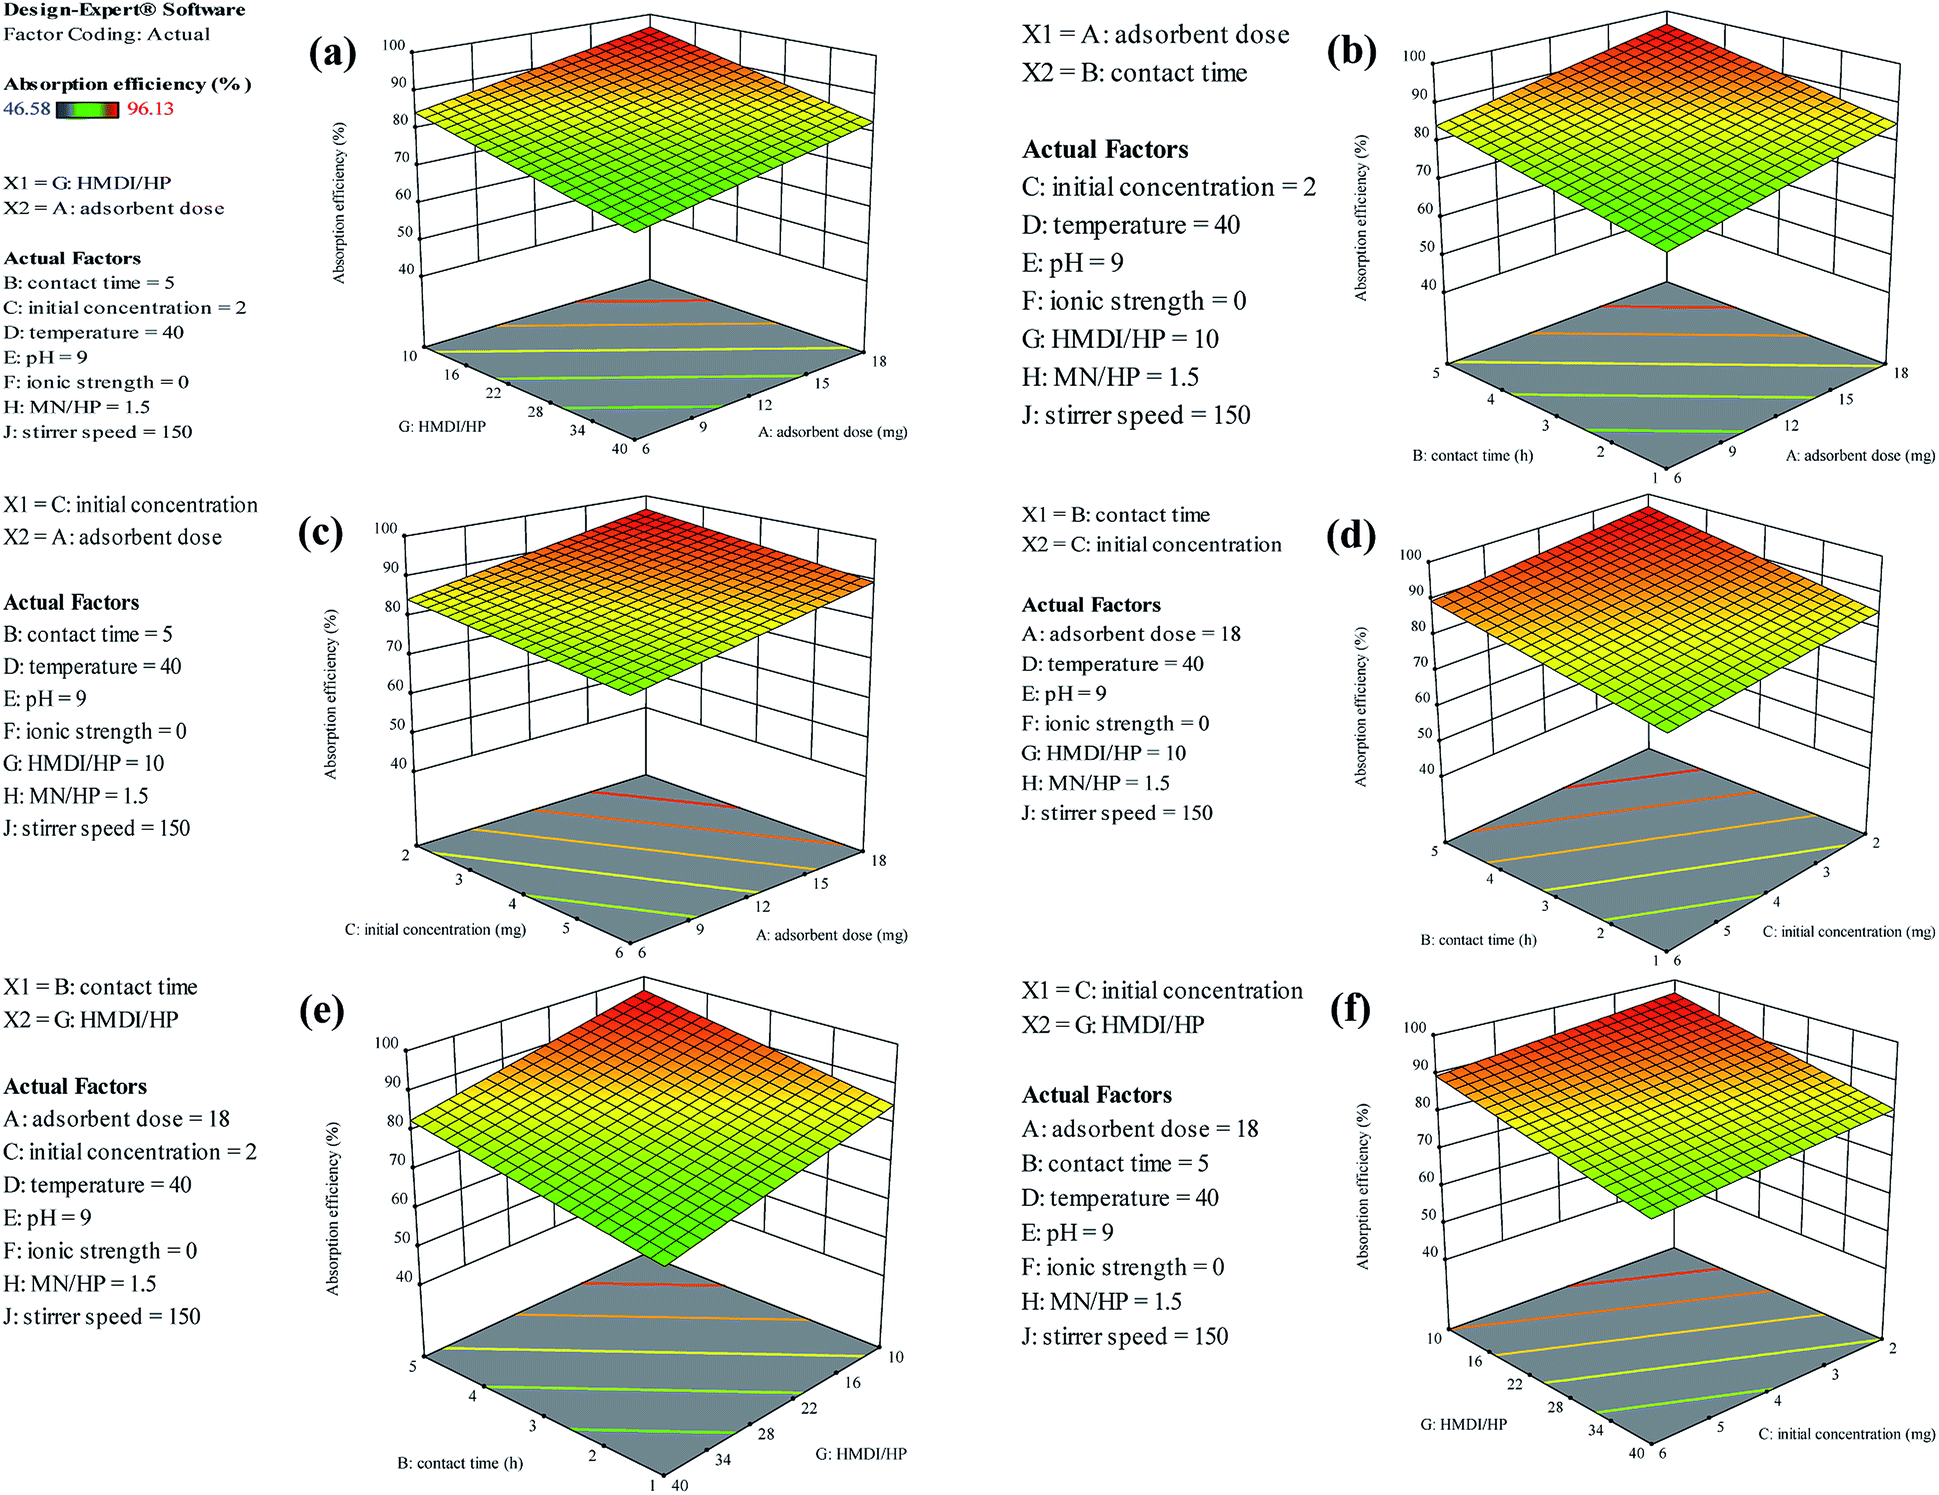
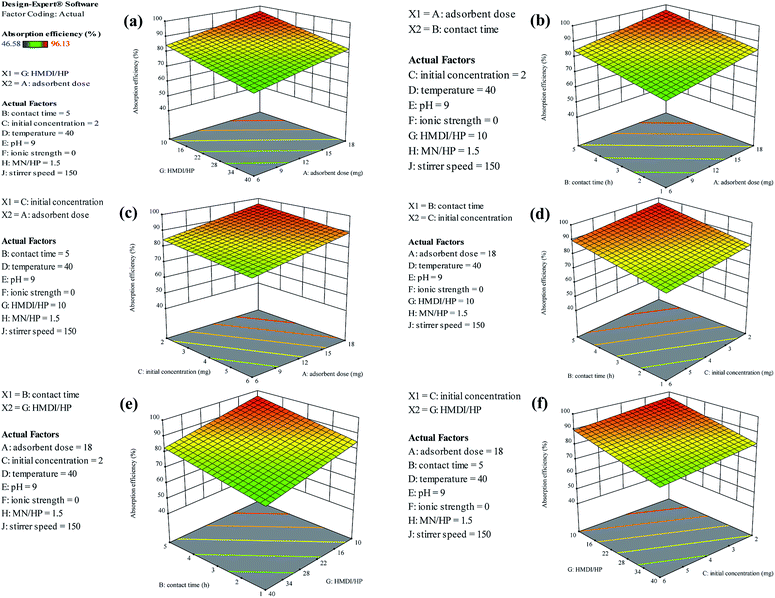
3.5.1. Effect of independent factors. Here, we examine interaction of factors in the rate of adsorption efficiency, and we start with the adsorbent dose and contact time factors, which have the most effect, respectively. As shown in Fig. 7(a), with the increase in the amount of adsorbent and the connection time, the adsorption efficiency also increases, which was predictable. In the next step, we examined the amount of adsorbents against the initial dye concentration. As shown in Fig. 7(b), the initial concentration of the dye has an inverse effect on the adsorption efficiency and with the increase in the initial concentration of the dye, the percentage of adsorption efficiency is reduced. As shown in Fig. 7(c), the HMDI/HP ratio also has a negative effect on the initial concentration of dye and by increasing this ratio, the adsorption efficiency decreases. The formation of a polymeric network increases the adsorption efficiency, but on the other hand, with an increase in the ratio of HMDI/HP, the adsorption efficiency decreases. This is most probably due to the congestion of the polymeric network and the avoidance of a good bond between the adsorbent and the dye. The rest of the impact factor graphs are shown in Fig. 7(d–f).
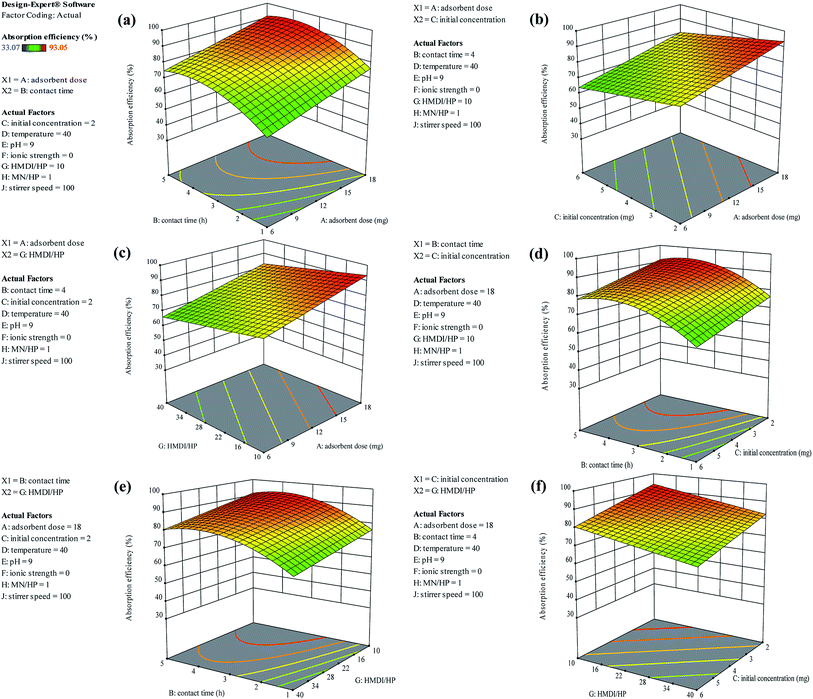 |
| | Fig. 7 Interaction of factors with the rate of adsorption efficiency. | |
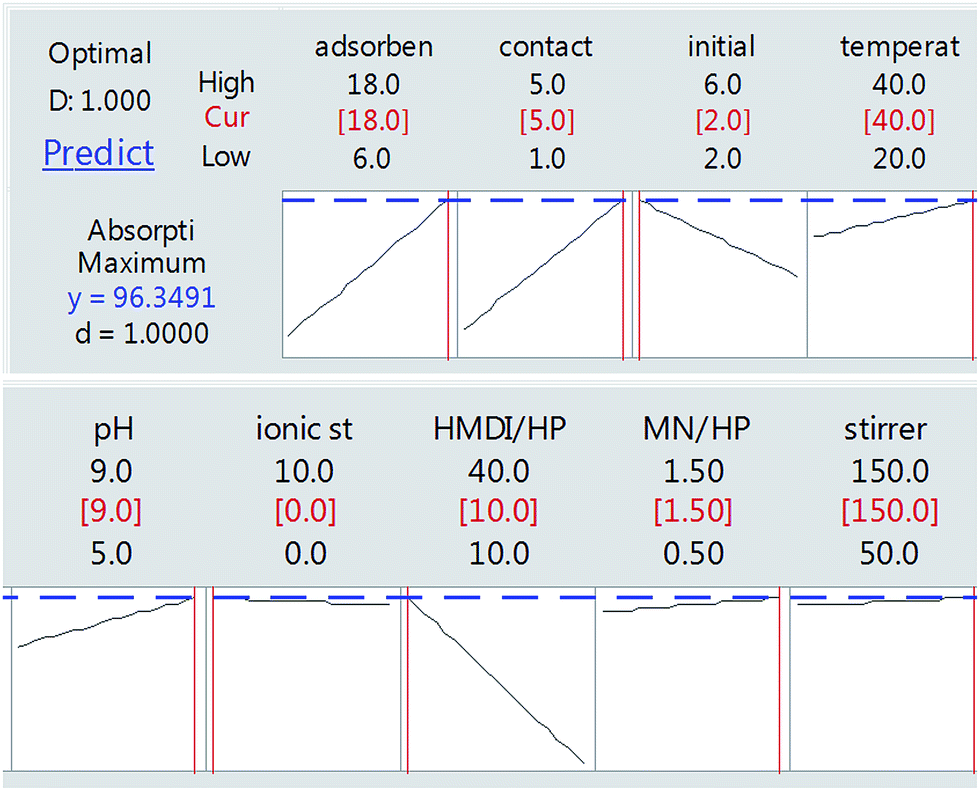
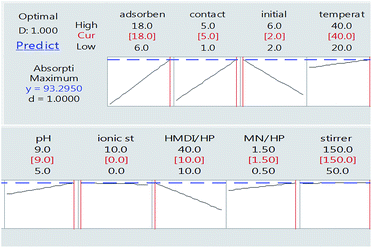
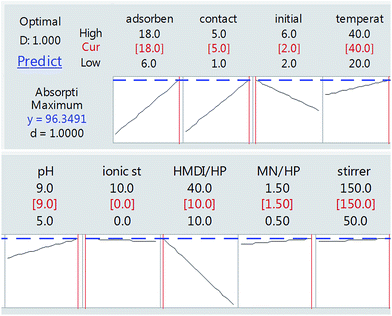
3.5.2. Response optimization: adsorption efficiency. Using the software mini tab 18 and Design Expert 11 and the definitive screening design (DSD) method, based on the results of the experiments, the following values were obtained for optimal conditions.As can be seen in Fig. 8, finally, we achieved the maximum removal of crystal violet dye under conditions in which the amount of adsorbent is 18 mg, the contact time is 5 h, the initial weight of the dye is 2 mg and the ratio of HMDI/HP is equal to 10. This was optimally checked three times and the following value was obtained.
 |
| | Fig. 8 Optimum conditions for maximum adsorption efficiency. | |
According to the results obtained in optimal conditions (Table 4) and the standard deviation value, it was determined that the experimental design performed with the practical test is in line with the predicted range.
Table 4 Results of the repeatability of the test and compliance with the design of experiments
| Experiment |
Adsorption efficiency% |
Average |
SD |
| 1 |
92.8 |
93.04 |
0.26 |
| 2 |
93.02 |
| 3 |
93.31 |
3.6. Effect of synthesized adsorbent compounds in the adsorption of crystal violet dye
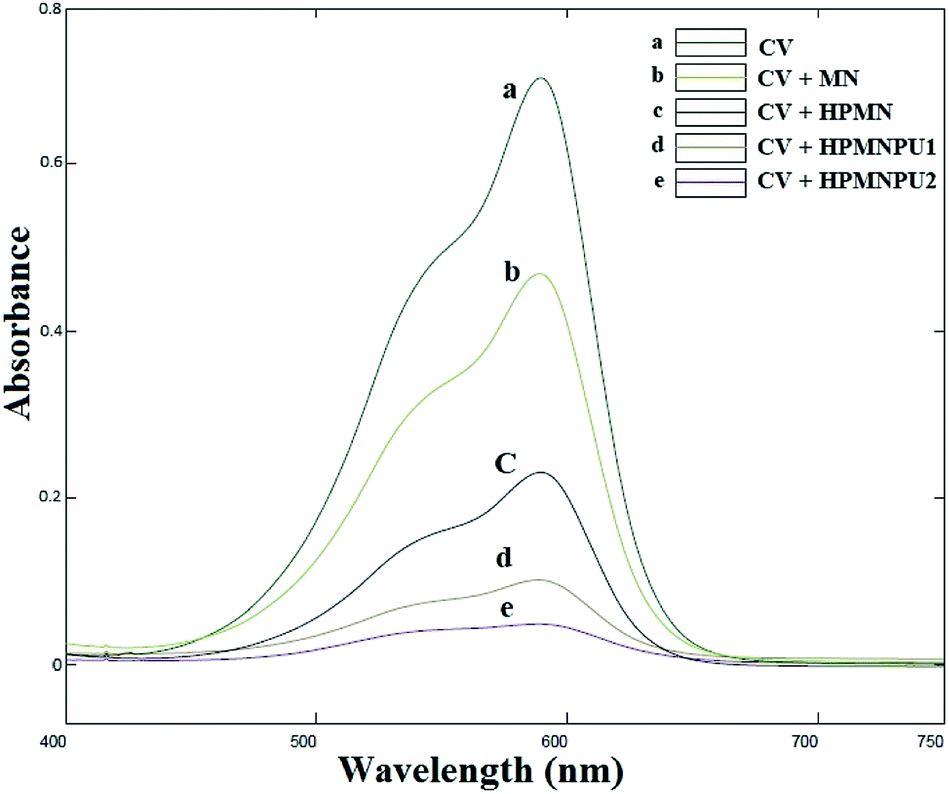
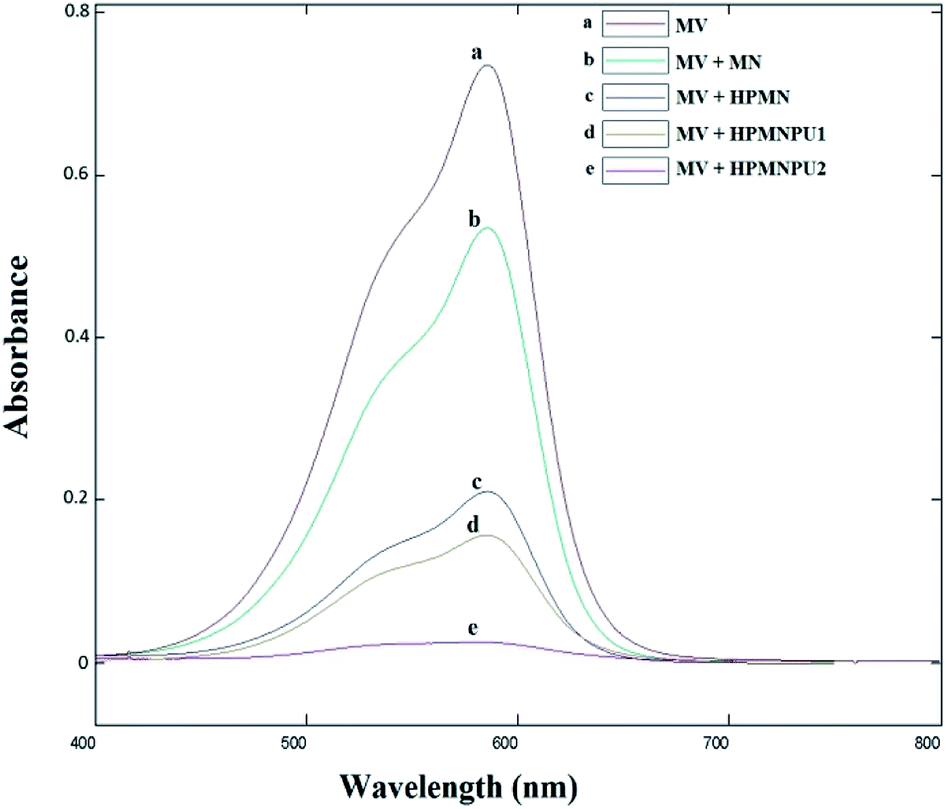
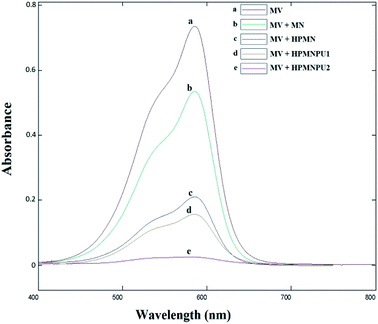
Absorption peak before and after using synthesized adsorbents for crystal violet dye are shown in Fig. 9 that spectrum-related to optimizing condition of crystal violet adsorption by specified adsorbents. As shown in the diagram, at each step of the modification, the amount of adsorption and the percentage of removal of the dye will be greater. Moreover, in HPMNPU2, we have the highest percentage of dye removal.
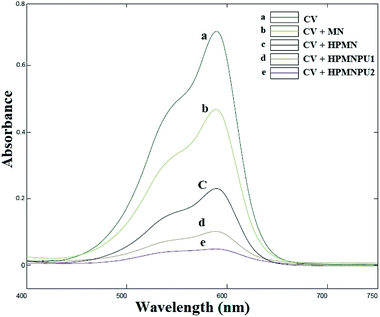 |
| | Fig. 9 Absorption spectra related to the optimizing condition of crystal violet adsorption by specified adsorbents. | |
3.7. Efficiency of adsorbents on crystal violet
The calibration curve of crystal violet dye was drawn to obtain the adsorption efficiency of each adsorbent, the comparison of which is given in Table 5; the highest adsorption efficiency is 93.04 belonging to the final synthesized compound, namely, HPMNPU2.
Table 5 Efficiency of adsorbents on crystal violet (amount of primary adsorption 0.703)
| Adsorbent |
MN |
HPMN |
HPMNPU1 |
HPMNPU2 |
| Adsorption decreased |
0.5 |
0.231 |
0.104 |
0.049 |
| Residual concentration (μM) |
6.9384 |
3.2075 |
1.4460 |
0.6831 |
| Adsorption efficiency% |
29.23 |
67.29 |
85.25 |
93.04 |
According to Table 5, the adsorption efficiency order on methyl violet dyes is as follows:
| Fe3O4 < HPMN < HPMNPU1 < HPMNPU2 |
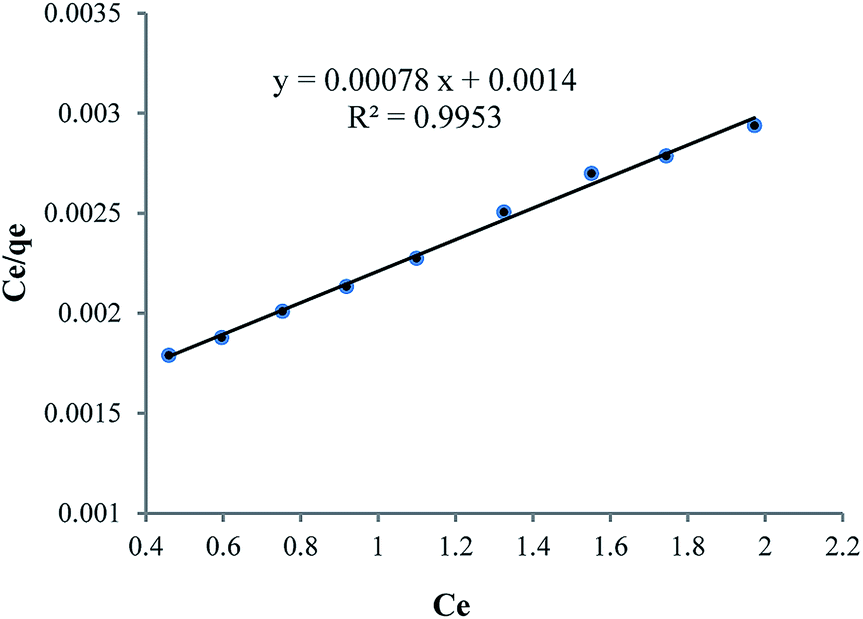
As can be seen in Table 6, because of nanoparticle of Fe3O4 has strong adsorption effect, that’s why it has been attempted to compare strength of adsorption between Fe3O4 nanoparticle and HPβCD, that mole amount of these two compounds is selected equally so that mole difference of HPβCD and Fe3O4 is considered an amount of Fe3O4 in HPMN too that it is shown high adsorption strength towards HPβCD. In the next step, it has been attempted to pick up the amount of HPβCD in three last compounds, approximately equal or less. By this work, the effect of polyurethane network formation on the adsorption of crystal violet dye is investigated correctly. As can be seen in the figure, the compound containing different ratios of HMDI to HPβCD has different effects, so that for HPMNPU1 compound the ratio of HMDI to HPβCD is 40 and the strength amount of adsorption is more than HPMN, but then for HPMNPU2, the ratio of HMDI to HPβCD is 10 and the HPβCD amount is more but has less adsorption strength. This is probably due to the formation of many networks of polyurethane than the HPβCD amount, so it causes congestion around HPβCD and it decreases accessibility probability and eventually HPMNPU2 compound has the largest amount of adsorption strength. A linear Langmuir adsorption isotherm is presented in Fig. 10. The isotherm was found to be linear over the entire concentration range studies with a good linear correlation coefficient (R2 = 0.9953).
Table 6 Amount of components of synthesized adsorbent compounds (g) in adsorption of crystal violet dye
| |
MN |
HPMN |
HPMNPU1 |
HPMNPU2 |
| Total amount of adsorbent (mg) |
5 |
13 |
52.2 |
18 |
| Fe3O4 |
5 |
3.3 |
1.8 |
1.5 |
| HPβCD |
— |
9.7 |
8.9 |
7.5 |
| HMDI |
— |
— |
41.4 |
9 |
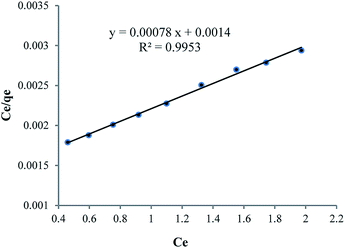 |
| | Fig. 10 Linear Langmuir adsorption isotherm. | |
The value of qm of linear expression of the Langmuir adsorption isotherm for crystal violet was determined to be 1269 mg g−1.
3.8. Evaluation of significant variables by DSD
DSD was also carried out for methyl violet dyes, resulting in model eqn (5):| | |
Adsorption efficiency = 67.10 + 1.001 adsorbent dose + 2.867 contact time − 1.701 initial concentration − 0.4507 HMDI/HP
| (5) |
Table 7 reports the estimates of the model coefficients together with the associated statistics. The coefficient of determination (R2) was equal to 89.57% for methyl violet dyes.
Table 7 Estimates of the regression coefficients of the model described by eqn (3) together with their corresponding standard errors (SE), t values (t) and p values (p) for methyl violet dyes
| Term |
Coef. |
SE Coef. |
T-Value |
P-Value |
| Constant |
69.63 |
1.10 |
63.33 |
0.000 |
| Adsorbent dose |
6.00 |
1.19 |
5.06 |
0.000 |
| Contact time |
5.73 |
1.19 |
4.83 |
0.001 |
| Initial concentration |
−3.40 |
1.19 |
−2.86 |
0.015 |
| Temperature |
1.64 |
1.19 |
1.38 |
0.195 |
| pH |
1.95 |
1.19 |
1.64 |
0.129 |
| Ionic strength |
−0.30 |
1.19 |
−0.25 |
0.803 |
| HMDI/HP |
−6.76 |
1.19 |
−5.69 |
0.000 |
| MN/HP |
0.59 |
1.19 |
0.49 |
0.631 |
| Stirrer speed |
0.34 |
1.19 |
0.29 |
0.780 |
From Table 7, Fig. 11 and 12, it can be seen that the effect of the factors on the removal of methyl violet dyes is similar to that of crystal violet. Adsorbent dose and contact time were the most influential factors and both had a positive effect on the adsorption efficiency. Dye concentration and HMDI/HP ratio had a negative effect on the adsorption efficiency. All factors that were not included in the model and p-value > 0.05 (temperature, pH, ionic strength, MN/HP ratio, and stirrer speed) were screened out. For some of them, it is not difficult to explain the absence or the small significance of their effect on the adsorbent.
 |
| | Fig. 11 Pareto chart of the standardized effects for methyl violet dyes. | |
 |
| | Fig. 12 Main effects plot for adsorption efficiency for methyl violet dyes. | |
3.9. Adsorption optimization of methyl violet dyes
3.9.1. Effect of independent factors. Herein, we examine effective of binary factors in the rate of adsorption efficiency, and we start with the HMDI/HP ratio and adsorbent dose factors, which have the major effects, respectively.As shown in Fig. 13(a), as it was predicted, with an increasing amount of adsorbent, the adsorption efficiency increased. However, on the other hand, the ratio of the HMDI/HP is in contrast to the adsorption efficiency and increasing the HMDI/HP decreases the amount of adsorption efficiency. As shown in Fig. 13(b), both the adsorbent dose and contact time factors have a direct relation to the adsorption efficiency and, with their increase, the percentage of adsorption efficiency also increases. As shown in Fig. 13(c), the initial concentration also has an inverse relationship with the adsorption efficiency and with its increase, the percentage of adsorption efficiency decreases and the rest of the impact factor graphs are visible in Fig. 13(d–f).
 |
| | Fig. 13 Interaction of factors with the rate of adsorption efficiency. | |
3.9.2. Response optimization: adsorption efficiency for methyl violet dyes. As can be seen in Fig. 14, finally, the optimum conditions for the removal of methyl violet dyes are similar to that required for the removal of crystal violet dye. This was optimally checked three times and the following value was obtained.
 |
| | Fig. 14 Optimum conditions for maximum adsorption efficiency for methyl violet dyes. | |
According to the results obtained under optimal conditions (Table 8) for methyl violet dyes and the standard deviation value similar to the crystal violet dye, it was determined that the design of the experiment performed with the practical test is in line with the predicted range.
Table 8 Results of the repeatability of the test and compliance with the design of experiments for methyl violet dyes
| Experiment |
Adsorption efficiency% |
Average |
SD |
| 1 |
95.88 |
96.10 |
0.27 |
| 2 |
96.4 |
| 3 |
96.01 |
3.10. Effect of synthesized adsorbent compounds on the adsorption of methyl violet dyes
Adsorbents were analyzed for methyl violet dye too because of investigation about adsorbing strength of adsorbents against this dye. The adsorption strength of adsorbents, according to Fig. 14, is maximum under optimized conditions, especially on crystal violet. In the meantime, the effect of the synthesized adsorbent HPMNPU2 on methyl violet adsorption is shown in Table 9.
Table 9 Adsorption efficiency of methyl violet (amount of primary adsorption 0.736)
| Adsorbent |
MN |
HPMN |
HPMNPU1 |
HPMNPU2 |
| Absorption decreased |
0.535 |
0.210 |
0.150 |
0.028 |
| Residual concentration (μM) |
12.968 |
5.08 |
3.623 |
0.589 |
| Adsorption efficiency% |
24.87 |
70.57 |
79.01 |
96.1 |
3.11. Adsorption efficiency of methyl violet dyes
As shown in Fig. 15 and the numbers in Table 9, here too, the conditions are similar to those of crystal violet dye; based on the calibration curve, the adsorption percentage for each adsorbent was obtained, and HPMNPU2 has the highest adsorption power and adsorbed 96.1% dyes.
 |
| | Fig. 15 Spectra related to optimizing condition of methyl violet adsorption by specified adsorbents. | |
Regarding Table 9, the adsorption efficiency order for methyl violet dyes is given below:
| Fe3O4 < HPMN < HPMNPU1 < HPMNPU2 |
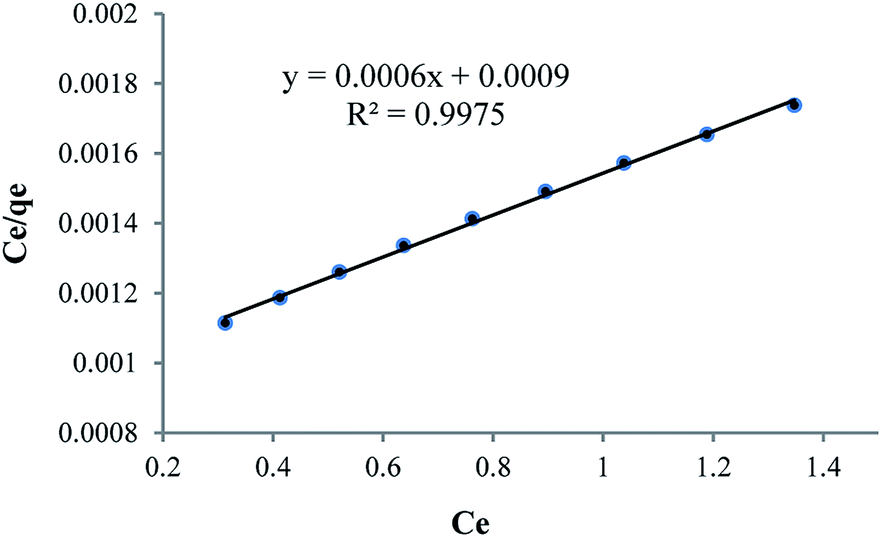
As can be seen in Table 10 , because of nanoparticle of Fe3O4 has strong adsorption effect, that’s why it has been attempted to compare strength of adsorption between Fe3O4 nanoparticle and HPβCD, that mole amount of these two compounds is selected equally so that mole difference of HPβCD and Fe3O4 is considered an amount of Fe3O4 in HPMN too that it is shown high adsorption strength towards HPβCD. This difference in this dye is more than that for crystal violet dye, which is probably because it has less steric repulsion and freer nitrogen, and hence makes it easier for βCD. In the next step, it has been attempted to pick up the amount of HPβCD in three last compounds approximately equal. By this work, the effect of polyurethane network formation on the adsorption of crystal violet dye is investigated correctly. As can be seen in the figure, polyurethane network formation in this dye has two opposite effects, so that in HPMNPU1 the ratio of HMDI to HPβCD is about 40 and the adsorption strength amount is more than that for HPMN. While in HPMNPU2, in which the ratio of HMDI to HPβCD is 10, this effect is presumably due to the formation of many polyurethane networks than HPβCD amount. Therefore, it causes crowding around HPβCD and decreases the accessibility probability. Finally, HPMNPU2 has the largest strength of adsorption and there is another significant point that one of the nitrogen atoms of methyl violet dyes is freer than that of crystal violet, and it has better linkage with adsorbent hydroxyl groups. That's why for methyl violet, we need less adsorbent amount because the linkage between the adsorbent and the dye is better. A linear Langmuir adsorption isotherm is presented in Fig. 16, which is similar to that of crystal violet; for methyl violet the isotherm was found to be linear over the entire concentration range studies with a good linear correlation coefficient (R2 = 0.9975).
Table 10 Amount of components of synthesized adsorbent compounds (mg) for the adsorption of methyl violet dyes
| |
MN |
HPMN |
HPMNPU1 |
HPMNPU2 |
| Total amount of adsorbent (mg) |
4 |
10.5 |
45 |
18 |
| Fe3O4 |
4 |
2.6 |
1.5 |
1.5 |
| HPβCD |
— |
7.9 |
7.7 |
7.5 |
| HMDI |
— |
— |
35.7 |
9 |
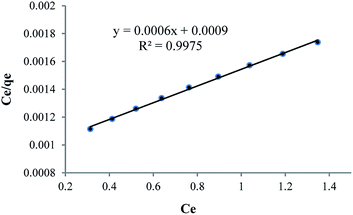 |
| | Fig. 16 Linear Langmuir adsorption isotherm for methyl violet. | |
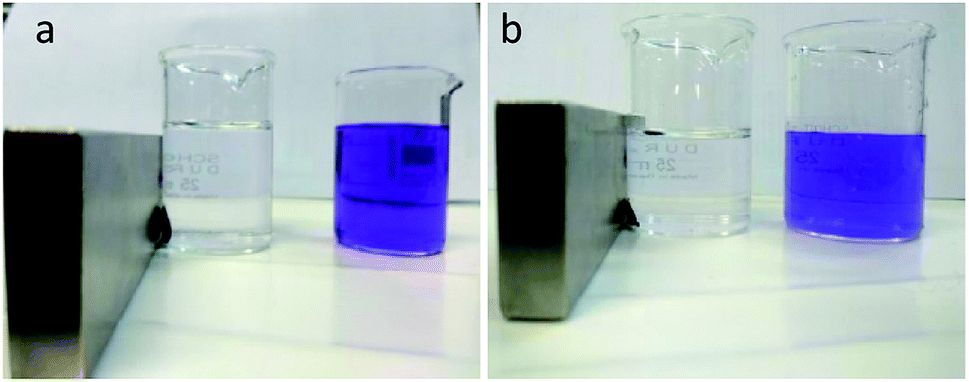
The value of qm of linear expression of the Langmuir adsorption isotherm for methyl violet was determined to be 1667 mg g−1. Dye removal of methyl violet and crystal violet is shown in Fig. 17(a) and (b) before and after using, respectively. As can be seen in the figure, the adsorbent with high yield has decreased dye impurity and then we can separate the adsorbent after the dye absorption.
 |
| | Fig. 17 Removal of methyl violet dye (a) and crystal violet dye (b). | |
3.12. Comparison with other adsorbents
To provide a clear judgment for readers to accurately acquire more information regarding the significance of the current nanoadsorbent, a comparison study was also undertaken as summarized in Table 11. As could be seen, the adsorption capacity (qm; mg g−1) of HPMNPU was overall greater than those recorded previously, confirming its high-performance ability to remove CV and MV dyes from water.
Table 11 Comparison with different solid adsorbents
| Row |
Adsorbent |
Dye |
qmax (mg g−1) |
Ref. |
| 1 |
Biogenic β-CD functionalized Fe0 NPs |
CV |
454 |
43 |
| 2 |
EDTA-cross-linked β-cyclodextrin (EDTA-β-CD) |
CV |
113.9 |
44 |
| 3 |
p(NIPAM-co-MAA1.0)/β-CD0.4 |
CV |
1253.7 |
45 |
| 4 |
Polyacrylamide |
MV |
1136 |
46 |
| 5 |
Poly(acrylic acid-co-acrylamide)/attapulgite composite |
MV |
1194 |
47 |
| 6 |
H-XG/SiO2 |
MV |
378.8 |
48 |
| 7 |
HNT-Fe3O4 |
MV |
20.04 |
49 |
| 8 |
XG-cl-pAA/rGO hydrogel composite |
MV |
1052.6 |
50 |
| 9 |
HPG-based MMG |
MV |
400 |
51 |
| 10 |
GA-cl-poly(AAm) NHG |
CV |
90.9 |
52 |
| 11 |
Magnetic nanoparticles modified with SDS |
CV |
167 |
53 |
| 12 |
Rarasaponin–bentonite-activated biochar composite |
CV |
518.6 |
54 |
| 13 |
HPMNPU |
CV |
1269 |
This study |
| 14 |
HPMNPU |
MV |
1667 |
This study |
4. Conclusions
The results obtained in this study indicate that a DSD approach can be effectively used to identify the factors that most affect the removal of methyl violet and crystal violet dyes. Application of this procedure for dye removal allowed reducing the total number of runs from over 500, which would have been required while using the traditional screening/RSM approach, to only 21. Using the DSD, it was found that out of the 9 initial factors, four factors that had the most impact on dye removal had produced acceptable results. Based on the results, the adsorbent dose and contact time have a positive effect and, on the other side, the HMDI/HPβCD ratio and dye concentration have a negative effect on the removal efficiency. As can be expected, the adsorption efficiency in each stage improved and the elimination of dye impurities is done correctly. The yield of crystal violet adsorption with the final synthesized compound (HPMNPU2) was calculated to be 93.04% and for methyl violet with HPMNPU2, it was calculated to be 96.1%. The maximum adsorption amount reached 1269 mg g−1 and 1667 mg g−1 for CV and MV, respectively. The efficiency order of adsorption for both dyes is shown below:
| Fe3O4 < HPMN < HPMNPU1 < HPMNPU2 |
The final results indicated that HPMNPU2 is a novel nanocomposite-based adsorbent, which shows excellent cationic dye removal efficiency from aqueous solutions.
Author contributions
All authors contributed to the analysis of data and the preparation of the manuscript.
Conflicts of interest
The authors declare no conflicts of interest.
Abbreviations
| PU | Polyurethane |
| HPβCD | Hydroxypropyl-β-cyclodextrin |
| HPMN | HP-β-cyclodextrin conjugated magnetic nanoparticles |
| HPMNPU | HPMN–polyurethane |
| 40 | The ratio of HMDI to HPβCD in the HPMNPU1 compound |
| 10 | The ratio of HMDI to HPβCD in the HPMNPU2 compound |
| DSD | Definitive screening design |
Acknowledgements
We acknowledge the financial support from University of Guilan (Rasht, Iran).
References
- R. Zhao, Y. Wang and X. Li, ACS Appl. Mater. Interfaces, 2015, 7(48), 26649–26657 CrossRef CAS PubMed.
- M. Sowmiya and A. K. Tiwari, J. Phys. Chem. C, 2014, 118(5), 2735–2748 CrossRef CAS.
- E. Ayranci and O. Duman, Sep. Purif. Technol., 2009, 44, 3735–3752 CAS.
- O. Duman and C. Ozcan, Environ. Pollut., 2019, 244, 723–732 CrossRef CAS PubMed.
- O. Duman and S. Tunc, Carbohydr. Polym., 2016, 147, 79–88 CrossRef CAS PubMed.
- O. Duman and S. Tunc, J. Alloys Compd., 2016, 687, 370–383 CrossRef CAS.
- O. Duman and S. Tunc, Appl. Clay Sci., 2015, 109–110, 22–32 CrossRef CAS.
- O. Duman and S. Tunc, Microporous Mesoporous Mater., 2015, 210, 176–184 CrossRef CAS.
- M. Gholami, M. T. Vardini and G. R. Mahdavinia, Carbohydr. Polym., 2016, 136, 772–781 CrossRef CAS PubMed.
- K. Y. Win and S. Feng, Biomaterials, 2005, 26, 2713–2722 CrossRef CAS PubMed.
- A. Solanki, J. Mehta and S. Thakore, Carbohydr. Polym., 2014, 110, 338–344 CrossRef CAS PubMed.
- A. R. Solanki, B. V Kamath and S. Thakore, RSC Adv., 2015, 42223, 1–12 Search PubMed.
- F. Zia, K. M. Zia, M. Zuber, S. Kamal and N. Aslam, Carbohydr. Polym., 2015, 134, 784–798 CrossRef CAS PubMed.
- S. Gould and R. C. Scott, Food Chem. Toxicol., 2005, 43, 1451–1459 CrossRef CAS PubMed.
- J. Chomoucka, J. Drbohlavova, D. Huska and V. Adam, Pharmacol. Res., 2010, 62, 144–149 CrossRef CAS PubMed.
- Z. L. Liu, H. B. Wang, Q. H. Lu and G. H. Du, J. Magn. Magn. Mater., 2004, 283, 258–262 CrossRef CAS.
- L. C. A. Oliveira, R. V. R. A. Rios and J. D. Fabris, Appl. Clay Sci., 2003, 22, 169–177 CrossRef CAS.
- D. M. Wu, H. P. Xu, F. X. Qiu and D. Y. Yang, Polym.-Plast. Technol. Eng., 2011, 50, 498–508 CrossRef CAS.
- H. T. Chiu, H. M. Yang and C. S. Liu, Polym.-Plast. Technol. Eng., 2012, 51, 943–951 CrossRef.
- M. Bakar, M. Lavorgna and J. Szymanska, Polym.-Plast. Technol. Eng., 2012, 51, 675–681 CrossRef CAS.
- H. P. Xu, D. Y. Yang, Q. Guo and Y. Y. Wang, Polym.-Plast. Technol. Eng., 2012, 51, 50–57 CrossRef CAS.
- K. Dong, X. R. Guo and J. C. Xu, Polym.-Plast. Technol. Eng., 2012, 51, 754–759 CrossRef CAS.
- F. Zha, S. G. Li and Y. Chang, J. Membr. Sci., 2008, 321, 316–323 CrossRef CAS.
- A. Z. M. Badruddoza, G. S. S. Hazel and K. Hidajat, Colloids Surf. A, 2010, 367, 85–95 CrossRef CAS.
- B. Jones and C. Nachtsheim, J. Qual. Technol., 2011, 43, 1–15 CrossRef.
- W. Hu, X. Wu and F. Jiao, Desalin. Water Treat., 2016, 4, 1–12 Search PubMed.
- M. Malanga, J. Szem and E. Fenyvesi, J. Pharm. Sci., 2016, 1–11 Search PubMed.
- A. Solanki, S. Sanghvi, R. Devkarb and S. Thakore, RSC Adv., 2016, 6, 98693–98707 RSC.
- I. Langmuir, J. Am. Chem. Soc., 1916, 38, 2221–2295 CrossRef CAS.
- Y. Zhou and M. Zhang, Ind. Eng. Chem. Res., 2014, 53, 5498–5506 CrossRef CAS.
- A. Ozcan and A. S. Ozcan, J. Hazard. Mater., 2005, 124, 200–208 CrossRef PubMed.
- B. Meroufel and O. Benali, J. Mater. Environ. Sci., 2013, 4, 482–491 CAS.
- H. N. Thanh, L. T. Dai and M. D. Hung, J. Nanosci. Nanotechnol., 2010, 3, 35001–35007 Search PubMed.
- P. Granitzer, K. Rump and M. Venkatesan, J. Electrochem. Soc., 2010, 157, 145–151 CrossRef.
- Y. Chao, L. Benguo and L. Hui, Carbohydr. Polym., 2015, 118, 36–40 CrossRef PubMed.
- S. George and D. Vasudevan, J. Young Pharm., 2012, 4, 220–227 CrossRef CAS PubMed.
- S. Archana and S. Shridhar, RSC Adv., 2016, 6, 98693–98707 RSC.
- K. S. Loh, A. Musa and L. y. heng, Sensors, 2008, 8, 5775–5791 CrossRef CAS PubMed.
- J. Gong and X. Lin, Microchem. J., 2003, 75, 51–57 CrossRef CAS.
- M. H. Liao and D. H. Chen, Biotechnol. Lett., 2001, 23, 1723–1727 CrossRef CAS.
- B. Topal and D. C. Altındal, Int. J. Pharm., 2015, 496, 801–811 CrossRef CAS PubMed.
- J. Su, J. Chen and H. Zhang, Chem. Pharm. Bull., 2012, 60, 736–742 CrossRef CAS PubMed.
- J. Nasiri and E. Motamedi, J. Hazard. Mater., 2019, 367, 325–338 CrossRef CAS PubMed.
- Z. Feiping and R. Eveliina, Environ. Sci. Technol., 2015, 49(17), 10570–10580 CrossRef PubMed.
- J. Shuyue and T. Dongyan, Carbohydr. Polym., 2019, 208, 486–494 CrossRef PubMed.
- J. Rahchamani and H. Zavvar Mousavi, Desalination, 2011, 267, 256–260 CrossRef CAS.
- Y. Wang and L. Zeng, J. Environ. Sci., 2010, 22, 7–14 CrossRef CAS.
- S. Ghorai and A. Sarkar, ACS Appl. Mater. Interfaces, 2014, 6, 4766–4777 CrossRef CAS PubMed.
- L. R. Bonetto and F. Ferrarini, J. Water Process Eng., 2015, 6, 11–20 CrossRef.
- E. Makhado and S. Pandey, Int. J. Biol. Macromol., 2018, 119, 255–269 CrossRef CAS PubMed.
- Y. Song and Y. Duan, J. Colloid Interface Sci., 2018, 529, 139–149 CrossRef CAS PubMed.
- G. Sharma and A. Kumar, Carbohydr. Polym., 2018, 202, 444–453 CrossRef CAS PubMed.
- C. Muthukumaran and V. M. Sivakumar, J. Taiwan Inst. Chem. Eng., 2016, 1–9 Search PubMed.
- L. Laysandra and F. H. Santosa, Environ. Sci. Pollut. Res., 2018, 25, 30680–30695 CrossRef CAS PubMed.
|
| This journal is © The Royal Society of Chemistry 2019 |
Click here to see how this site uses Cookies. View our privacy policy here. 
 Open Access Article
 This Open Access Article is licensed under a Creative Commons Attribution-Non Commercial 3.0 Unported Licence
 *
*