 Open Access Article
Utilization of 7-chloro-4-nitrobenzo-2-oxa-1,3-diazole (NBD-Cl) for spectrochemical determination of L-ornithine: a multivariate optimization-assisted approach
Hend Aly ,
Ahmed S. El-Shafie
 and
Marwa El-Azazy
 *
*
Department of Chemistry and Earth Science, College of Arts and Sciences, Qatar University, Doha 2713, Qatar. E-mail: marwasaid@qu.edu.qa
First published on 16th July 2019
Abstract
A simple and highly sensitive univariate calibration strategy based on ultraviolet-visible (UV-Vis) absorption spectroscopy and assisted by multivariate screening and optimization was utilized for the determination of L-ornithine (L-ORN) as such and in the alimentary supplements. L-ORN, an OTC marketed amino acid, is widely used for bodybuilding and might be abused by athletes. A nucleophilic substitution reaction using 7-chloro-4-nitrobenzo-2-oxa-1,3-diazole (NBD-Cl) was the basis of the current investigation. Plackett–Burman design (PBD) and a response surface optimizer as screening and fine-tuning strategies, respectively, were instigated. Four numerical variables, reaction time (RT), temperature (Temp), pH and reagent volume (RV), and one categorical variable, the diluting solvent (DS), were considered. Absorbance of the yellow-colored adduct at 469 nm was the response studied. Pareto analysis, along with analysis of variance (ANOVA) were used to ascertain the significant variables (screening phase) and their domains (optimization phase). Response transformation and stepwise analysis were employed when necessary. Probability, cube and individual value plots were used to get an insight into the statistical impact of the variables tested. Multiple responses' optimization was performed using Derringer's function. Calibration curves were linear in the range of 5–50 μg mL−1. Job's technique of continuous variation showed that the stoichiometric ratio is 2![[thin space (1/6-em)]](https://www.rsc.org/images/entities/char_2009.gif) :
:![[thin space (1/6-em)]](https://www.rsc.org/images/entities/char_2009.gif) 1 (NBD-Cl
1 (NBD-Cl![[thin space (1/6-em)]](https://www.rsc.org/images/entities/char_2009.gif) :
:![[thin space (1/6-em)]](https://www.rsc.org/images/entities/char_2009.gif) L-ORN). The proposed technique was successfully applied to the dietary supplements of L-ORN, inferring no interference from adjuvants and excipients. Analytical performance of this technique was validated conforming to the ICH standards.
L-ORN). The proposed technique was successfully applied to the dietary supplements of L-ORN, inferring no interference from adjuvants and excipients. Analytical performance of this technique was validated conforming to the ICH standards.
1. Introduction
Dietary supplements are a broad term that includes a wide range of products that are administered based on a prescription or over-the-counter (OTC), due to their health impacts. Worldwide sales of dietary supplements are going through a hasty growth. This dramatic progression together with the overall absence of an obligation to pass operative directions and regulations makes this market more liable to deceitful procedures, possible adulteration, and a greater incidence of safety and quality concerns. Alimentary supplements, especially those stemming from natural origins, are the most commonly used. On the one hand, because they are natural, this is a magic word that attracts customers who think that there will be no side-effects. On the other hand, since they are natural, they are available at low prices.1,2 The availability of sound, reliable, and sensitive techniques for the determination of these compounds per se and in the marketed formulations then becomes crucial. Moreover, understanding the nature (chemical and physical) of these compounds before developing an analytical technique is an important step.L-Ornithine (L-ORN), chemically known as (+)-(S)-2,5-diaminovaleric acid, is shown in Scheme 1. As a non-essential amino acid, it is not necessary for L-ORN to be included in humans' diets as it is already synthesized in their bodies. L-ORN is a non-proteinogenic amino acid, which is not coded naturally in the DNA, and is produced as an intermediate component of the urea cycle.3–5 L-ORN is one of the OTC dietary supplements that is commonly used by athletes where it is thought to have a role in increasing the mass of the muscles, as well as an ability to enhance the performance through increasing strength, the production of Human Growth Hormone (HGH) and improving fat metabolism. Moreover, L-ORN has a main role in burning up excess fat in the body and is used for enhancing the workability of the immune system.3–7
Several techniques were reported in the literature for the determination of L-ORN. These techniques are mainly chromatography based.8–10 The limitations of these techniques could be summarized as univariate-based, expensive, time consuming and the requirement for well-trained staff. Spectrophotometric and spectrofluorometric analyses were also used to determine L-ORN following the formation of a colored derivative since L-ORN does not have a chromophore.11 The reported study was multivariate analysis (MVA) based and employed the Hantzsch condensation reaction. The reported approach, however, could determine L-ORN in a limited concentration range.
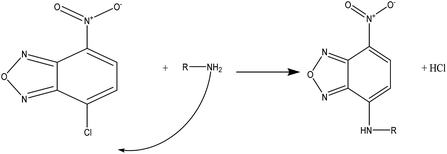
In this study, the determination of L-ORN in its both forms (per se and supplements) will be performed through nucleophilic substitution reaction using 7-chloro-4-nitrobenzo-2-oxa-1,3-diazole (NBD-Cl), Scheme 2. NBD-Cl is a commonly used reagent for the quantitative determination of thiols and amines.12–15
As mentioned, the literature shows that the majority of techniques reported to determine L-ORN were univariate analysis-based (UVA) implying that each variable was treated as a separate entity, an issue that does not provide any idea about the interaction between the factors. Moreover, each variable investigation would require a large number of experiments to be performed. On the contrary, multivariate analysis (MVA) which is used in this study has the ability to overcome these limitations. Furthermore, the results of MVA would provide an idea about the relationship between all the factors that might affect the reaction with a high degree of inevitability.16
Plackett–Burman design (PBD) is the screening design that is used in this study. This design is a type of fractional factorial design. The main advantage of using the PBD is that it can investigate a large number of factors with the least number of experiments, as it ignores completely the interactions between the factors. Moreover, PBD is commonly used in the pharmaceutical industry because of its economical and effectual procedures.17–19 Four numerical variables that are thought to have an impact on the reaction, pH, the temperature of the reaction (Temp), volume of the reagent (RV) and the reaction time (RT), plus one categorical factor, the diluting solvent (DS), will be considered.11
The current study aims to develop a simple, sensitive and accurate analytical method based on UV-Vis absorption spectroscopy and 7-chloro-4-nitrobenzo-2-oxa-1,3-diazole (NBD-Cl) for determining L-ORN in its pure form and in dietary supplements with the lowest possible experimental efforts, implementing PBD as a multivariate optimization approach. To the best of our knowledge, the method we are proposing herein has not been reported before. The proposed univariate calibration strategy assisted by multivariate screening and optimization can be implemented as a quality control approach for the routine analysis of L-ORN especially in developing countries where sophisticated techniques like chromatography might not be available.
2. Experimental
2.1 Instruments and software
A UV-Vis spectrophotometer (Agilent diode-array, USA) with 10 mm matched quartz cells was used to measure the absorbance of the samples. Laboratory water bath (MLV, Salvis AG Emmenbruck, Germany) was used to heat the prepared samples to the temperature needed for the reaction. A pH meter (Jenway, UK) was used to adjust the buffers that were prepared, and an analytical balance was used to measure the mass that was needed.Minitab®18 software was purchased from Minitab Inc., State College, Pennsylvania, USA. The software was used to make the list of experiments according to the selected design.
2.2 Materials
L-Ornithine monohydrochloride (L-ORN), NBD-Cl, methanol, sodium hydroxide, sodium tetraborate-10-hydrate (Na2B4O7·10H2O) and hydrochloric acid were all purchased from Sigma-Aldrich, Germany and used without further purification. Now Foods® dietary supplement capsules (500 mg ORN per capsule) were purchased from a local hypermarket, Doha, Qatar.2.3 Reagents and standards
Stock solutions of L-ORN and NBD-Cl (1 mg mL−1) in distilled water (DW) and in methanol, respectively, were freshly prepared on site. Serial dilutions were prepared in the same solvents. Several solutions of borate buffer with a pH range of 7–11 were prepared by using a mixture of (Na2B4O7·10H2O) and 0.1 M NaOH or 0.1 M HCl. To prepare 50 mM of (Na2B4O7·10H2O), 4.767 g was dissolved in 250 mL DW.202.4 General procedure
| Variables | Low (−1) | Center point (0) | High (+1) |
|---|---|---|---|
| Numerical variables | |||
| pH, A | 7 | 9 | 11 |
| Temperature (°C), B | 55 | 67.5 | 80 |
| Reaction time (min), C | 5 | 30 | 35 |
| Reagent volume (mL), D | 0.2 | 1.1 | 2 |
| Categorical variables | ||
| Diluting solvent, E | Distilled water (DW) | Methanol (MeOH) |
| Run no | Variables | Response | ||||||
|---|---|---|---|---|---|---|---|---|
| A | B | C | D | E | Y1* | Y1** | Y1*** | |
| a (pH, (A)), (temperature, Temp (B), °C), (reaction time, RT, (C) min), (reagent volume, RV, (D) mL), (solvent type, DS, (E) methanol or distilled water), absorbance (Abs at 469 nm). *Experimental values for Y1. **Predicted values before response transformation: Y1** = −0.176 − 0.0207pH + 0.00360Temp + 0.00699RT + 0.1366volume of NBD-Cl − 0.0479DS − 0.1670Ct Pt. ***Predicted values after response transformation: ln(Y1***) = −7.26 − 0.1499pH + 0.0532Temp + 0.0421RT + 1.307volume of NBD-Cl + 0.051 DS − 2.801Ct Pt. | ||||||||
| 01 | 9 | 67.5 | 20 | 1.1 | Water | 0.0021 | 0.0521 | 0.0037 |
| 02 | 11 | 80 | 5 | 2.0 | Methanol | 0.1040 | 0.1451 | 0.1691 |
| 03 | 7 | 55 | 35 | 2.0 | Methanol | 0.2440 | 0.3476 | 0.2880 |
| 04 | 7 | 55 | 5 | 2.0 | Methanol | 0.0554 | 0.1378 | 0.0814 |
| 05 | 7 | 80 | 35 | 0.2 | Methanol | 0.1966 | 0.1916 | 0.1036 |
| 06 | 7 | 80 | 35 | 2.0 | Water | 0.7346 | 0.5332 | 0.9830 |
| 07 | 7 | 80 | 5 | 0.2 | Water | 0.0391 | 0.0776 | 0.0264 |
| 08 | 7 | 55 | 5 | 0.2 | Water | 0.0058 | 0.0086 | 0.0070 |
| 09 | 9 | 67.5 | 20 | 1.1 | Methanol | 0.0040 | 0.0043 | 0.0041 |
| 10 | 11 | 80 | 5 | 2.0 | Water | 0.1871 | 0.2408 | 0.1526 |
| 11 | 11 | 55 | 35 | 0.2 | Water | 0.0058 | 0.1148 | 0.0136 |
| 12 | 9 | 67.5 | 20 | 1.1 | Water | 0.0045 | 0.0521 | 0.0037 |
| 13 | 11 | 55 | 35 | 2.0 | Water | 0.0890 | 0.3607 | 0.1428 |
| 14 | 11 | 55 | 5 | 0.2 | Methanol | 0.0068 | 0.0191 | 0.0043 |
| 15 | 9 | 67.5 | 20 | 1.1 | Methanol | 0.0063 | 0.0436 | 0.0041 |
| 16 | 11 | 80 | 35 | 0.2 | Methanol | 0.0360 | 0.1090 | 0.0569 |
3. Results and discussion
3.1 Nucleophilic substitution reaction (SN2)
In general, the detection of amines and amino acids needs a derivatization step. The main goal of that step is to increase the detection limit at these conditions. NBD-Cl, a commonly used derivatizing agent, has an absorption maximum at 342 nm.12–14NBD-Cl generally reacts with primary and secondary amines to produce an NBD-product. The general mechanism for this reaction is shown in Scheme 3. The proposed mechanism shows that the chlorine atom in position 7 of the aromatic ring is attacked by the amine group which acts as a nucleophile. This reaction could be performed in basic reaction media.12–15
NBD-Cl derivatives are the products of nucleophilic aromatic substitution which occurs when a nucleophile displaces a good leaving group.22 L-ORN has two amine groups, which act as nucleophiles while the NBD-Cl has a chlorine atom, which is a good leaving group. Therefore, under the optimum conditions, the nucleophilic substitution reaction takes place and the response is recorded as Y1.
Absorption spectra of both L-ORN, NBD-Cl, and their reaction product were measured against reagent blanks. L-ORN does not possess a chromophore moiety and therefore absorbs in the UV region, an issue that might cause an interference from the co-formulated excipients and adjuvants in case it is determined directly without derivatization.
As shown in Fig. 1, the formed yellow coloured product has a maximum absorbance at 469 nm (red shift). It has been noticed that for some samples when the pH value is high, two peaks were obtained. The first peak might be attributed to formation of the SN2 product at 469 nm. This peak and with the excess of OH− in the solution would decompose and another peak starts to form at 500 nm. The latter can be attributed to the hydrolysis of NBD-Cl at high pH and the formation of NBD-OH.23 The latter product might cause a high background necessitating the acidification of the reaction mixture.
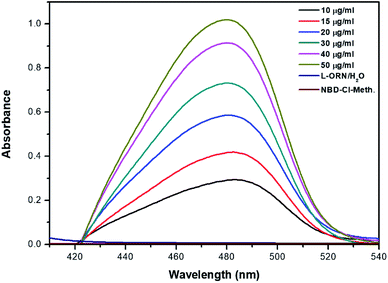 | ||
| Fig. 1 Absorption spectrum for the reaction of L-ORN with NBD-Cl under optimal conditions. The optimal conditions are Temp = 80 °C, pH = 7, RT = 35 min, and RV = 2 mL. | ||
Furthermore, this product was not stable. This could be attributed to the increase in the rate of the backward reaction as the [OH−] increases, which in turn could be due to a possible competition between OH− and the formed nucleophile, Fig. 2.
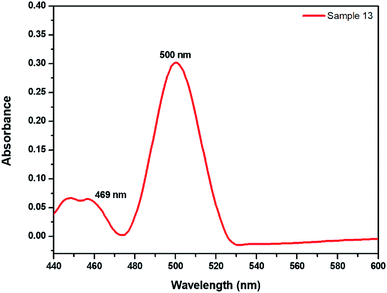 | ||
| Fig. 2 Absorption spectrum for sample 13 (Table 2) showing the formation of a second peak at 500 nm after the decomposition of the peak at 469 nm. | ||
3.2 Assessments of reaction conditions
| ln(Y1) = −7.26 − 0.1499pH + 0.0532Temp + 0.0421RT + 1.307volume of NBD-Cl + 0.051 DS − 2.801Ct Pt | (1) |
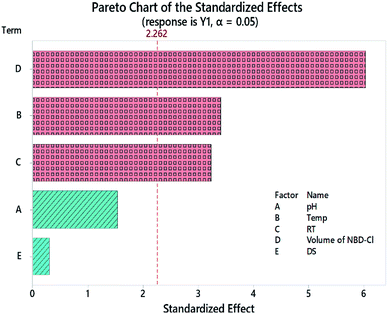
The value of R2 was high, signifying the linearity of data. The value of R2-predicted was close to that of R2, inferring that the model was not over-fitted, and high, implying the capability of the model to predict the absorbance values for new experiments. The Pareto chart, Fig. 3, illustrates which factors had an impact on the measured absorbance values. Three factors were found to be statistically significant; Temp, RT, and RV, and the latter was the most effective. All the results that were obtained from the Pareto chart were further confirmed using the analysis of variance (ANOVA), Table 3, where any factor that has a p value that exceeds 0.05 implies that the data do not fit the null hypothesis.17,18,24–28
| Source | DF | Adj SS | Adj MS | F-value | P-value |
|---|---|---|---|---|---|
| a DF is degrees of freedom; SS is sum of squares; and MS is mean of squares. | |||||
| Model | 6 | 51.3504 | 8.5584 | 18.80 | 0.000 |
| Linear | 5 | 27.8093 | 5.5619 | 12.22 | 0.001 |
| pH | 1 | 1.0780 | 1.0780 | 2.37 | 0.158 |
| Temp | 1 | 5.3026 | 5.3026 | 11.65 | 0.008 |
| RT | 1 | 4.7855 | 4.7855 | 10.51 | 0.010 |
| RV | 1 | 16.6014 | 16.6014 | 36.46 | 0.000 |
| DS | 1 | 0.0417 | 0.0417 | 0.09 | 0.769 |
| Curvature | 1 | 23.5411 | 23.5411 | 51.70 | 0.000 |
| Error | 9 | 4.0979 | 0.4553 | ||
| Lack-of-fit | 7 | 3.7043 | 0.5292 | 2.69 | 0.298 |
| Pure error | 2 | 0.3936 | 0.1968 | ||
| Total | 15 | 55.4483 | |||
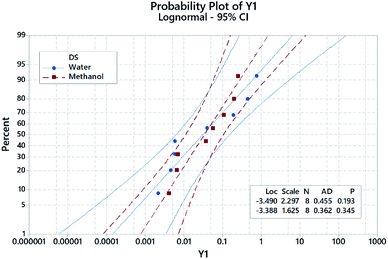
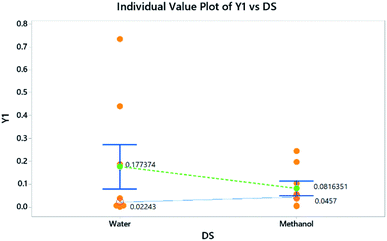
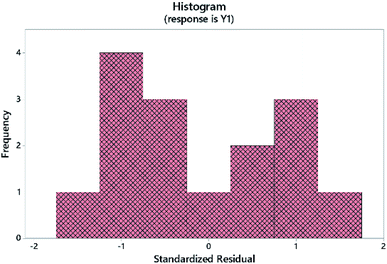
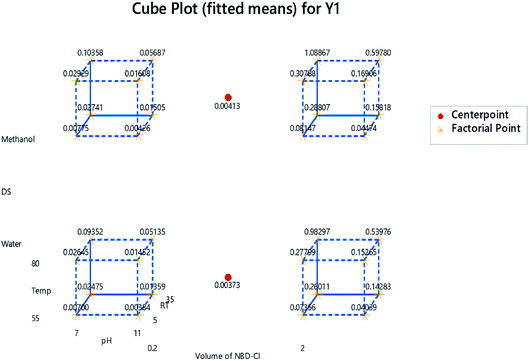
Similarly, histograms (residual plots) were used to check the normality of the data. The histogram in Fig. 6 shows a bimodal distribution (data with 2 peaks, without categorization). A 2-sample t-test was further used to evaluate the influence of different DS on the absorbance of the NBD-derivative. Results showed that there is no significant difference between both solvents where P-value > significance level (α). Descriptive statistics are shown in Table 4. This finding further confirms that the impact of DS as shown in Fig. 3 is not statistically significant. In the same itinerary, normal probability plots are used to attest whether the data are linear or normally distributed, Fig. 4. Two parameters were used to check the linearity of the data; p- and Anderson–Darling (AD) values. The obtained data shows that goodness-of-fit was achieved.29,30
| Response variable | Solvent type | N | Mean | SD | SE mean |
|---|---|---|---|---|---|
| a Null hypothesis: H0: μ1 − μ2 = 0. Alternative hypothesis: H1: μ1 − μ2 ≠ 0. T-value = 0.94, DF: 8; P-value = 0.374. | |||||
| Transformed response | Water | 8 | 0.177 | 0.272 | 0.096 |
| Methanol | 8 | 0.0816 | 0.0927 | 0.033 | |
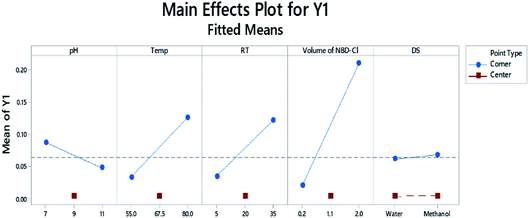
The main effects plot in Fig. 8 illustrates how the factors are affecting the response. Each effect is represented by a line, and the steeper the line, the greater the influence of this variable. As shown, almost all the factors' lines are not horizontal. The pH has a negative effect on the response, compared to the positive impact exerted by RT, Temp and RV.
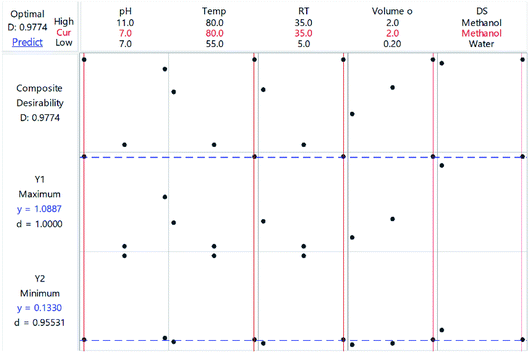
The optimization plot is shown in Fig. 10 and illustrates the optimum conditions. The purpose was to maximize the absorbance measured at 469 nm (Y1) and minimize the absorbance of the NBD-OH adduct at 500 nm (Y2). Fig. 9 shows the d-value (individual desirability function) for Y1 and Y2 and D-value (composite desirability function). The vertical red lines represent the optimal conditions for each factor. The blue dashed line represents the responses. The optimum conditions that were determined from the combination of the two responses are pH = 7, Temp = 80 °C, RT = 35 min, NBD-Cl volume = 2 mL and methanol is DS.
3.3 Stoichiometry
The results of Job's technique of continuous variation shows that the highest absorbance was achieved at a mole fraction of 0.35 (D)![[thin space (1/6-em)]](https://www.rsc.org/images/entities/char_2009.gif) :
:![[thin space (1/6-em)]](https://www.rsc.org/images/entities/char_2009.gif) 0.65 (NBD-Cl), implying a molar ratio of 1 (D)
0.65 (NBD-Cl), implying a molar ratio of 1 (D)![[thin space (1/6-em)]](https://www.rsc.org/images/entities/char_2009.gif) :
:![[thin space (1/6-em)]](https://www.rsc.org/images/entities/char_2009.gif) 2 (NBD-Cl). Therefore, it can be concluded that the two amine moieties might have been involved in the reaction.
2 (NBD-Cl). Therefore, it can be concluded that the two amine moieties might have been involved in the reaction.
3.4 Validation
The analytical parameters are listed in Table 5. According to the ICH guidelines, the proposed method was evaluated considering the following items and as will be revealed in the following subsections.32| Parameter | Value | Parameter | Value |
|---|---|---|---|
| a Regression equation: Y = bX + a, where Y is the absorbance, X is concentration in M, a is the intercept, b is the slope, Sb = SD of slope, ±tSb = confidence limit for slope, Sa = SD of intercept ± tSa = confidence limit for intercept Sy/x = SD of the regression, SS is sum of squares.b LOD = limit of detection, LOQ = limit of quantification, and r2 = coefficient of determination. | |||
| Wavelength, λmax (nm) | 469 | Slope (b) | 0.0180 |
| Linear range, (μg mL−1)a | 5.00–50.00 | Intercept (a) | 0.1036 |
| Sb | 2.41 × 10⁻⁴ | r2 | 0.9991 |
| ±tSb | 1.67 × 10⁻⁴ | LOD (μg mL−1)b | 1.77 |
| Sa | 6.90 × 10⁻³ | LOQ (μg mL−1)b | 5.38 |
| ±tSa | 4.78 × 10⁻³ | Residual SS | 4.70 × 10⁻⁴ |
| Sy/x | 9.69 × 10⁻³ | Regression SS | 0.5257 |
| Ypure drug = 0.0180X + 0.1036R2 = 0.9991 |
| Taken (μg mL−1) | Found (μg mL−1) | % recoverya |
|---|---|---|
| a Mean ± SD of 3 determinations. (a) The intra-day (n = 3) average of three concentrations of L-Ornithine repeated three times within the same day. (b) The inter-day (n = 3) average of three concentrations of L-ORN repeated three times in three different days. | ||
| Determination of L-ORN in bulk powder | ||
| 5.00 | 4.97 | 99.33 |
| 10.00 | 9.97 | 99.67 |
| 15.00 | 14.66 | 97.76 |
| 20.00 | 20.18 | 100.9 |
| 30.00 | 30.08 | 100.3 |
| 40.00 | 40.91 | 100.3 |
| 50.00 | 49.32 | 98.63 |
| Meana ± SD | 99.84 ± 1.49 | |
| RSD | 1.494 | |
![[thin space (1/6-em)]](https://www.rsc.org/images/entities/char_2009.gif) |
||
| Determination of L-ORN in formulations (Now Foods® capsules): direct calibration method | ||
| 10.00 | 9.97 | 99.67 |
| 15.00 | 14.68 | 97.87 |
| 20.00 | 20.08 | 100.4 |
| 30.00 | 30.61 | 102.0 |
| 40.00 | 40.63 | 101.6 |
| 50.00 | 49.55 | 99.10 |
| Meana ± SD | 100.10 ± 1.55 | |
| RSD | 1.55 | |
| Concentration (μg mL−1) | Mean% recoverya ± SD | Error (%) |
|---|---|---|
| Inter and intra-day precision for determination of L-ORN in bulk powder | ||
| (a) Inter-day | ||
| 20.00 | 99.38 ± 1.21 | 0.62 |
| 30.00 | 98.00 ± 0.70 | 0.64 |
| 50.00 | 100.3 ± 1.1 | 0.87 |
| (b) Intra-day | ||
| 20.00 | 99.70 ± 0.75 | 0.30 |
| 30.00 | 99.53 ± 1.04 | 0.47 |
| 50.00 | 99.04 ± 1.06 | 0.96 |
![[thin space (1/6-em)]](https://www.rsc.org/images/entities/char_2009.gif) |
||
| Inter and intra-day precision for determination of Now Foods® capsules | ||
| (a) Inter-day | ||
| 10.00 | 100.2 ± 0.6 | −0.23 |
| 40.00 | 98.28 ± 1.62 | 1.72 |
| 50.00 | 99.53 ± 1.50 | 0.47 |
| (b) Intra-day | ||
| 10.00 | 100.33 ± 0.76 | −0.33 |
| 40.00 | 98.97 ± 1.00 | 0.45 |
| 50.00 | 99.55 ± 1.09 | 1.03 |
| Parameter | Proposed method | Reported method11 | Now Foods® capsules |
|---|---|---|---|
| a Average of 3 determinations; a and b are the tabulated t-values and F-ratios at p = 0.05. | |||
| Meana | 99.84 | 98.69 | 100.9 |
| ±SD | 1.491 | 1.56 | 1.10 |
| RSD | 1.494 | 1.58 | 1.09 |
| V | 2.22 | 2.13 | 1.21 |
| n | 7 | 3 | 6 |
| ±SE | 0.564 | 0.400 | 0.450 |
| t-value | 1.083 (2.262)a | ||
| F | 1.04 (19.3)b | ||
where s is the slope of the calibration curve and SD the standard deviation of the blank (5 measurements). Values of LOD and LOQ are shown in Table 5. This method is showing high sensitivity for the determination of L-ORN.
4. Conclusions
L-ORN was analyzed in its pure form and in its dietary supplements using a spectrochemical approach. A nucleophilic substitution reaction was pathway taken to derivatize L-ORN using NBD-Cl. A single response (absorbance at 469 nm) was measured as a function of five variables using a multivariate-assisted strategy. PBD was used as an experimental design for the screening phase. Pareto charts and ANOVA techniques were used to determine the factors that have an impact on the response. Factorial levels were adjusted to give the maximum response. The molar ratio was determined to be (2![[thin space (1/6-em)]](https://www.rsc.org/images/entities/char_2009.gif) :
:![[thin space (1/6-em)]](https://www.rsc.org/images/entities/char_2009.gif) 1) (reagent
1) (reagent![[thin space (1/6-em)]](https://www.rsc.org/images/entities/char_2009.gif) :
:![[thin space (1/6-em)]](https://www.rsc.org/images/entities/char_2009.gif) drug) using Job's technique. Finally, and using ICH guidelines, the proposed method was validated.
drug) using Job's technique. Finally, and using ICH guidelines, the proposed method was validated.
Conflicts of interest
There are no conflicts to declare.Acknowledgements
This work was made possible by student grant [QUST-1-CAS-2019-13] from Qatar University. The statements made herein are solely the responsibility of the authors. The authors would like to thank Dr Mohanad Shkoor, Department of Chemistry and Earth Sciences, College of Arts and Sciences, Qatar University for his helpful advice on establishing the reaction mechanism.References
- OJL, Directive 2002/46/Ec, The European Parliament and of The Council, 2002, vol. 183, pp. 51–57 Search PubMed.
- Y. Motarjemi and H. Lelieveld, in A Practical Guide for the Food Industry, ed. Y. Motarjemi and H. Lelieveld, Academic Press, San Diego, 1st edn, 2014, ch. 47, pp. 1127–1130 Search PubMed.
- M. Sivashanmugam, J. Jaidev, V. Umashankar and K. N. Sulochana, Biomed. Pharmacother., 2017, 86, 185–194 CrossRef CAS.
- B. Zhang, L. Ren, M. Yu, Y. Zhou and B. Ye, Bioresour. Technol., 2018, 250, 60–68 CrossRef CAS.
- R. C. Benson, K. A. Hardy and C. R. Morris, J. Allergy, 2011, 2011, 1–12 CrossRef.
- M. Williams, J. Int. Soc. Sports Nutr., 2005, 2, 63–67 CrossRef.
- J. A. Chromiak and J. Antonio, Nutrition, 2002, 18, 657–661 CrossRef CAS.
- Y. Fujimura and M. Kawamura, Clin. Chim. Acta, 1996, 253, 1–8 CrossRef CAS.
- L. H. de Jonge and M. Breuer, J. Chromatogr. B: Biomed. Sci. Appl., 1996, 677, 61–68 CrossRef.
- P. Kowalski, M. Bieniecki, I. Olȩdzka and H. Lamparczyk, Biomed. Chromatogr., 2006, 20(2), 185–194 CrossRef CAS.
- M. S. Elazazy, M. El-Hamshary, M. Sakr and H. S. Al-Easa, Spectrochim. Acta, Part A, 2018, 193, 397–406 CrossRef CAS.
- A. F. Akinyele, J. I. Okogun and O. P. Faboya, J. Agric. Food Chem., 1999, 47, 2303–2307 CrossRef CAS.
- M. A. Omar, M. A. Hammad and M. Awad, RSC Adv., 2017, 7, 44773–44779 RSC.
- A. A. Elbashir, F. E. O. Suliman and H. Y. Aboul-Enein, J. Fac. Pharm. Gazi Univ., 2011, 24, 679–697 Search PubMed.
- F. Orata, in Advanced Gas Chromatography – Progress in Agricultural, Biomedical and Industrial Applications, ed. M. A. Mohd, InTech, 2012, ch. 5, pp. 83–108 Search PubMed.
- R. Leardi, Anal. Chim. Acta, 2009, 652, 161–172 CrossRef CAS.
- R. L. Plackett and J. P. Burman, Biometrika, 1946, 33, 305–325 CrossRef.
- M. S. Elazazy, in Spectroscopic Analyses - Developments and Applications, ed. E. Sharmin and F. Zafar, IntechOpen, 69891, 2017, ch. 11, pp. 213–230 Search PubMed.
- P. W. Araujo and R. G. Brereton, Trends Anal. Chem., 1996, 15, 26–31 CAS.
- T. Kaneta, in Capillary Electrophoresis of Proteins and Peptides: Methods and Protocols, ed. N. T. Tran and M. Taverna, Springer New York, New York, NY, 2016, ch. 2, pp. 11–23 Search PubMed.
- P. Job, Ann. Chim., 1928, 9, 113–203 CAS.
- K. Gbayo, C. Isanbor, K. Lobb and O. Oloba-Whenu, Phys. Sci. Rev., 2017, 2, 1–6 CrossRef.
- A. Önal, Quim. Nova, 2010, 34, 677–682 CrossRef.
- G. E. P. Box and D. A. Cox, J. R. Stat. Soc. Series B Stat. Methodol., 1964, 26, 211–252 Search PubMed.
- M. Bicego and S. Baldo, Neurocomputing, 2016, 218, 390–400 CrossRef.
- A. H. Bademlioglu, A. S. Canbolat, N. Yamankaradeniz and O. Kaynakli, Appl. Therm. Eng., 2018, 145, 221–228 CrossRef CAS.
- M. S. Elazazy, K. Ganesh, V. Sivakumar and Y. H. A. Huessein, RSC Adv., 2016, 6, 64967–64976 RSC.
- M. S. Elazazy, RSC Adv., 2015, 5, 48474–48483 RSC.
- T. W. Anderson and D. A. Darling, J. Am. Stat. Assoc., 1954, 49, 765–769 CrossRef.
- G. Marsaglia and J. C. W. Marsaglia, J. Stat. Softw., 2004, 9, 1–5 Search PubMed.
- M. J. Anderson and P. J. Whitcomb, DOE Simplified: Practical Tools for Effective Experimentation, CRC Press, 3rd edn, 2015 Search PubMed.
- International Conference on Harmonization, ICH Harmonized Tripartite Guideline – Validation of Analytical Procedures: text and methodology, Q2 (R1) Version 4, Fed. Register, 2005 Search PubMed.
| This journal is © The Royal Society of Chemistry 2019 |


