 Open Access Article
Improvement of PEDOT:PSS linearity via controlled addition process
Hongjoo Lee,
Youngno Kim,
Hangyeol Cho,
Jin-geun Lee and
Jung Hyun Kim *
*
Department of Chemical and Biomolecular Engineering, Yonsei University, 50 Yonsei-ro, Seodaemoon-Gu, Seoul, 03722, South Korea. E-mail: Jayhkim@yonsei.ac.kr; Fax: +82 2 312 0305; Tel: +82 2 2123 4693
First published on 3rd June 2019
Abstract
Poly(3,4-ethylene dioxythiophene):poly(styrene sulfonate) (PEDOT:PSS), which is a conductive polymer, has gained immense attention as a next-generation transparent electrode. However, in order to realize its practical application, it is imperative that its optical and electrical properties should be improved. Generally, acid dopants are added to improve optical and electrical properties. In this study, however, we replaced the batch process used for manufacturing PEDOT:PSS with a controlled addition process to improve its optical and electrical properties efficiently without additional additives and processes. In this process, the rate of polymerization and the structure of the product could be regulated by controlling the amount of monomer and catalyst. Moreover, we investigated the efficiency of the controlled addition process both theoretically and experimentally. The proposed approach was used to increase the linearity of PEDOT and the proportion of PEDOT attached to the PSS chain to improve transmittance by 6.2% (73 to 79.2% at 100 ohm) and conductivity by 39.68% (446 to 623 S cm−1). It was determined that the properties of PEDOT:PSS could be improved using the proposed method during the polymerization process.
Introduction
Recently, transparent electrodes have gained immense attention. In this regard, there has been significant effort directed towards the development of novel transparent and flexible transparent electrodes1 and the improvement of their properties.2Examples of transparent electrodes include indium tin oxide (ITO), tin dioxide (SnO2), zinc oxide (ZnO), etc. Among these, ITO is a widely used transparent electrode material that is commercially available. ITO exhibits good electrical conductivity and light transmittance.3 However, it suffers from low flexibility and is costly.4,5 Therefore, in order to address these limitations, conductive polymers are used as transparent electrode materials. Owing to their flexibility,6 processability, and cost-effectiveness, conductive polymers are being exclusively investigated as next-generation organic transparent electrode materials.
There is a wide variety of conductive polymers such as polyacetylene,7 polypyrrole,8 polythiophene, and poly(3,4-ethylene dioxythiophene):poly(styrene sulfonate) (PEDOT:PSS).9 Among these, PEDOT:PSS exhibits the best electrical and optical properties10–14 and is utilized in organic electronic devices such as organic light emitting diodes (OLEDs)15 and organic photovoltaics (OPVs).16 Therefore, it is considered as a potential organic electronic material.
PEDOT:PSS exhibits a complex structure, in which electrically conducting PEDOT17,18 and electrically insulating PSS are combined via coulombic interactions.19 PEDOT shows hydrophobicity and poor stability. In contrast, PSS improves the performance and stability of PEDOT:PSS by acting as a dopant and dispersing agent.20,21 Since PEDOT is electrically conducting, the amount of PEDOT attached to the PSS chain affect the electrical conductivity of PEDOT:PSS.
In general, studies have been introduced to add acid dopants to enhance the optical and electrical properties of PEDOT:PSS. However, the use of additional acid dopants can result in additional costs and therefore inefficiency in price.
We focused on improving the electrical and optical characteristics of PEDOT:PSS by replacing the batch and vapor phase polymerization processes22,23 with a modified process, called controlled addition process (CAP). Approach for improving the electrical conductivity and transmittance of PEDOT:PSS based on process modification only, without using additional additives. Therefore, this is efficient in terms of process and price.24
We designed our experiments based on mathematical theory. The experiment parameters reflect the settings determined by mathematical theory. We compared the structure of PEDOT:PSS films polymerized via the batch and CAP. The electrical and optical properties of the PEDOT:PSS films were also compared. The mathematical theory and experimental results showed that PEDOT:PSS polymerized via CAP can be used efficiently in terms of process and cost for the polymerization of PEDOT:PSS available for organic transparent electronic devices.25,26
Experimental
Materials
PSS, EDOT (97%), sodium persulfate (Na2S2O8; 98%), iron(III) sulfate hydrate (Fe2(SO4)3; 97%), and dimethyl sulfoxide (DMSO; 98%) were purchased from Sigma-Aldrich. The ion exchange resins (anion and cation) were purchased from Samyang Co.Synthesis and analysis of PEDOT:PSS via the controlled addition process
We performed the synthesis with EDOT, Fe2(SO4)3, and Na2S2O8 using the Baytron P procedure. The PEDOT:PSS ratio was 1![[thin space (1/6-em)]](https://www.rsc.org/images/entities/char_2009.gif) :
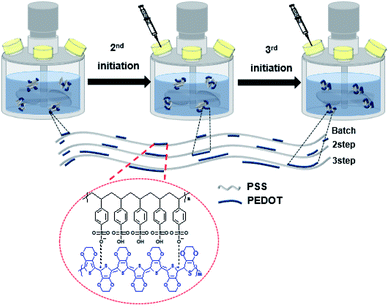
:![[thin space (1/6-em)]](https://www.rsc.org/images/entities/char_2009.gif) 2.5 (according to Clevios PH1000). The reaction temperature was maintained at 10 °C. A total reaction time of 18 h is required for batch processing which was divided into two and three intervals (Scheme 1), and the reaction was performed in an argon atmosphere. After the reaction was completed, the ion exchange resin was added to remove impurity ions and the reaction temperature was increased to 20 °C. The PEDOT:PSS solution for analysis was prepared by adding 5 wt% of DMSO and 0.1 wt% of the surfactant. After removing the excess particles using a 5 μm syringe filter, spin coating was performed for 30 s and the resulting film was annealed at 150 °C for 2 min.
2.5 (according to Clevios PH1000). The reaction temperature was maintained at 10 °C. A total reaction time of 18 h is required for batch processing which was divided into two and three intervals (Scheme 1), and the reaction was performed in an argon atmosphere. After the reaction was completed, the ion exchange resin was added to remove impurity ions and the reaction temperature was increased to 20 °C. The PEDOT:PSS solution for analysis was prepared by adding 5 wt% of DMSO and 0.1 wt% of the surfactant. After removing the excess particles using a 5 μm syringe filter, spin coating was performed for 30 s and the resulting film was annealed at 150 °C for 2 min.
Characterization
The synthesis time was calculated based on the complete conversion time of PEDOT:PSS as measured using UV-Vis-NIR spectrophotometry (JASCO Corporation, V-650). The PEDOT:PSS structure was examined using X-ray photoelectron spectroscopy (XPS; Thermo U.K., K-alpha) using monochromated Al Kα X-ray radiation, Raman spectroscopy (Horiba Jobin Yvon, LabRam Aramis) using a 633 nm He–Ne laser as the excitation source and high-resolution X-ray diffraction (HR-XRD; Rigaku, SmartLab). To evaluate the electrical properties of PEDOT:PSS, its surface resistance was measured using the four-point probe method (Napson, RT-70/RG-5) and a film thickness surface profiler (Bruker, Dektak XT Stylus profiler). The transmittance of the PEDOT:PSS film was measured using a colorimeter (Nippon Denshoku, COH 400).Results and discussion
Process design for polymerization rate control
In this study, we modified the conventional (batch reactor) PEDOT:PSS polymerization by controlling the reaction rate using a controlled addition process. Factors considered to design the process are temperature and the amount of catalyst and monomer.In PEDOT:PSS, the degree of PEDOT:PSS concentration change over time can be determined using the absorbance peak at 550 nm and Beer–Lambert equation27(eqn (1)):
| A = εbc | (1) |
Using these settings and equations, the actual reaction rate equation can be obtained by rearranging the actual experimental values listed in Table 1.
| Time | 0 h | 2 h | 4 h | 6 h | 8 h | 10 h | 12 h | 15 h | 18 h |
|---|---|---|---|---|---|---|---|---|---|
| Absorbance | 0 | 0.1023 | 0.2105 | 0.3230 | 0.4473 | 0.5339 | 0.6098 | 0.7261 | 0.7482 |
| Relative EDOT concentrate (M) | 1 | 0.8632 | 0.7186 | 0.5682 | 0.4021 | 0.2864 | 0.1850 | 0.0295 | 0 |
| Experimental monomer (EDOT) concentrate ((Ca) (mol L−1)) | 0.0405 | 0.0349 | 0.0291 | 0.0230 | 0.0162 | 0.0116 | 0.0074 | 0.0011 | 0 |
| −dCa/dt | 0.0027 | 0.0029 | 0.0030 | 0.0040 | 0.0027 | 0.0024 | 0.0020 | 0.0010 | 0 |
The following equation was obtained by combining the rate and mole balance equations:
 | (2) |
By taking the natural logarithm of both sides of eqn (2), the following equation was obtained:
 | (3) |
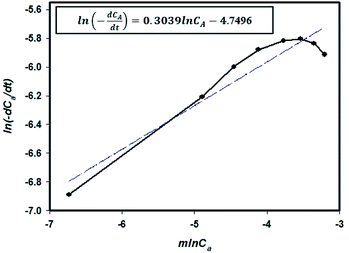
The reaction rate graph obtained using eqn (3) and the experimental values are given in Table 1 are shown in Fig. 1. The slope of the graph denotes the order of the reaction (m) and the y-intercept represents ln![[thin space (1/6-em)]](https://www.rsc.org/images/entities/char_2009.gif) k. The value of k could therefore be determined.
k. The value of k could therefore be determined.
The reaction rate could be expressed as follows:
| rA = (8.6 × 10⁻³)CA0.3039 | (4) |
This reaction is a 0.3039-order reaction and is affected by the EDOT concentration. This means that the initial reaction rate decreased when polymerization was performed by reducing the concentration to 1/2 or 1/3 due to the controlled addition process.
The activation energy of the EDOT polymerization reaction does not decrease with an increase in the catalyst concentration.32 However, an increase in the catalyst concentration results in an increase in the rate constant because the catalyst and reactant interact with each other in the solution to increase the probability of polymerization.33 Therefore, in a conventional batch-type polymerization, the catalyst concentration is proportional to the polymerization rate.
The experiment was performed under low-temperature isothermal conditions because the reaction rate constant k, which affects the polymerization reaction rate,34 is also affected by temperature. The following Arrhenius equation can be used:33,35
| KA(T) = Ae−Ea/RT | (5) |
From eqn (5), it is evident that as the temperature is reduced, the reaction slows down. Therefore, in this study, the reaction was performed at 10 °C (melting point of EDOT), which is the lowest temperature possible for the liquid phase polymerization of EDOT.
These conditions make it possible to control the initial polymerization rate. If the amounts of the monomers and the catalyst used in the initiation are divided two or three times, the initial reaction rate becomes low. Therefore, it is possible to make a linear polymer at the initial stage of polymerization and increase the degree of polymerization of PEDOT through secondary and tertiary initiation (Scheme 2).
Applying process based on conversion time
In this process, the monomer and catalyst amounts were divided (by 1/n of the total amount required during batch processing where n is the number of divides) into small portions and were added in two and three steps (Scheme 1).Using rA obtained from eqn (4), we obtain:
 | (6) |
 | (7) |
From this equation, it is evident that the EDOT concentration and conversion rate are correlated. As a result, the conversion completion time decreases as the initial EDOT concentration decreases, indicating that EDOT and the catalyst can be divided into time points.
In order to divide the reactants, we had to consider the input interval. Therefore, it was necessary to measure the time required for the complete conversion of EDOT in the batch process.36 Since PEDOT:PSS is dark blue in color and absorbs light in the visible region (550 nm), its absorbance in terms of the synthesis time was confirmed by UV-Vis-NIR spectroscopy. It was determined that saturation occurred after 18 h, confirming the completion of the conversion (Fig. 2(a and c)). These results are represented as relative values based on the Beer–Lambert theory (Fig. 2(b) and eqn (1)). Based on this time, the monomer and catalyst were divided by 2 (two steps) and 3 (three steps) of their total amounts after every 8 h 30 min and 5 h 30 min, respectively. Monomer and catalyst were added 30 min before the end of the ongoing reaction so that the monomers could be added to the PEDOT chain.
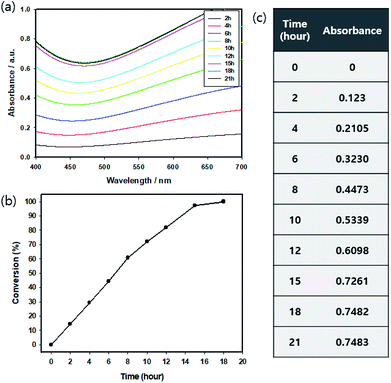 | ||
| Fig. 2 (a) Absorption analysis of PEDOT:PSS for polymerization time, (b) relative conversion and (c) absolute absorbance (at 550 nm). | ||
Structure of PEDOT:PSS polymerized by CAP
We used Raman spectroscopy to verify the increased linearity of PEDOT in the controlled addition process (Fig. 3). The controlled addition-polymerized PEDOT:PSS film exhibited vibration modes corresponding to asymmetric Cα![[double bond, length as m-dash]](https://www.rsc.org/images/entities/char_e001.gif) Cβ (1530 cm−1), symmetric Cα
Cβ (1530 cm−1), symmetric Cα![[double bond, length as m-dash]](https://www.rsc.org/images/entities/char_e001.gif) Cβ (1440 cm−1), symmetric Cβ–Cβ (1370 cm−1), and Cα–Cα stretching vibration of the pentagonal rings of PEDOT (1270 cm−1). The shift of the peak at 1441 to 1430 cm−1 suggests that the PEDOT chain experienced a benzoid (coil)-to-quinoid (linear or expanded-coil) structural transition.37–40 It can be confirmed that the initial polymerization rate is slowed and the PEDOT can be slowly polymerized linearly.
Cβ (1440 cm−1), symmetric Cβ–Cβ (1370 cm−1), and Cα–Cα stretching vibration of the pentagonal rings of PEDOT (1270 cm−1). The shift of the peak at 1441 to 1430 cm−1 suggests that the PEDOT chain experienced a benzoid (coil)-to-quinoid (linear or expanded-coil) structural transition.37–40 It can be confirmed that the initial polymerization rate is slowed and the PEDOT can be slowly polymerized linearly.
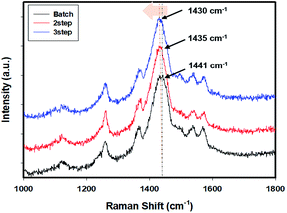 | ||
| Fig. 3 Raman spectra of the PEDOT:PSS films prepared by the batch and controlled addition processes (under the excitation of a 632.8 nm He–Ne laser). | ||
XPS was used to analyze the chemical composition of the PEDOT:PSS films (Fig. 4). The films exhibited two peaks corresponding to PEDOT and PSS. PEDOT and PSS showed different chemical bonds with sulfur. The peak at 163.5–165.5 eV corresponds to the sulfur atoms of PEDOT, while the peak at 168–169 eV can be attributed to the sulfur atoms of PSS.39,41,42 We compared the PEDOT content in the PEDOT:PSS chain with graphs normalized to the peaks for the sulfur atoms of PSS. As a result, according to increasing the intensity of the peak for the sulfur atoms of PEDOT, the number of PEDOT chains increased with an increase in the number of divisions in the PEDOT:PSS obtained through the controlled addition process for the same amount of PSS.
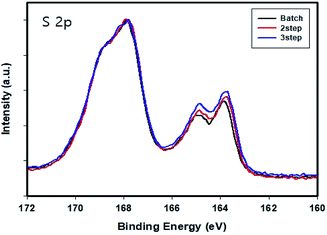 | ||
| Fig. 4 S (2p) XPS spectra of the PEDOT:PSS films normalized to the peaks of the sulfur atoms present in PSS. | ||
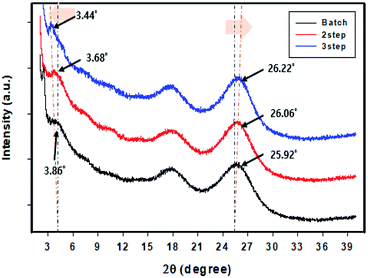
The structure of the controlled addition-polymerized PEDOT:PSS film was analyzed based on its degree of crystallization, as determined from XRD measurements (Fig. 5). The PEDOT:PSS film exhibited four peaks at 2θ = 3.8° (23 Å), 6.6° (13.4 Å), 17.7° (5 Å), and 25.6° (3.5 Å).43,44 The peaks at 2θ = 3.8° and 6.6° correspond to the lamella stacking distance d (100) from PEDOT to PSS. The peaks at 2θ = 17.7° and 25.6° correspond to the amorphous halo of PSS and π–π stacking (d010) of the PEDOT thiophene ring, respectively.41,45 The linearity and packing property of the polymer improved with an increase in the number of divisions. In the case of the peak at 2θ = 3.8°, the distance between the structures increased with an increase in the number of divisions. In addition, the sharpness of the peaks increased gradually, indicating the formation of an expanded structure or a linear conformation. The crystallinity of the PEDOT:PSS film also increased. The peak at 2θ = 25.6° indicates that the packing of the polymer formed by the controlled addition process was better than that of the polymer formed by the batch process. The diffraction angle increased with an increase in the number of divisions. An increase in the peak intensity suggests an increase in the crystallinity of the film.
Electrical and optical properties of PEDOT:PSS
The linear structure of PEDOT:PSS could be controlled by changing its polymerization process from batch to controlled addition. This also improved its electrical conductivity and sheet resistance. Polymerized PEDOT:PSS solution exhibits an electrical conductivity of less than 1 S cm−1 unless the phase separation is performed using organic solvents such as DMSO, DMF, etc. For this reason, DMSO, which is the most effective organic solvent for phase separation was used in this study.46,47 The surface resistance and electrical conductivity of PEDOT:PSS were also measured by adding a surfactant so that PEDOT:PSS could adhere to the substrate. The electrical conductivity of the film was determined by measuring its thickness and sheet resistance (Fig. 6(a)).48,49 As a result, this parameter increased to 557 and 623 S cm−1 for the PEDOT:PSS film when the polymerization was performed using the controlled addition process compared to the electric conductivity of 446 S cm−1 that was obtained using batch processing (Fig. 6(b)). This is because an increase in PEDOT length attached to the PSS chain (during its division) allows for a sufficient polymerization time. As a result, the film polymerized by the controlled addition process exhibited a larger conductive portion (PEDOT) than the film polymerized by the batch process.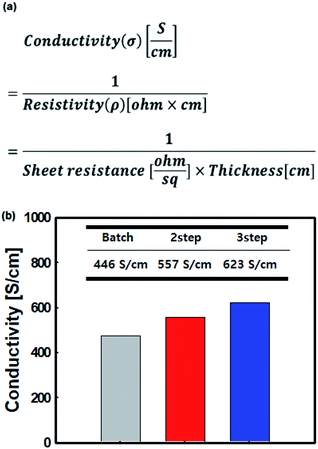 | ||
| Fig. 6 (a) The electrical conductivity equation and (b) electrical conductivity of the PEDOT:PSS films prepared by the batch and controlled addition processes with 5% DMSO solution. | ||
After setting the surface resistivity of the films prepared in this study to 50–160 Ω sq−1, we compared their sheet resistances as a function of transmittance using a colorimeter. We also compared their transmittance vs. surface resistance curves obtained at 50, 100, and 150 ohms. The transmittance increased in the order: batch processed film < two-step-controlled addition film < three-step-controlled addition film (Fig. 7). This suggests that the linear structure of PEDOT:PSS, resulting in an increase in light transmission. The linear PEDOT:PSS structure lowers the intrinsic resistance to particles, and the longer PEDOT chains also lower the resistance, requiring less PEDOT:PSS particle for the same sheet resistance.15 As a result, the required PEDOT:PSS particle count is reduced in the same sheet resistance, resulting in increased transmittance.
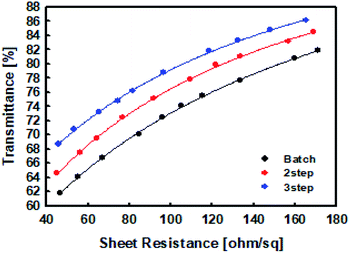 | ||
| Fig. 7 The transmittance of the PEDOT:PSS films prepared by the batch and controlled addition processes. | ||
Conclusions
In this study, we have improved the degree of linear PEDOT polymerization through modification of the polymerization process. We designed an experimental approach for the polymerization of PEDOT:PSS based on mathematical theory. The batch polymerization process used for the preparation of PEDOT:PSS was replaced with a controlled addition process, in which the initial polymerization rate was controlled by amount of monomer and catalyst. The total conversion time of the batch was 18 h. The PEDOT:PSS was polymerized by dividing the monomer and catalyst two and three times after an interval of 8 h 30 min and 5 h 30 min, respectively. Linear PEDOT was polymerized regularly by slowing the initial polymerization rate. The structure of the polymerized PEDOT:PSS was analyzed by Raman, XRD, XPS. Raman spectroscopy and XRD were used to confirm the increase in the linearity of the PEDOT polymerized using the controlled addition process. XPS used to confirm that the degree of polymerization of the PEDOT attached to PSS chain is improved. The increase in the amount of linearly polymerized PEDOT increased the electrical conductivity of the film by 39.68% (446 to 623 S cm−1) and optical property of the film by 6.2% (73 to 79.2% at 100 ohm). This process led to an increase in the PEDOT chain length and linearity to further improve electrical conductivity and transmittance at the same sheet resistance. We analyzed the improvement of the electrical and optical properties of PEDOT:PSS polymerized by the controlled addition process based on mathematical theory and experiments. These results will be useful as a process for polymerizing PEDOT:PSS with improved electrical and optical properties at an efficient process and price.Conflicts of interest
There are no conflicts to declare.Acknowledgements
This work was supported by the Nano Material Technology Development Program through the National Research Foundation of Korea (NRF) funded by the Ministry of Science, ICT & Future Planning (MSIP, Korea) (NRF-2014M3A7B4050960/2014M3A7B4051745). This work was supported by the Technology Innovation Program (20002931) funded by the Ministry of Trade, Industry & Energy (MOTIE, Korea).Notes and references
- D. Yoo, J. Kim and J. H. Kim, Nano Res., 2014, 7, 717–730 CrossRef CAS.
- S. Chen, L. Song, Z. Tao, X. Shao, Y. Huang, Q. Cui and X. Guo, Org. Electron., 2014, 15, 3654–3659 CrossRef CAS.
- J. Hwang, F. Amy and A. Kahn, Org. Electron., 2006, 7, 387–396 CrossRef CAS.
- E. Ahlswede, W. Mühleisen, M. W. bin Moh Wahi, J. Hanisch and M. Powalla, Appl. Phys. Lett., 2008, 92, 143307 CrossRef.
- D. Alemu Mengistie, P.-C. Wang and C.-W. Chu, J. Mater. Chem. A, 2013, 1, 9907 RSC.
- V. Kostianovskii, B. Sanyoto and Y.-Y. Noh, Org. Electron., 2017, 44, 99–105 CrossRef CAS.
- C. K. Chiang, C. R. Fincher, Y. W. Park, A. J. Heeger, H. Shirakawa, E. J. Louis, S. C. Gau and A. G. MacDiarmid, Phys. Rev. Lett., 1977, 39, 1098–1101 CrossRef CAS.
- J. Wang, K. Cai, S. Shen and J. Yin, Synth. Met., 2014, 195, 132–136 CrossRef CAS.
- H. Ju and J. Kim, Chem. Eng. J., 2016, 297, 66–73 CrossRef CAS.
- R. Yue and J. Xu, Synth. Met., 2012, 162, 912–917 CrossRef CAS.
- T. Cheng, Y.-Z. Zhang, J.-P. Yi, L. Yang, J.-D. Zhang, W.-Y. Lai and W. Huang, J. Mater. Chem. A, 2016, 4, 13754–13763 RSC.
- S. B. Singh, T. Kshetri, T. I. Singh, N. H. Kim and J. H. Lee, Chem. Eng. J., 2019, 359, 197–207 CrossRef CAS.
- Y.-H. Liu, J.-L. Xu, S. Shen, X.-L. Cai, L.-S. Chen and S.-D. Wang, J. Mater. Chem. A, 2017, 5, 9032–9041 RSC.
- Z. Li, G. Ma, R. Ge, F. Qin, X. Dong, W. Meng, T. Liu, J. Tong, F. Jiang, Y. Zhou, K. Li, X. Min, K. Huo and Y. Zhou, Angew. Chem., Int. Ed., 2016, 55, 979–982 CrossRef CAS PubMed.
- H. Cho, W. Cho, Y. Kim, J.-g. Lee and J. H. Kim, RSC Adv., 2018, 8, 29044–29050 RSC.
- B. Shamieh, S. Obuchovsky and G. L. Frey, J. Mater. Chem. C, 2016, 4, 1821–1828 RSC.
- F. Wang, X. Zhang, Y. Ma and W. Yang, Appl. Surf. Sci., 2018, 427, 1038–1045 CrossRef CAS.
- M.-Y. Shen, T.-Y. Huang, C.-H. Luo, Y.-C. Huang, Y.-H. Tsai, T.-L. Wang and H.-h. Yu, J. Chin. Chem. Soc., 2018, 65, 149–155 CrossRef CAS.
- S. Timpanaro, M. Kemerink, F. J. Touwslager, M. M. De Kok and S. Schrader, Chem. Phys. Lett., 2004, 394, 339–343 CrossRef CAS.
- A. M. Nardes, M. Kemerink, M. M. de Kok, E. Vinken, K. Maturova and R. A. J. Janssen, Org. Electron., 2008, 9, 727–734 CrossRef CAS.
- K.-C. Chang, M.-S. Jeng, C.-C. Yang, Y.-W. Chou, S.-K. Wu, M. A. Thomas and Y.-C. Peng, J. Electron. Mater., 2009, 38, 1182–1188 CrossRef CAS.
- F. Louwet, L. Groenendaal, J. Dhaen, J. Manca, J. Van Luppen, E. Verdonck and L. Leenders, Synth. Met., 2003, 135–136, 115–117 CrossRef CAS.
- J. Ouyang, Displays, 2013, 34, 423–436 CrossRef CAS.
- N. Duraisamy, S.-J. Hong and K.-H. Choi, Chem. Eng. J., 2013, 225, 887–894 CrossRef CAS.
- J. P. Thomas and K. T. Leung, Adv. Funct. Mater., 2014, 24, 4978–4985 CrossRef CAS.
- K. Hong, S. Y. Yang, C. Yang, S. H. Kim, D. Choi and C. E. Park, Org. Electron., 2008, 9, 864–868 CrossRef CAS.
- P. W. Atkins and J. De Paula, Atkins' Physical chemistry, Oxford University Press, Oxford, New York, 8th edn, 2006 Search PubMed.
- T.-R. Chou, S.-H. Chen, Y.-T. Chiang, Y.-T. Lin and C.-Y. Chao, J. Mater. Chem. C, 2015, 3, 3760–3766 RSC.
- R. Pacios, R. Marcilla, C. Pozo-Gonzalo, J. A. Pomposo, H. Grande, J. Aizpurua and D. Mecerreyes, J. Nanosci. Nanotechnol., 2007, 7, 2938–2941 CrossRef CAS PubMed.
- T. Ji, L. Tan, X. Hu, Y. Dai and Y. Chen, Phys. Chem. Chem. Phys., 2015, 17, 4137–4145 RSC.
- C.-H. Wu, T.-M. Don and W.-Y. Chiu, Polymer, 2011, 52, 1375–1384 CrossRef CAS.
- S. S. Zumdahl, Chemistry, Brooks/Cole, Cengage Learning, Belmont, CA, 8th edn, 2010 Search PubMed.
- O. Levenspiel, Chemical reaction engineering, Wiley, New York, 3rd edn, 1999 Search PubMed.
- H. Hart, Organic chemistry: a short course, Houghton Mifflin, Boston, 12th edn, 2007 Search PubMed.
- H. S. Fogler, Elements of chemical reaction engineering, Prentice Hall PTR, Upper Saddle River, N.J., 3rd edn, 1999 Search PubMed.
- E. Lucht, I. Rocha, E. S. Orth, I. C. Riegel-Vidotti and M. Vidotti, Mater. Lett., 2015, 149, 116–119 CrossRef CAS.
- J. Kim, C. Park, S. Im, H. Lee and J. H. Kim, RSC Adv., 2019, 9, 4028–4034 RSC.
- S. Sakamoto, M. Okumura, Z. Zhao and Y. Furukawa, Chem. Phys. Lett., 2005, 412, 395–398 CrossRef CAS.
- Y. Kim, W. Cho, Y. Kim, H. Cho and J. H. Kim, J. Mater. Chem. C, 2018, 6, 8906–8913 RSC.
- C. Wang, K. Sun, J. Fu, R. Chen, M. Li, Z. Zang, X. Liu, B. Li, H. Gong and J. Ouyang, Adv. Sustainable Syst., 2018, 2, 1800085 CrossRef.
- L. Ouyang, C. Musumeci, M. J. Jafari, T. Ederth and O. Inganas, ACS Appl. Mater. Interfaces, 2015, 7, 19764–19773 CrossRef CAS PubMed.
- W. Kim, S. Kim, S. U. Chai, M. S. Jung, J. K. Nam, J. H. Kim and J. H. Park, Nanoscale, 2017, 9, 12677–12683 RSC.
- A. Hu, L. Tan, X. Hu, L. Hu, Q. Ai, X. Meng, L. Chen and Y. Chen, J. Mater. Chem. C, 2017, 5, 382–389 RSC.
- N. Kim, S. Kee, S. H. Lee, B. H. Lee, Y. H. Kahng, Y. R. Jo, B. J. Kim and K. Lee, Adv. Mater., 2014, 26, 2268–2272 CrossRef CAS PubMed.
- N. Kim, B. H. Lee, D. Choi, G. Kim, H. Kim, J. R. Kim, J. Lee, Y. H. Kahng and K. Lee, Phys. Rev. Lett., 2012, 109, 106405 CrossRef PubMed.
- E. Yildirim, G. Wu, X. Yong, T. L. Tan, Q. Zhu, J. Xu, J. Ouyang, J.-S. Wang and S.-W. Yang, J. Mater. Chem. C, 2018, 6, 5122–5131 RSC.
- S. H. Lee, J. S. Sohn, S. B. Kulkarni, U. M. Patil, S. C. Jun and J. H. Kim, Org. Electron., 2014, 15, 3423–3430 CrossRef CAS.
- R. Chang and J. W. Thoman, Physical chemistry for the chemical sciences, University Science Books, Mill Valley, California, 2014 Search PubMed.
- I. Popescu, E. Heracleous, Z. Skoufa, A. Lemonidou and I. C. Marcu, Phys. Chem. Chem. Phys., 2014, 16, 4962–4970 RSC.
| This journal is © The Royal Society of Chemistry 2019 |

