DOI:
10.1039/C9RA02184A
(Paper)
RSC Adv., 2019,
9, 17308-17317
One-step preparation of N,O co-doped 3D hierarchically porous carbon derived from soybean dregs for high-performance supercapacitors†
Received
21st March 2019
, Accepted 9th May 2019
First published on 3rd June 2019
Abstract
Hierarchically porous carbon (HPC) material based on environmental friendliness biomass has spurred much attention, due to its high surface area and porous structure. Herein, three-dimensional (3D) N,O co-doped HPC (N–O-HPC) was prepared by using a one-step fabrication process of simultaneously carbonizing and activating soybean dregs and used as an electrode for supercapacitors (SCs). The obtained N–O-HPC with 4.8 at% N and 6.1 at% O exhibits a pretty small charge transfer resistance (0.05 Ω) and a large specific capacitance (408 F g−1 at 1 A g−1), due to its 3D hierarchically porous framework structure with extremely large specific surface area (1688 m2 g−1). Moreover, a symmetrical SC assembled with the HPC electrode exhibits an amazingly high energy density (22 W h kg−1 at 450 W kg−1) and a stable long cycling life with only 6% capacitance loss after 5000 cycles in 1 M Na2SO4 solution. This work provides a facile, green, and low-cost way to prepare electrode materials for SCs.
1. Introduction
Recently, electronic devices with lightweight and portable properties,1–4 such as transistors,5,6 solar cells,7 photodetectors,8–12 light-emitting diodes13 and so on, have spurred the development of high-performance rechargeable energy storage systems. Compared with Zn–air batteries14 and lithium batteries,15 supercapacitors (SCs) have attracted intense attention for portable electronics, electric vehicles and other high power applications, mainly owing to their excellent performances, such as long cycle life and large power density.16–19 However, the active electrode materials of SCs reported so far exhibit low energy density, which impedes their further applications in next generation electronic devices.19
In order to meet the demand for energy devices, the development of active electrode materials with large energy density has become a hot topic.17,18 It is well known that carbon materials for SCs have gained more and more attention, like graphene,20 carbon nanotubes, carbon hollow particles,21 carbon spheres22,23 and carbon black, because of their unique chemical and physical characteristics.24–27 But the low performance-to-price ratio, harsh synthetic conditions and toxic procreant intermediates of those carbon materials limit their commercial applications. Therefore, developing porous carbon materials via more effective, eco-friendly and low-cost ways remains highly necessary.24,28–31 Recently, abundant biomass resources and their derivatives have shown great advantages to prepare the porous carbon material structures, which arouse rapidly increasing interest to be used as SC electrode materials.32,33 For instance, porous carbon based on pomelo mesocarps was reported by Peng et al., and showed a high specific surface area (975 m2 g−1) and a high specific capacitance (240 F g−1 at 0.5 A g−1) for SCs.34 Wheat straws derived porous carbon displayed a large specific surface area (892 m2 g−1) and a high specific capacitance (260 F g−1 at 0.5 A g−1).35 It is known that specific surface area of porous carbon plays an important role in the capacitive performance of SCs. However, the relationship between specific surface area and capacitance performance is non-linear. The appropriate pore size structure distribution (e.g., micropores, mesopores, and macropores) of porous carbon materials is very important to enhance their capacitance performance. Micropores can provide their high accessible surface area and rich ion adsorption sites, while mesopores and macropores can decrease inner-pore ion-transport resistance and shorten diffusion distance.36,37 The 3D hierarchically porous carbon (HPC) possesses appropriate hierarchically porous framework structure with a large specific surface area, which can enhance electro-active surface area for ion storage and shorten diffusion pathways.24,38 Meanwhile, many researchers found that doping heteroatoms (e.g., N, O or S) into porous carbon materials could improve the surface wettability and enhance the electrical conductivity.39,40 Furthermore, these heteroatoms can also generate extra pseudocapacitance due to their electron-donor characteristics.41 Therefore, it is highly desirable to explore a facile, renewable and cost-effective strategy to prepare HPC with heteroatom doping.42,43
Herein, 3D N,O co-doped HPC was facilely and cost-effectively prepared with low-cost soybean dregs for a high-performance SC application, using one-step simultaneous carbonization and activation. As a raw material, the soybean dreg with a high content of protein is a low-cost biomass offering the possibility for practical applications, which could act as a natural template to prepare HPC with N,O co-doping. The obtained 3D N–O-HPC material displays outstanding capacitive performance, owing to its large specific surface area (1688 m2 g−1) with a unique 3D hierarchical framework structure and high N (4.8 at%) and O (6.1 at%) contents, offering a large ion-accessible surface area, abundant active sites and efficient electrolyte–ion transport pathways. Importantly, the symmetric SCs assembled by HPC electrodes exhibit an amazingly high energy density (22 W h kg−1 at a power density of 450 W kg−1) in 1 M Na2SO4 solution. The capacitance retention ratio can reach up to 94% over 5000 cycles, showing a long life cycling stability.
2. Experimental section
2.1 Preparation of N–O-HPC
The soybean dregs were crushed and sieved with a 200 mesh sieve. Subsequently, 3.0 g of soybean dregs was dispersed into the aqueous solution (50 mL) with different weights of ZnCl2 and Mg(NO3)2 under continuously stirring for 12 h, followed by a freeze-drying process (Freezone, Labconco) to obtain a solid mixture. The mixture was treated in a tube furnace under a N2 flow (800 °C for 2 h, heating rate: 5 °C min−1), and then soaked in 6 M HCl solution for 24 h. After washing with ultrapure water and drying at 70 °C for 24 h, the hierarchically porous carbon material was obtained. All samples were named as N–O-HPC-0, N–O-HPC-1, N–O-HPC-2, and N–O-HPC-3 according to the weights of activating agent (Mg(NO3)2 and ZnCl2) (0 and 0 g), (3 and 0 g), (0 and 3 g), and (3 and 3 g), respectively.
2.2 Characterizations
The surface morphologies and microstructures of all samples were observed by transmission electron microscopy (TEM, Tecnai G2 F20) and scanning electron microscopy (SEM, QUANTA250). The crystallinity of the samples was characterized by Raman spectroscopy (Horiba Xplora-plus) and X-ray diffraction (XRD, Rigaku Smartlab). The chemical bond structure of materials was examined by the X-ray photoelectron spectroscope (XPS) using Thermo Scientific ESCALab 250Xi system. The N2 adsorption/desorption isotherms of as-prepared samples were obtained by ASAP 2020 system (Micromeritics, Norcross, GA). The Brunauer–Emett–Teller (BET) specific surface areas, total pore volumes and pore size distributions were analyzed through N2 adsorption/desorption isotherms.
2.3 Electrochemical measurement
The obtained slurry of electrode materials was fabricated by mixing the obtained sample (80%), polyvinylidene fluoride (PVDF, 10%) and acetylene black (10%) using a certain amount of N-methyl-2-pyrrolidone (NMP) as solvent, which was cast on a carbon paper (20 × 20 mm2) as working electrode. Then the working electrode was dried (70 °C for 24 h). The loading mass of electrode materials is 4 mg for electrochemical tests. In the three-electrode system, an Ag/AgCl electrode and a Pt foil electrode (10 × 10 mm2) acted as the reference and counter electrode, respectively. The electrochemical measurements, such as electrochemical impedance spectroscopy (EIS, 0.01–100000 Hz) at an open circuit potential, cyclic voltammetry (CV, 2–100 mV s−1) and galvanostatic charge/discharge (GCD, 1–20 A g−1), were carried out with a CHI660E electrochemical workstation (CHI Instruments Co.) using a 1 M H2SO4 aqueous solution. The specific capacitances (Cg, F g−1) of all samples were obtained from the GCD curves as follows:| |
 | (1) |
where ΔV (V) is the applied voltage window, Id (A) is the discharge current, Δt (s) is discharge time and m (g) is the mass of active materials.
The symmetrical SCs were assembled by HPC electrodes and measured using a two electrode system in 1 M H2SO4 and 1 M Na2SO4 solutions, respectively. To investigate the electrochemical performances of the symmetrical SCs, CV, GCD and life cycling measurements were performed using a CHI660D electrochemical workstation (CHI Instruments Co.). Energy density (E, W h kg−1) and power density (P, W kg−1) of the symmetrical SCs were calculated by equations below:
| |
 | (2) |
| |
 | (3) |
where
m (g) is the total mass of active materials.
3. Results and discussion
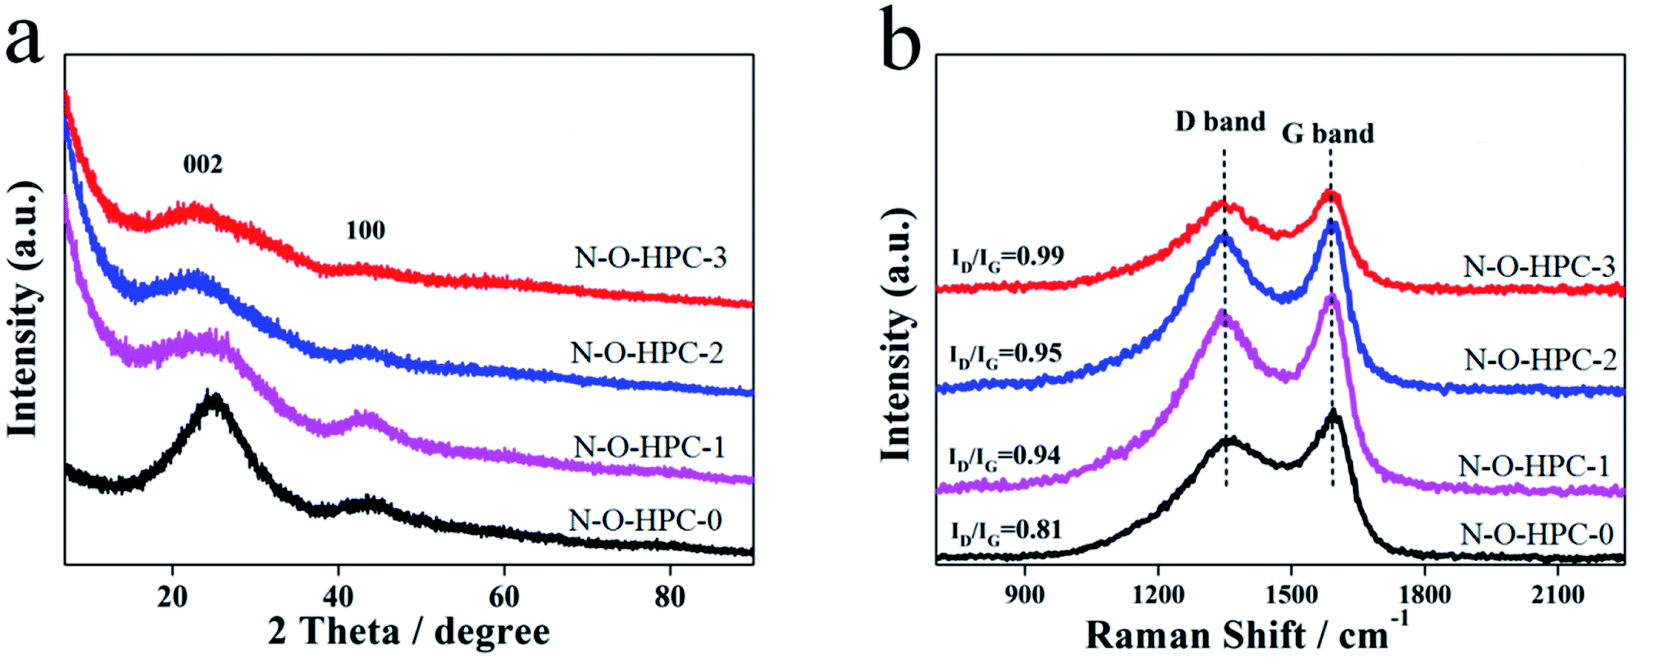
The composition and crystallinity of as-prepared samples were measured by XRD and Raman techniques. The XRD patterns of as-prepared samples are shown in Fig. 1a, where the observed broad and weak peaks at about 24° and 45° are attributed to the diffraction of (002) and (100) planes of graphite,44,45 respectively. Compared with N–O-HPC-0, the XRD peaks of other samples shift to a lower angle, meaning that they are formed by the defective nature of carbon.46 Meanwhile the patterns display an obviously enhanced intensity at 2θ < 20°, which demonstrates the presence of more micropores.46 Raman spectra were tested to further confirm the structure of as-prepared samples. The observed peak at about 1350 cm−1 corresponds to D band (defective graphitic structures or disordered carbon), and the peak at about 1580 cm−1 is assigned to G band (graphitic layers) as shown in Fig. 1b. The intensity ratio of two bands (ID/IG) represents the defective graphitic structures or disordered carbon.47 The ID/IG of N–O-HPC-3 is the largest (0.99), indicating more disorders and defects in the sample. It should be noted that the disorders and defects can provide extra sites for ion accommodation, which is beneficial to electrochemical performance.
 |
| | Fig. 1 XRD patterns (a) and Raman spectra (b) of N–O-HPC-0, N–O-HPC-1, N–O-HPC-2 and N–O-HPC-3. | |
The surface microstructure and morphologies of all samples were examined by using SEM, TEM, HRTEM and SAED techniques. As shown in Fig. 2a, N–O-HPC-0 exhibits a relatively smooth surface without porous structure. After being activated with Mg(NO3)2 or ZnCl2, many porous structures are observed on the surfaces of as-prepared N–O-HPC-1 and N–O-HPC-2 as shown in Fig. 2b and c. It should be noted that N–O-HPC-3 possesses a 3D hierarchically porous framework structures with a plenty of mesopores and macropores due to the Mg(NO3)2 and ZnCl2 co-activation as shown in Fig. 2d. As shown in Fig. 2e and f, the TEM image of N–O-HPC-3 displays an ultrathin sheet-like pore wall, due to the highly interconnected porous structure, which is beneficial to the quick transportation of electrolyte ions. In addition, the SAED pattern of N–O-HPC-3 without any lattice structure is displayed in the inset of Fig. 2f, confirming the high defective graphitic structure. Therefore, it is expected that the N–O-HPC-3 with porous structures and high defective graphitic structure can enhance capacitive behavior.
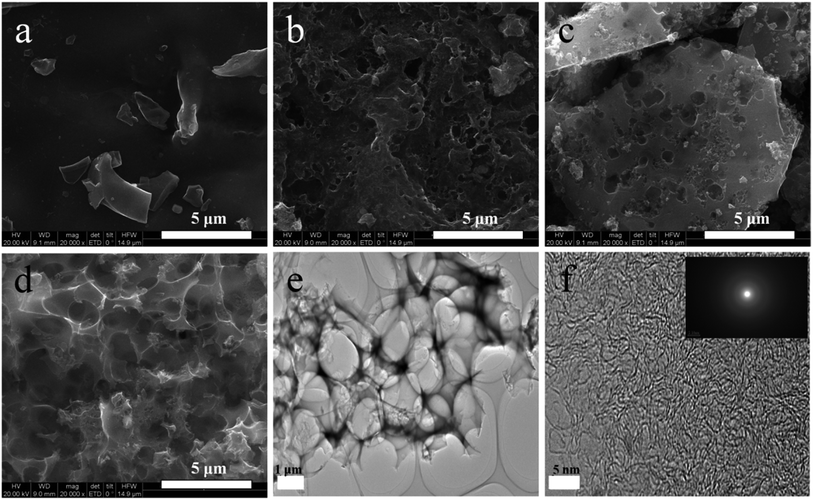 |
| | Fig. 2 SEM images of (a) N–O-HPC-0, (b) N–O-HPC-1, (c) N–O-HPC-2 and (d) N–O-HPC-3. (e and f) TEM images of N–O-HPC-3. Inset is SAED pattern. | |
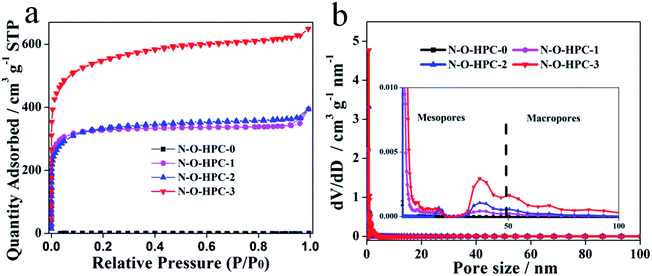
To further identify pore structures of as-prepared samples, the N2 adsorption/desorption isotherms were measured. Compared with N–O-HPC-0, the others show I type isotherms as shown in Fig. 3a. The strong adsorption (P/P0 < 0.01) and broadened knees (0.01 < P/P0 < 0.4) of N–O-HPC-1, N–O-HPC-2 and N–O-HPC-3 mean that there exists a high porosity of micropores in combination with mesopores. Meanwhile, a slight upward tendency presents at the relative high pressure (P/P0 = 0.95–1.0), corresponding to the presence of macropores. As shown in Table 1, the total pore volumes of N–O-HPC-0, N–O-HPC-1, N–O-HPC-2 and N–O-HPC-3 are 0.001, 0.69, 0.71 and 1.28 cm3 g−1, and their specific surface areas are 1.3, 972, 1008 and 1688 m2 g−1, respectively. It can be seen that N–O-HPC-0 displays the smallest total pore volume and specific surface area. Meanwhile N–O-HPC-3 exhibits the largest total pore volume (1.28 cm3 g−1) and specific surface area (1688 m2 g−1), which can provide more electrochemical active sites. Furthermore, the pore size distributions of all samples are analyzed by density functional theory (DFT) model, as shown in the Fig. 3b. It can be seen that the as-prepared samples show the hierarchical porosity. Notably, N–O-HPC-3 possesses more micropores, mesopores and macropores, showing a better hierarchical porosity structure.
 |
| | Fig. 3 (a) N2 adsorption/desorption isotherms and (b) pore size distributions of N–O-HPC-0, N–O-HPC-1, N–O-HPC-2 and N–O-HPC-3. | |
Table 1 Specific surface area (SBET), total pore volume (Vtotal), Rs and Rct of N–O-HPC-0, N–O-HPC-1, N–O-HPC-2 and N–O-HPC-3
| Samples |
SBET (m2 g−1) |
Smica (m2 g−1) |
Sextb (m2 g−1) |
Vtotal (cm3 g−1) |
Rs (Ω) |
Rct (Ω) |
| Specific surface area of micropores. Specific surface area of other pores. |
| N–O-HPC-0 |
1.3 |
0.72 |
0.58 |
0.001 |
1.67 |
0.64 |
| N–O-HPC-1 |
972 |
811 |
161 |
0.69 |
1.57 |
0.07 |
| N–O-HPC-2 |
1008 |
662 |
346 |
0.71 |
1.22 |
0.06 |
| N–O-HPC-3 |
1688 |
1056 |
632 |
1.28 |
0.63 |
0.05 |
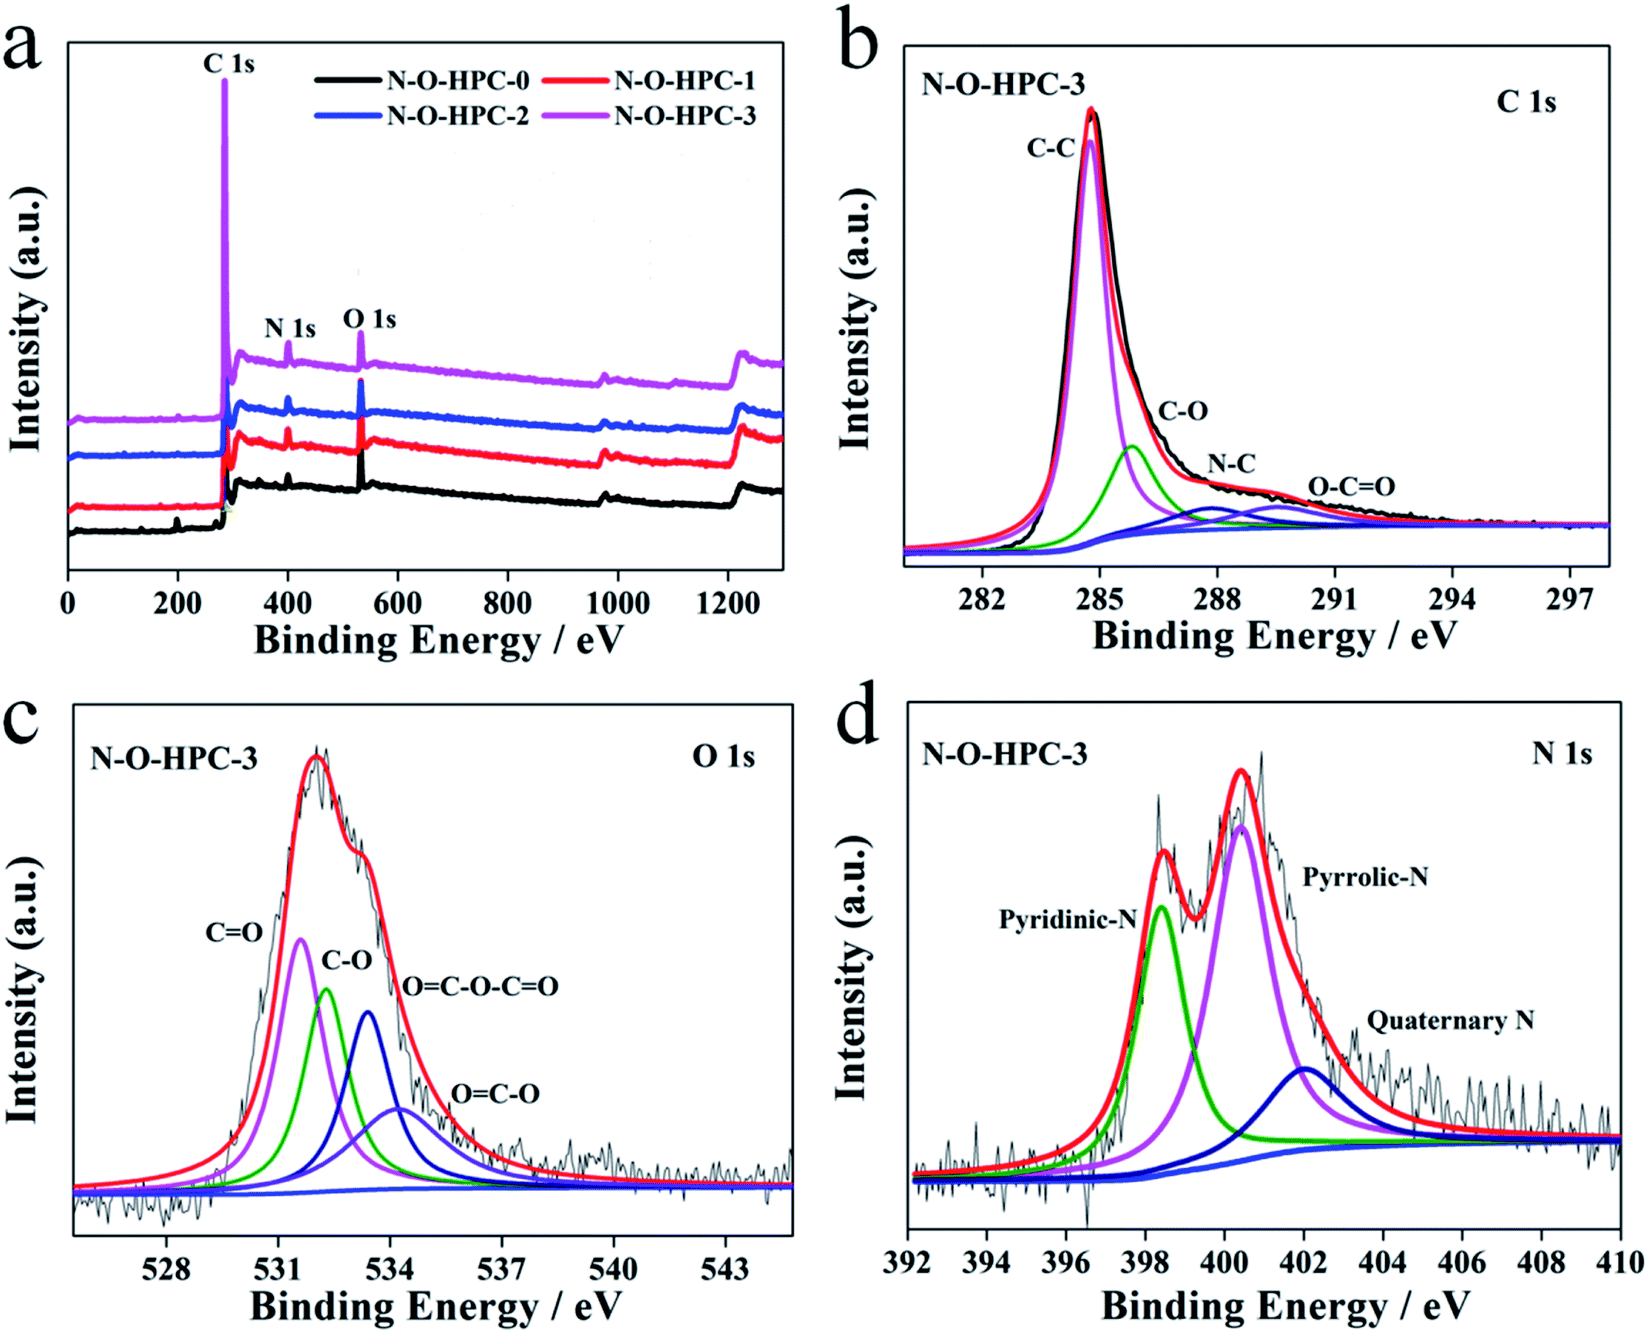
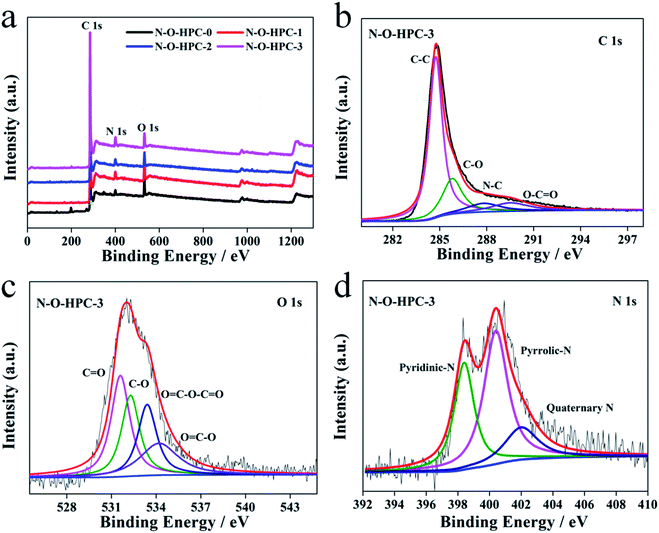
The surface chemical composition and elemental bond states of as-prepared samples are examined by XPS. As shown in Fig. 4a, all samples show three characteristic peaks at about 533, 400 and 284 eV in the XPS spectra, corresponding to the binding energies of N 1s, O 1s and C 1s species, indicating the N,O co-doping during carbonizing.48,49 The surface elemental contents are calculated and shown in Table S1.† It can be seen that there is no obvious change in N content after ZnCl2 or Mg(NO3)2 treatment. In the activation process, O content obviously decreases while O content of N–O-HPC-3 can still reach 6.1%. To further evaluate the surface element chemical states of as-prepared samples, the high-resolution XPS C 1s, O 1s and N 1s of N–O-HPC-3 are analyzed. As shown in Fig. 4b, C spectrum can be fitted by four component peaks, corresponding to O–C![[double bond, length as m-dash]](https://www.rsc.org/images/entities/char_e001.gif) O (289.0 eV), C–N (286.5 eV), C–O (285.6 eV) and C–C/CC (284.5 eV), respectively.50 And O spectrum can be approximately divided into four peaks at 534.2, 533.4, 532.3 and 531.6 eV in Fig. 4c, which correspond to O–CO, OC–O–CO, O–C and OC, respectively.49 According to the previous reports, O–C and OC can contribute to pseudocapacitance to enhance electrochemical performances.51,52 The presence of other O containing functional groups is beneficial to surface wettability, which can potentially facilitate the accessibility of the electrolyte ions.53,54 As shown in Fig. 4d, N spectrum can be approximately fitted by three component peaks at 402, 400.4, and 398.4 eV, corresponding to quaternary N (N-Q), pyrrolic/pyridone-N (N-5) and pyridinic N (N-6), respectively. According to the studies reported previously, N-5 and N-6 can contribute to pseudocapacitance as follows:55,56
O (289.0 eV), C–N (286.5 eV), C–O (285.6 eV) and C–C/CC (284.5 eV), respectively.50 And O spectrum can be approximately divided into four peaks at 534.2, 533.4, 532.3 and 531.6 eV in Fig. 4c, which correspond to O–CO, OC–O–CO, O–C and OC, respectively.49 According to the previous reports, O–C and OC can contribute to pseudocapacitance to enhance electrochemical performances.51,52 The presence of other O containing functional groups is beneficial to surface wettability, which can potentially facilitate the accessibility of the electrolyte ions.53,54 As shown in Fig. 4d, N spectrum can be approximately fitted by three component peaks at 402, 400.4, and 398.4 eV, corresponding to quaternary N (N-Q), pyrrolic/pyridone-N (N-5) and pyridinic N (N-6), respectively. According to the studies reported previously, N-5 and N-6 can contribute to pseudocapacitance as follows:55,56
| |
 | (5) |
| |
 | (6) |
 |
| | Fig. 4 (a) XPS survey spectra of N–O-HPC-0, N–O-HPC-1, N–O-HPC-2 and N–O-HPC-3. High-resolution XPS (b) C 1s, (c) O 1s, and (d) N 1s spectra of N–O-HPC-3. | |
In addition, N-Q can improve high conductivity and facilitate electron transfer of carbon materials.57 The higher surface N/O ratio (Table S1†) of N–O-HPC-3 compared with other samples is more favorable for electrochemical performance, because of higher electrochemical stability of the nitrogen groups than oxygen groups.58,59
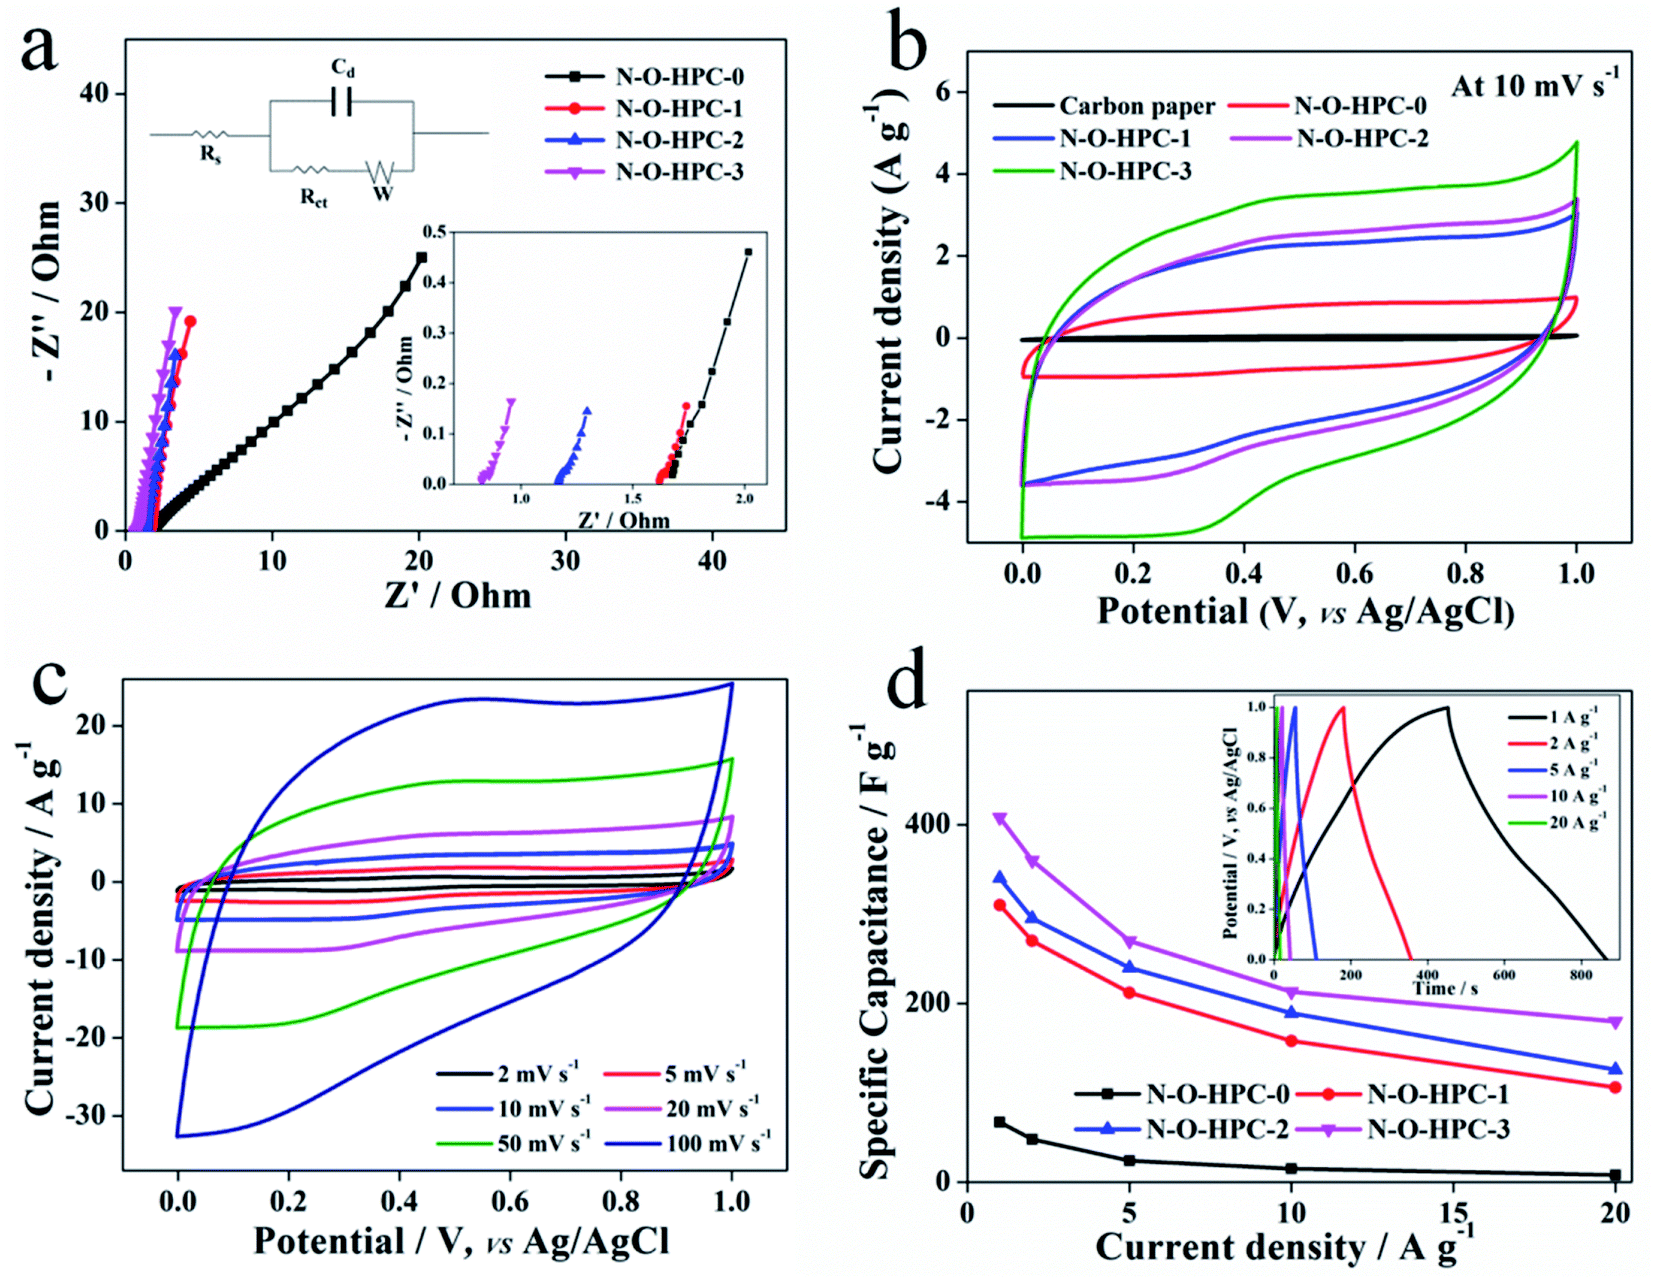
In a three-electrode system, electrochemical performances of all electrodes were firstly tested in a 1 M H2SO4 electrolyte, as shown in Fig. 5. EIS curves of as-prepared samples are tested and shown in Fig. 5a. In the high frequency region (the zoom-in inset of Fig. 5a), the diameter of semi-circle represents the charge transfer resistance (Rct), and the point intersecting with the real axis is internal series resistance of the electrochemical system (Rs), whose values are listed in Table 1. And the corresponding equivalent circuit model of EIS is shown in the upper-left-corner inset of Fig. 5a. The Rct values of N–O-HPC-0, N–O-HPC-1, N–O-HPC-2 and N–O-HPC-3 are 0.64, 0.07, 0.06 and 0.05 Ω, and their Rs values are 1.67, 1.57, 1.22 and 0.63 Ω, respectively. It can be seen that Rct and Rs of N–O-HPC-3 are both the smallest, owning to its 3D hierarchically porous framework structure with largest specific surface area. Fig. 5b shows the CV curves of as-prepared electrodes and carbon paper at 10 mV s−1. It should be noted that the CV curves exhibit quasi-rectangular shapes with reversible humps, indicating their capacitances contributed by EDLC and pseudocapacitance (N-5 and N-6). Obviously, N–O-HPC-0 exhibits the minimum area, because of its low specific surface, leading to the lowest capacitance.60 N–O-HPC-3 shows the maximum area, corresponding to the highest capacitance, mainly due to its better hierarchical porosity structure with large specific surface. Meanwhile, the GCD curves of all samples and carbon paper at 2 A g−1 are consistent with CV results (Fig. S1†). The CV curves at different scanning rates (2–100 mV s−1) of N–O-HPC-3 are shown in Fig. 5c. With the increase of scanning rate, the area of CV curve is expanded. Even at a scanning rate of 100 mV s−1, the CV curve of N–O-HPC-3 electrode displays a quasi-symmetric rectangular shape, indicating a small resistance and fast ion transport.61,62 To further evaluate the electrochemical performances, Fig. 5d displays the specific capacitances of all electrodes at different current densities, which are calculated by the GCD curves. The specific capacitances of N–O-HPC-0, N–O-HPC-1, N–O-HPC-2 and N–O-HPC-3 are found to be 67, 310, 340 and 408 F g−1 at 1 A g−1, respectively. Even at 20 A g−1, the specific capacitance of N–O-HPC-3 is 180 F g−1 (44% of the initial capacitance at 1 A g−1), while the capacitance retentions of N–O-HPC-1 and N–O-HPC-2 are 35% and 37%, respectively. In the inset of Fig. 5d, the curves of N–O-HPC-3 at different current densities display triangular symmetry, implying highly reversible charge–discharge behavior. Amazingly, compared with the other state-of-the-art values reported in the recent literatures (Table 2),28,63–74 the N–O-HPC-3 in this work displays the highest specific capacitance, owning to its largest specific surface area with 3D hierarchically porous structure and N and O co-doping.
 |
| | Fig. 5 Electrochemical performances tested in 1 M H2SO4 electrolyte using a three-electrode system: (a) Nyquist plots of N–O-HPC-0, N–O-HPC-1, N–O-HPC-2 and N–O-HPC-3. The inset at lower right corner is the zoom-in Nyquist plots and that at upper left corner is corresponding equivalent circuit model. (b) CV curves of carbon paper, N–O-HPC-0, N–O-HPC-1, N–O-HPC-2 and N–O-HPC-3 at the scan rate of 10 mV s−1. (c) CV cures of N–O-HPC-3 at different scan rates (2–100 mV s−1). (d) Specific capacitances of N–O-HPC-0, N–O-HPC-1, N–O-HPC-2 and N–O-HPC-3 at different current densities. Inset shows GCD curves of N–O-HPC-3 at different current densities. | |
Table 2 Electrochemical performances of soybean dregs and other biomass derived-carbon reported in the literatures
| Precursor |
Cm (F g−1/A g−1) |
Electrolyte |
Ref. |
| Bamboo stalk |
222/0.5 |
6 M KOH |
63 |
| Auricularia |
374/0.5 |
6 M KOH |
64 |
| Human hair |
340/1 |
6 M KOH |
65 |
| Waste Coca Cola® |
352/1 |
6 M KOH |
28 |
| Shell of broad beans |
202/0.5 |
6 M KOH |
66 |
| Corn straw |
222/1 |
6 M KOH |
67 |
| Sugar industry spent wash waste |
121/0.1 |
6 M KOH |
68 |
| Bradyrhizobium japonicum |
358/1 |
6 M KOH |
69 |
| Wheat flour |
383/0.25 |
1 M H2SO4 |
70 |
| Gelatin |
312/1 |
1 M H2SO4 |
71 |
| Hydro-char |
279/0.1 |
1 M H2SO4 |
72 |
| Yogurt |
225/2 |
1 M H2SO4 |
73 |
| Olive residues |
224/0.25 |
1 M H2SO4 |
74 |
| Soybean dregs |
408/1 |
1 M H2SO4 |
This work |
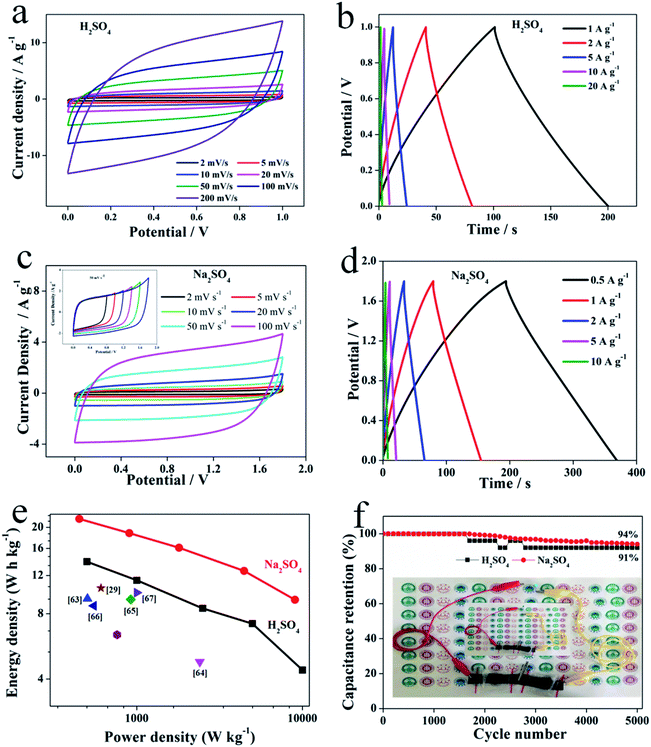
To further investigate the electrochemical performances of as-prepared N–O-HPC-3, the N–O-HPC-3//N–O-HPC-3 symmetric SCs were assembled and tested in a two-electrode system (Fig. 6). The CV curves of the assembled symmetric SCs at different scanning rates (2–200 mV s−1) were measured in 1 M H2SO4 and shown in Fig. 6a. Even at 200 mV s−1, the CV curve displays a nearly symmetrical rectangular shapes. Moreover, Fig. 6b shows the GCD curves at different current densities (1–20 A g−1), which exhibit equilateral triangle shapes. With the increase of current density, the specific capacitance decreases, and the values at 1 and 20 A g−1 are 100 and 24 F g−1, respectively. The assembled symmetric SCs were further tested in 1 M Na2SO4 solution electrolyte. Fig. 6c exhibits the CV curves of the symmetric SCs at different scanning rates (2–100 mV s−1). Clearly, the CV curve still keeps a rectangular-like shape at 100 mV s−1. Meantime, CV curves in different voltage windows at 50 mV s−1 are also shown in the inset Fig. 6c. It can be seen that the CV curve at 1.8 V voltage window can still maintain a rectangular-like shape. Fig. 6d exhibits the GCD curves of the symmetric SCs at different current densities (0.5–10 A g−1). All GCD curves with a small internal resistance (IR) drop are symmetrically triangular, indicating that the symmetric SCs show highly reversible charge–discharge behavior. The Ragone plots of the symmetric SCs derived from GCD curves using 1 M H2SO4 and 1 M Na2SO4 as electrolyte are shown in Fig. 6e. It can be seen that energy density of the symmetric SCs using 1 M H2SO4 as electrolyte is 14 W h kg−1 (500 W kg−1). Meanwhile, the assembled symmetric SC using 1 M Na2SO4 as electrolyte displays a very high energy density (22 W h kg−1 at 450 W kg−1), which is much higher than recently reported data from biomass derived carbons (Table 3 and Fig. 6e).29,75–80 Furthermore, the capacitance retentions after 5000 cycles at 10 A g−1 using 1 M H2SO4 and 1 M Na2SO4 as electrolytes are 91% and 94%, respectively, as shown in Fig. 6f, indicating the excellent long cycling stability. Additionally, two N–O-HPC-3//N–O-HPC-3 symmetric SCs in series after being charged to 3.6 V using gel electrolyte (Na2SO4) can light the blue light-emitting diode (LED, 3 V) for 90 s.
 |
| | Fig. 6 Electrochemical performance of N–O-HPC-3//N–O-HPC-3 symmetric SCs measured in a two-electrode system: (a) CV curves at different scanning rates (2–100 mV s−1) in the H2SO4 electrolyte. (b) GCD curves at different current densities in the H2SO4 electrolyte. (c) CV curves at different scanning rates (2–100 mV s−1) in the Na2SO4 electrolyte. The inset is CV curves with different window at 50 mV s−1. (d) GCD curves at different current densities in the Na2SO4 electrolyte. (e) Ragone plot of the symmetrical system. (f) Cycling stability at a current density of 10 A g−1 (inset: photographs of lighting LED powered by N–O-HPC-3//N–O-HPC-3 symmetric SCs). | |
Table 3 Comparison of the performances of N–O-HPC-3//N–O-HPC-3 symmetric SCs in this work and the biomass-derived carbonaceous materials based SCs reported in the literatures
| Precursor |
E (W h kg−1)/P (W kg−1) |
Ref. |
| Coconut shell |
9.38/503.7 |
75 |
| Sunflower seed shell |
4.8/2400 |
76 |
| Sawdust |
9.3/920 |
77 |
| Sugar cane bagasse |
8.7/550 |
78 |
| Prawn shells |
10/1000 |
79 |
| Harmful aquatic plant |
10.5/608 |
80 |
| Hemicellulose |
6.4/760 |
29 |
| Soybean dregs (N–O-HPC-3) |
22/450 (1 M Na2SO4), 14/500 (1 M H2SO4) |
Our work |
4. Conclusions
In summary, the as-prepared N–O-HPC-3 as electrode displays a high specific capacitance (408 F g−1 at 1 A g−1) and the smallest Rct (0.05 Ω) and Rs (0.63 Ω), due to its 3D hierarchically porous structure with large specific surface area (1688 m2 g−1), total pore volume (1.28 cm3 g−1) and N (4.8 at%) and O (6.1 at%) co-doping. Moreover, the N–O-HPC-3//N–O-HPC-3 symmetric SC with a wide voltage window of 1.8 V exhibits a very high energy density (22 W h kg−1 at 450 W kg−1) and 94% capacitance retention after 5000 cycles. The much better performance of N–O-HPC-3 compared with those reported previously demonstrates that it should be a promising electrode material for SCs.
Conflicts of interest
There are no conflicts to declare.
Acknowledgements
The authors sincerely acknowledge financial support from the Provincial Natural Science Foundation of Anhui (1908085ME120), Primary Research and Development Program of Anhui Province (201904a05020087), and the Scientific Research Foundation of Suzhou University (2016XJXS05 and 2018SZXYDZXZ02), Outstanding Youth Talents in Anhui Provincial Education Department (2017GXBJZD47), Innovative Research Team of Anhui Provincial Education Department (2016SCXPTTD), and Key Discipline of Material Science and Engineering of Suzhou University (2017XJZDXK3), National Public Welfare Special Foundation (201504502), Science and technology development program project of Jilin province in 2017 (20170203001SF).
References
- C. H. Lin, B. Cheng, T. Y. Li, J. R. D. Retamal, T. C. Wei, H. C. Fu, X. Fang and J. H. He, ACS Nano, 2019, 13, 1168–1176 CAS.
- W. Yang, K. Hu, F. Teng, J. Weng, Y. Zhang and X. Fang, Nano Lett., 2018, 18, 4697–4703 CrossRef CAS PubMed.
- Q. Zhang, M. M. Tavakoli, L. Gu, D. Zhang, L. Tang, Y. Gao, J. Guo, Y. Lin, S. F. Leung, S. Poddar, Y. Fu and Z. Fan, Nat. Commun., 2019, 10, 727 CrossRef.
- S. Cai, X. Xu, W. Yang, J. Chen and X. Fang, Adv. Mater., 2019, 31, 1808138 CrossRef.
- K. Nakayama, W. Ou-Yang, M. Uno, I. Osaka, K. Takimiya and J. Takeya, Org. Electron., 2013, 14, 2908–2915 CrossRef CAS.
- Y. Wang, L. Sun, C. Wang, F. Yang, X. Ren, X. Zhang, H. Dong and W. Hu, Chem. Soc. Rev., 2019, 48, 1492–1530 RSC.
- J. Zhang, W. Mao, X. Hou, J. Duan, J. Zhou, S. Huang, W. Ou-Yang, X. Zhang, Z. Sun and X. Chen, Sol. Energy, 2018, 174, 1133–1141 CrossRef CAS.
- X. Han, S. Feng, Y. Zhao, L. Li, Z. Zhan, Z. Tao, Y. Fan, W. Lu, W. Zuo and D. Fue, RSC Adv., 2019, 9, 1394–1402 RSC.
- Y. Zhang, W. Xu, X. Xu, J. Cai, W. Yang and X. Fang, J. Phys. Chem. Lett., 2019, 10, 836–841 CrossRef CAS PubMed.
- T. Zou, J. Zhang, S. Huang, C. Liu, R. Qiu, X. Wang, W. Wu, H. Wang, Z. Wei, Q. Dai, C. Liu, S. Zhang and H. Zhou, RSC Adv., 2019, 9, 3800–3808 RSC.
- B. Zhao, F. Wang, H. Chen, L. Zheng, L. Su, D. Zhao and X. Fang, Adv. Funct. Mater., 2017, 27, 1700264 CrossRef.
- Z. Zhang, Y. Ning and X. Fang, J. Mater. Chem. C, 2019, 7, 223–229 RSC.
- C. Larson, B. Peele, S. Li, S. Robinson, M. Totaro and L. Beccai, Science, 2016, 351, 1071–1076 CrossRef CAS PubMed.
- Z. Ma, H. Zhang, X. Sun, J. Guo and Z. Li, Appl. Surf. Sci., 2017, 420, 196–204 CrossRef CAS.
- R. Atchudan, T. N. J. I. Edison, S. Perumal and Y. R. Lee, Appl. Surf. Sci., 2017, 393, 276–286 CrossRef CAS.
- B. Yang, C. Hao, F. Wen, B. Wang, C. Mu and J. Xiang, ACS Appl. Mater. Interfaces, 2017, 9, 44478–44484 CrossRef CAS PubMed.
- X. H. Liu, Z. B. Wen, D. B. Wu, H. L. Wang, J. H. Yang and Q. G. Wang, J. Mater. Chem. A, 2014, 2, 11569–11573 RSC.
- X. Liu, S. Zou, K. Liu, C. Lv, Z. Wu and Y. Yin, J. Power Sources, 2018, 384, 214–222 CrossRef CAS.
- T. Lv, M. Liu, D. Zhu, L. Gan and T. Chen, Adv. Mater., 2018, 30, 1705489 CrossRef PubMed.
- X. Yang, X. Zhuang, Y. Huang, J. Jiang, H. Tian, D. Wu, F. Zhang, Y. Mai and X. Feng, Polym. Chem., 2015, 6, 1088–1095 RSC.
- Z. Lin, H. Tian, F. Xu, X. Yang, Y. Mai and X. Feng, Polym. Chem., 2016, 7, 2092–2098 RSC.
- H. Tian, Z. Lin, F. Xu, J. Zheng, X. Zhuang, Y. Mai and X. Feng, Small, 2016, 12, 3155–3163 CrossRef CAS PubMed.
- W. Zhou, Z. Lin, G. Tong, S. D. Stoyanov, D. Yan, Y. Mai and X. Zhu, RSC Adv., 2016, 6, 111406–111414 RSC.
- T. Chen and L. Dai, J. Mater. Chem. A, 2014, 2, 10756–10775 RSC.
- L. Dai, D. W. Chang, J. B. Baek and W. Lu, Small, 2012, 8, 1130–1166 CrossRef CAS PubMed.
- D. N. Futaba, K. Hata, T. Yamada and T. Hiraoka, Nat. Mater., 2006, 5, 987–994 CrossRef CAS PubMed.
- Y. Wang, Z. Shi, Y. Huang, Y. Ma, C. Wang and M. Chen, J. Phys. Chem. C, 2009, 113, 13103–13107 CrossRef CAS.
- Y. Boyjoo, Y. Cheng, H. Zhong, H. Tian, J. Pan and V. K. Pareek, Carbon, 2017, 116, 490–499 CrossRef CAS.
- C. Falco, J. M. Sieben, N. Brun and M. Sevilla, ChemSusChem, 2013, 6, 374–382 CrossRef CAS PubMed.
- H. Feng, H. Hu, H. Dong, Y. Xiao, Y. Cai and B. Lei, J. Power Sources, 2016, 302, 164–173 CrossRef CAS.
- C. Long, J. Zhuang, Y. Xiao, M. Zheng, H. Hu and H. Dong, J. Power Sources, 2016, 310, 145–153 CrossRef CAS.
- H. Lu and X. S. Zhao, Sustainable Energy Fuels, 2017, 1, 1265–1281 RSC.
- W. Tian, Q. Gao, Y. Tan, K. Yang, L. Zhu and C. Yang, J. Mater. Chem. A, 2015, 3, 5656–5664 RSC.
- H. Peng, G. Ma, K. Sun, Z. Zhang, Q. Yang and Z. Lei, Electrochim. Acta, 2016, 190, 862–871 CrossRef CAS.
- W. Liu, J. Mei, G. Liu, Q. Kou, T. Yi and S. Xiao, ACS Sustainable Chem. Eng., 2018, 6, 11595–11605 CrossRef CAS.
- C. Liang, K. Hong, G. A. Guiochon, J. W. Mays and S. Dai, Angew. Chem., Int. Ed., 2004, 43, 5785–5789 CrossRef CAS PubMed.
- D. W. Wang, F. Li, M. Liu, G. Q. Lu and H. M. Cheng, Angew. Chem., Int. Ed., 2008, 120, 379–382 CrossRef.
- D. He, J. Niu, M. Dou, J. Ji, Y. Huang and F. Wang, Electrochim. Acta, 2017, 238, 310–318 CrossRef CAS.
- Y. Deng, K. Zou and X. Ji, J. Mater. Chem. A, 2016, 4, 1144–1173 RSC.
- B. Wang, Y. Wang, Y. Peng, X. Wang, J. Wang and J. Zhao, J. Power Sources, 2018, 390, 186–196 CrossRef CAS.
- Y. Liu, L. Cao, J. Luo, Y. Peng, Q. Ji, J. Dai, J. Zhu and X. Liu, ACS Sustainable Chem. Eng., 2019, 7, 2763–2773 CrossRef CAS.
- K. Chen, S. Song, F. Liu and D. Xue, Chem. Soc. Rev., 2015, 44, 6230–6257 RSC.
- D. Liu, K. Ni, J. Ye, J. Xie, Y. Zhu and L. Song, Adv. Mater., 2018, 30, 1802104 CrossRef PubMed.
- C. Long, X. Chen, L. Jiang, L. Zhi and Z. Fan, Nano Energy, 2015, 12, 141–151 CrossRef CAS.
- C. Zhao, Y. Huang, C. Zhao, X. Shao and Z. Zhu, Electrochim. Acta, 2018, 291, 287–296 CrossRef CAS.
- G. Zhao, C. Chen, D. Yu, L. Sun, C. Yang and H. Zhang, Nano Energy, 2018, 47, 547–555 CrossRef CAS.
- Y. S. Yun, S. Y. Cho, J. Shim, B. H. Kim and S. J. Chang, Adv. Mater., 2013, 25, 1993–1998 CrossRef CAS PubMed.
- D. Hulicovajurcakova, M. Seredych, G. Q. Lu and T. J. Bandosz, Adv. Funct. Mater., 2009, 19, 438–447 CrossRef CAS.
- H. Liu, H. H. Song, X. Chen, S. Zhang, J. Zhou and Z. Ma, J. Power Sources, 2015, 285, 303–309 CrossRef CAS.
- K. N. Wood, R. O'Hayrea and S. Pylypenko, Energy Environ. Sci., 2014, 7, 1212–1249 RSC.
- D. Hulicova-Jurcakova, M. Seredych, G. Q. Lu and T. J. Bandosz, Adv. Funct. Mater., 2009, 19, 438–447 CrossRef CAS.
- K. Wang, N. Zhao, S. Lei, R. Yan, X. Tian, J. Wang, Y. Song, D. Xu, Q. Guo and L. Liu, Electrochim. Acta, 2015, 166, 1–11 CrossRef CAS.
- Y. Shao, J. Xiao, W. Wang, M. Engelhard, X. Chen, Z. Nie, M. Gu, L. V. Saraf, G. Exarhos and J. G. Zhang, Nano Lett., 2013, 13, 3909–3914 CrossRef CAS PubMed.
- J. Ding, Z. Li, K. Cui, S. Boyer, D. Karpuzov and D. Mitlin, Nano Energy, 2016, 23, 129–137 CrossRef CAS.
- J. Biemolt, I. M. Denekamp, T. K. Slot, G. Rothenberg and D. Eisenberg, ChemSusChem, 2017, 10, 4018–4024 CrossRef CAS PubMed.
- X. Huang, Q. Wang, X. Y. Chen and Z. J. Zhang, Phys. Chem. Chem. Phys., 2016, 18, 10438–10452 RSC.
- Z. Li, L. Cao, P. Qin, X. Liu, Z. Chen, L. Wang, D. Pan and M. Wu, Carbon, 2018, 139, 67–75 CrossRef CAS.
- M. Sevilla and R. Mokaya, Energy Environ. Sci., 2014, 7, 1250–1280 RSC.
- W. Tian, Q. Gao, L. Zhang, C. Yang, Z. Li, Y. Tan, W. Qian and H. Zhang, J. Mater. Chem. A, 2016, 4(22), 8690–8699 RSC.
- A. Janes, L. Permann, M. Arulepp and E. Lust, Electrochem. Commun., 2004, 6, 313–318 CrossRef CAS.
- G. Sun, L. Ma, J. Ran, B. Li, X. Shen and H. Tong, Electrochim. Acta, 2016, 194, 168–178 CrossRef CAS.
- R. Zhang, X. Jing, Y. Chu, L. Wang, W. Kang, D. Wei, H. Li and S. Xiong, J. Mater. Chem. A, 2018, 6, 17730–17739 RSC.
- Y. Gong, D. Li, C. Luo, Q. Fu and C. Pan, Green Chem., 2017, 19, 4132–4140 RSC.
- C. Long, X. Chen, L. Jiang, L. Zhi and Z. Fan, Nano Energy, 2015, 12, 141–151 CrossRef CAS.
- W. Qian, F. Sun, Y. Xu, L. Qiu, C. Liu and S. Wang, Energy Environ. Sci., 2014, 7, 379–386 RSC.
- G. Xu, J. Han, B. Ding, P. Nie, J. Pan and H. Dou, Green Chem., 2015, 17, 1668–1674 RSC.
- Y. Lu, S. Zhang, J. Yin, C. Bai, J. Zhang and Y. Li, Carbon, 2017, 124, 64–71 CrossRef CAS.
- A. Mahto, R. Gupta, K. K. Ghara, D. N. Srivastava and P. Maiti, J. Hazard. Mater., 2017, 340, 189–201 CrossRef CAS PubMed.
- Q. Yao, H. Wang, C. Wang, C. Jin and Q. Sun, ACS Sustainable Chem. Eng., 2018, 6, 4695–4704 CrossRef CAS.
- P. Yu, Z. Zhang, L. Zheng, F. Teng, L. Hu and X. Fang, Adv. Energy Mater., 2016, 6, 1601111 CrossRef.
- Y. Shi, L. Zhang, T. B. Schon, H. Li, C. Fan and X. Li, ACS Appl. Mater. Interfaces, 2017, 9, 42699–42707 CrossRef CAS PubMed.
- F. Gao, G. Shao, J. Qu, S. Lv, Y. Li and M. Wu, Electrochim. Acta, 2015, 155, 201–208 CrossRef CAS.
- M. Wahid, G. Parte, D. Phase and S. Ogale, J. Mater. Chem. A, 2015, 3, 1208–1215 RSC.
- A. Elmouwahidi, E. Bailón-García, A. F. Pérez-Cadenas, F. J. Maldonado-Hódar and F. Carrasco-Marín, Electrochim. Acta, 2017, 229, 219–228 CrossRef CAS.
- L. Sun, C. Tian, M. Li, X. Meng, L. Wang and R. Wang, J. Mater. Chem. A, 2013, 1, 6462–6470 RSC.
- X. Li, W. Xing, S. Zhuo, J. Zhou, F. Li and S. Z. Qiao, Bioresour. Technol., 2011, 102, 1118–1123 CrossRef CAS PubMed.
- W. J. Liu, K. Tian, Y. R. He, H. Jiang and H. Q. Yu, Environ. Sci. Technol., 2014, 48, 13951–13959 CrossRef CAS.
- T. E. Rufford, D. Hulicova-Jurcakova, K. Khosla, Z. Zhu and G. Q. Lu, J. Power Sources, 2010, 195, 912–918 CrossRef CAS.
- F. Gao, J. Qu, Z. Zhao, Z. Wang and J. Qiu, Electrochim. Acta, 2016, 190, 1134–1141 CrossRef CAS.
- J. Li and Q. Wu, Chem. Phys. Lett., 2018, 691, 238–242 CrossRef CAS.
Footnotes |
| † Electronic supplementary information (ESI) available. See DOI: 10.1039/c9ra02184a |
| ‡ The first two authors contributed equally to this work. |
|
| This journal is © The Royal Society of Chemistry 2019 |
Click here to see how this site uses Cookies. View our privacy policy here. 
 Open Access Article
 This Open Access Article is licensed under a Creative Commons Attribution-Non Commercial 3.0 Unported Licence
 ab,
Junyou Shi
ab,
Junyou Shi