
 Open Access Article
 This Open Access Article is licensed under a Creative Commons Attribution-Non Commercial 3.0 Unported Licence
DFT calculation and analysis of the gas sensing mechanism of methoxy propanol on Ag decorated SnO2 (110) surface
Meihua
Li
 *ac,
Huichao
Zhu
b,
Guangfen
Wei
ac,
Aixiang
He
ac and
Yanli
Liu
ac
*ac,
Huichao
Zhu
b,
Guangfen
Wei
ac,
Aixiang
He
ac and
Yanli
Liu
ac
aSchool of Information and Electronic Engineering, Shandong Technology and Business University, Yantai 264005, China. E-mail: limeihua@sdtbu.edu.cn
bSchool of Biomedical Engineering, Dalian University of Technology, Dalian 116024, China
cKey Laboratory of Sensing Technology and Control in Universities of Shandong, Shandong Technology and Business University, Yantai 264005, China
First published on 4th November 2019
Abstract
Methoxy propanol has been widely used in modern industry and consumer products. Inhalation or skin exposure to methoxy propanol for a long period would bring about safety challenges on human habitat and health. Ag decorated SnO2 mesoporous material has been synthesized and shown to exhibit high sensitivity and good selectivity to methoxy propanol among other interferential VOC gases. Density Functional Theory study were conducted to yield insight into the surface–adsorbate interactions and therefore the gas sensing improvement mechanism by presenting accurate energetic and electronic properties for the Ag/SnO2 system. Firstly, an electron transfer model on Ag and SnO2 grain interface was put forward to illustrate the methoxy propanol gas sensing mechanism. Then, a three-layer adsorption model (TLAM) was proposed to investigate methoxy propanol gas sensing properties on a SnO2 (110) surface. In the TLAM method, taking SnO2 (110) surface for the basis, layer 1 illustrates the decoration of metal Ag on SnO2 (110) surface. Layer 2 represents the adsorption of molecular oxygen on metal Ag decorated SnO2 (110) surface. Layer 3 indicates the adsorption of methoxy propanol, and for comparison, three other VOC gases (namely, ethanol, isopropanol and p-xylene) on Ag decorated SnO2 (110) surface with oxygen species pre-adsorbed consecutively. All the adsorption processes were calculated by means of Density Functional Theory method; the adsorption energy, net charge transfer, DOS, PDOS and also experimental data were utilized to investigate the methoxy propanol gas sensing mechanism on Ag decorated SnO2 (110) surface with oxygen species pre-adsorbed.
Introduction
With the extensive industrial applications and natural/anthropogenic emissions of chemical species, volatile organic compounds (VOCs) have become ubiquitous in our environment. Several kinds of VOCs emitted from human life commodities have put forward safety challenges on human habitats and have been reported to have slow yet long term pathogenic effects on human health.1 Propylene glycol ethers, among which methoxy propanol, have been widely used in modern industry and consumer products. It is reported that the content of methoxy propanol is mostly above 50% in paints, inks, solvents, varnishes, hardeners, auxiliary materials and so on.2 Long-term inhalation or skin exposure to methoxy propanol at considerably high concentrations could cause inflammatory changes in healthy subjects' nasal epithelium or impair the mucociliary transport system.3 The MAK value for methoxy propanol has been set as 100 ppm to protect human bodies from its irritating effects;4 in other words, once the concentration of methoxy propanol exceeds 100 ppm, systemic toxicity effects would come into sight.5 Thus, a highly sensitive and selective detection of methoxy propanol becomes very essential to human health and safety, especially for the workers who are exposed at workplaces where this chemical compound is largely used or produced.As a metal oxide semiconductor material with a broad bandgap (Eg = 3.6 eV),6,7 SnO2 has always attracted wide interest in the field of gas sensors due to its good conductivity, thermal stability and surface reactivity. On the one hand, the interaction between a target gas and SnO2 has been widely investigated experimentally:8–12 it has been found that the gas sensing properties of SnO2 mainly depend on its surficial chemical transduction, which involves several stages including the adsorption of the target species and charge transfer between the adsorbate and the sensing material. On the other hand, doping with noble metals is an efficient way to improve the gas sensing properties of pure SnO2, for which Ag is an excellent candidate.13–16 Although it is well known that Ag can improve the gas sensing performance of SnO2, the enhancement mechanism remains unclear. It has been generally ascribed to a catalytic effect; however, the atomic configuration and chemical environment at the material surface, which might have a strong effect on the sensing properties, are hard to characterize, hence posing an essential challenge to the understanding of the gas sensing mechanism of the Ag/SnO2 system.
Density Functional Theory (DFT) studies yield insight into atomic geometries and the nature of chemical bonding, and therefore can provide a valuable tool for understanding surface–adsorbate interactions by presenting their accurate energetic and electronic properties.17–30 However, to the best of our knowledge, DFT calculations and analysis of the methoxy propanol gas sensing performance of a Ag decorated SnO2 (110) surface have rarely been conducted. In one of our previous research,31 a Ag decorated SnO2 mesoporous material has been synthesized through a two-step synthetic route, and subsequently tested for the detection of VOC gases. This Ag-decorated SnO2 mesoporous material showed high sensitivity and good selectivity towards methoxy propanol among other interferential VOC gases.
In this work, an electron transfer model of a Ag and SnO2 grain interface is presented to illustrate the catalytic effect of Ag-doped SnO2 for methoxy propanol gas sensing. Then, a three-layer adsorption model (TLAM) was proposed to investigate the mechanism of the VOC gas sensing performance of the SnO2 (110) surface. In our TLAM method, the decoration of Ag metal on the SnO2 (110) surface was first modelled and optimized in structure. Secondly, molecular oxygen adsorption configurations were proposed and the corresponding DFT calculations on the Ag decorated SnO2 (110) surface were conducted. Thirdly, the adsorption of methoxy propanol, and for comparison, three other VOC gases (namely, ethanol, isopropanol and p-xylene) on the Ag decorated SnO2 (110) surface with pre-adsorbed oxygen species were modelled and calculated consecutively. At last, according to the results from the calculations, the adsorption energy values, net charge transfer, DOS and PDOS were utilized to investigate the methoxy propanol gas sensing properties of the Ag-decorated SnO2 material.
Methoxy propanol gas sensing properties and mechanism on the surface of a Ag decorated SnO2 material
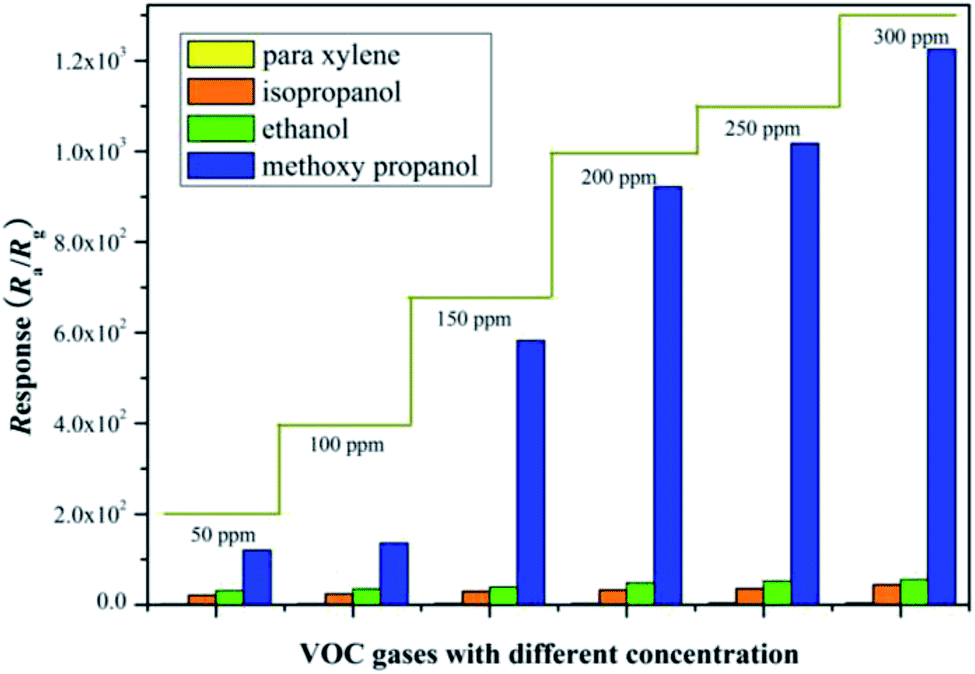
A two-step synthesis route was presented to prepare the Ag decorated SnO2 mesoporous material. Firstly, carbon nanospheres were obtained by hydrothermal synthesis, and then immersed in an absolute ethyl alcohol solution of SnCl4·5H2O. The mixture was centrifuged, washed and calcined to get a pure SnO2 material. Secondly, AgNO3 and ascorbic acid were introduced to implement the decoration of Ag nanoparticles on the porous SnO2 material through a redox reaction. A SEM image of the as-prepared material is shown in Fig. 1(a), where the mesoporous microstructure with a wall thickness of 70 nm, and the decorating Ag nanoparticles with diameters of no more than 100 nm can be easily observed. Fig. 1(b) shows the elemental composition of the prepared material; a weight ratio of 1.62% for the Ag element further confirms the decoration of Ag onto the SnO2 material. Fig. 2 shows the cross response of our Ag decorated SnO2 material towards four typical VOC gases, namely, methoxy propanol, ethanol, isopropanol and p-xylene, with the response being defined as Ra/Rg (Ra represents the sensor resistance in air, Rg represents the sensor resistance in the presence of the target gas). A relatively high response within a wide gas concentration range from 50 ppm to 300 ppm proves a higher detection selectivity for methoxy propanol compared to the other three gases. It can be seen that the response of the Ag/SnO2 material to 100 ppm methoxy propanol is ∼130, and when the concentration increases to 150 ppm, 200 ppm and 250 ppm, the response accordingly increases to ∼580, ∼920 and ∼1000, respectively. These data fully prove the high sensitivity and good selectivity of the Ag/SnO2 material to methoxy propanol, and its potential in the detection of methoxy propanol. More detailed experimental description can be found in the literature.31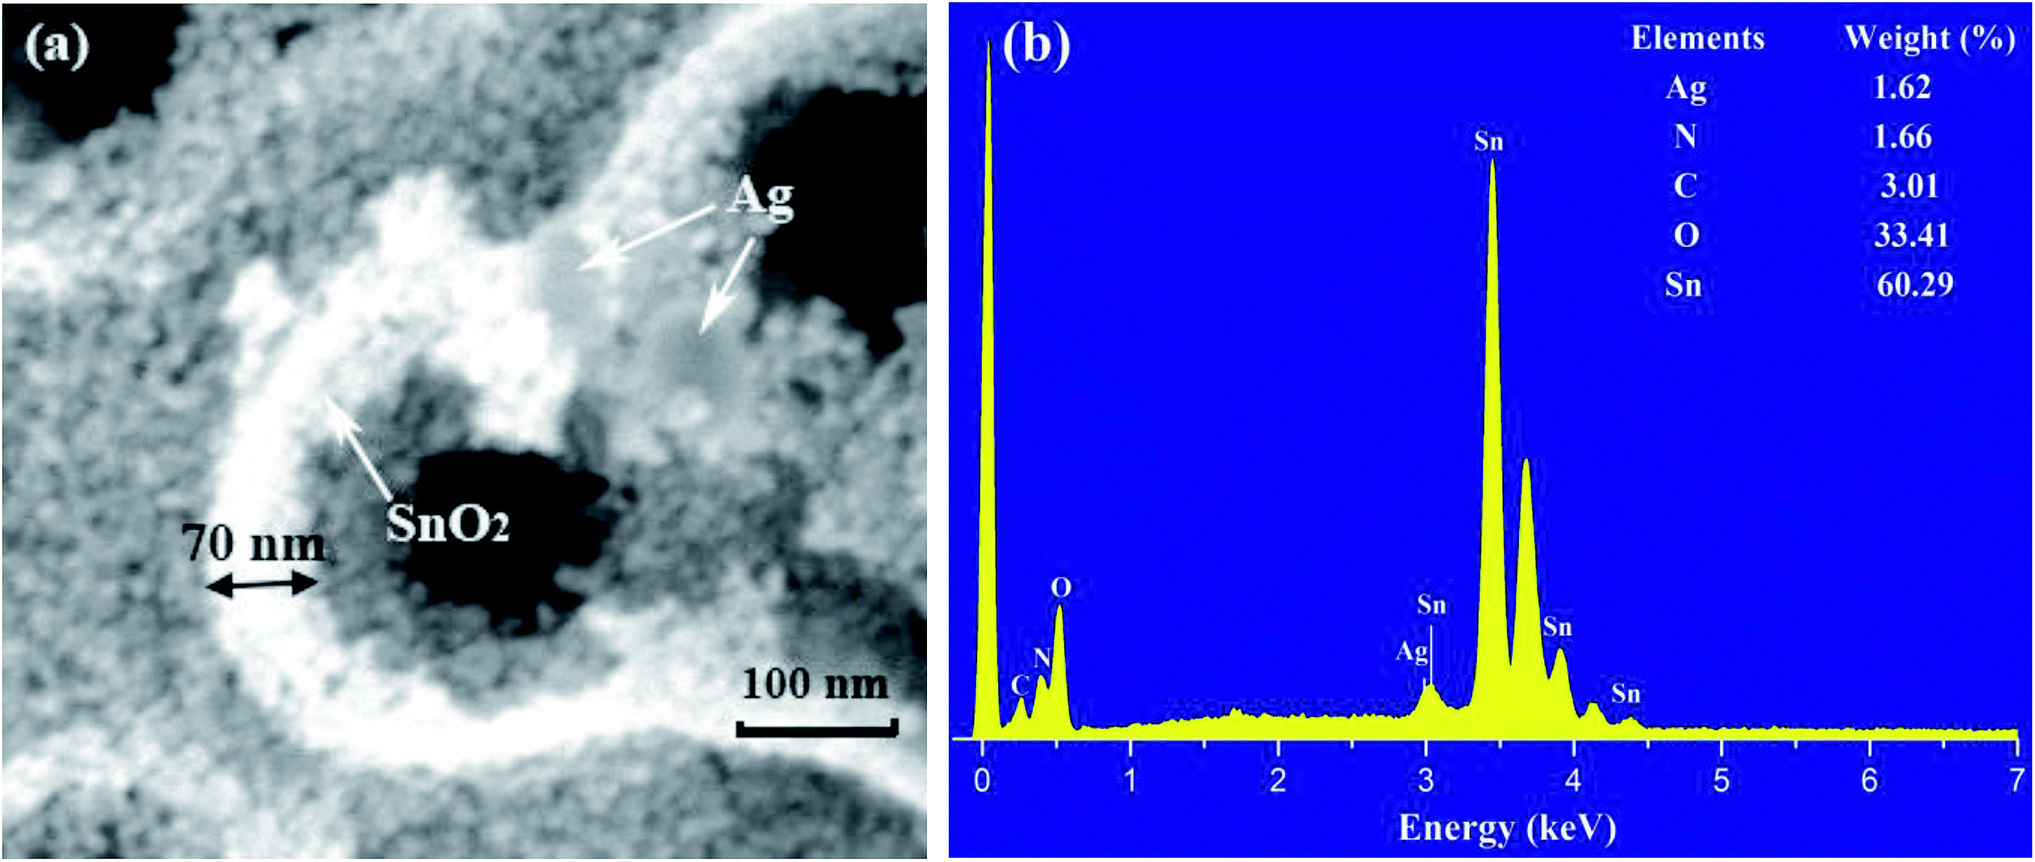 | ||
| Fig. 1 (a) SEM image, (b) EDS spectrum of our Ag decorated SnO2 material. | ||
 | ||
| Fig. 2 Selectivity of the Ag decorated SnO2 material for VOC gases. | ||
It is well known that the gas sensing mechanism of SnO2 is explained by the Surface Resistance Controlling Model. In general, when SnO2 sensors are exposed to air, atmospheric oxygen molecules adsorbed on the material's surface can grab electrons from the conduction band of SnO2 and turn into oxygen species such as O2−, O− or O2−;32–34 therefore, the material's surficial carrier concentration and electron mobility decrease, which results in a relevant increase in its sensor resistance. When reducing gases (methoxy propanol, ethanol, etc.) introduced, they reacted with the ionized oxygen species and released trapped electrons back onto the surface of SnO2. Consequently, the carrier concentration and electron mobility increased again, while the sensor resistance was correspondingly reduced. The larger the difference in the sensor resistance between the two cases, the higher the sensitivity of the gas sensor to a target gas.
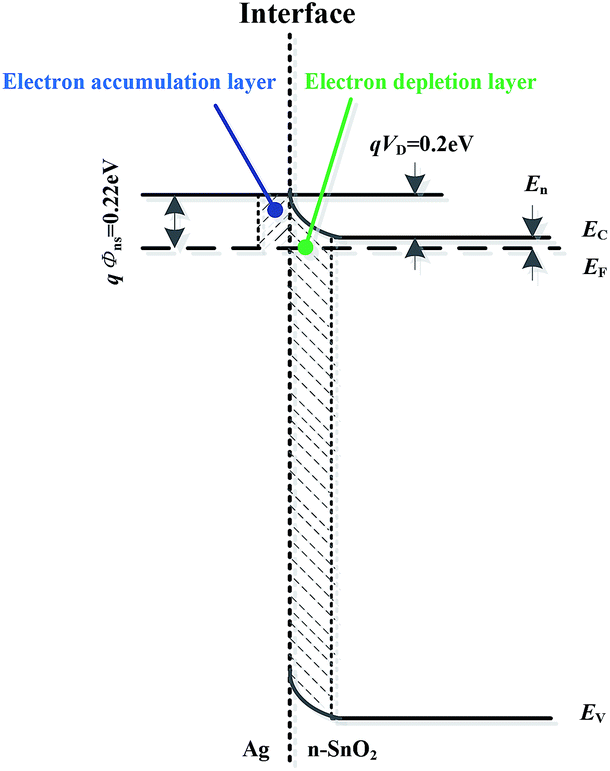
As to Ag decorated SnO2 materials, the spill-over effect of the Ag metal might play a catalytic role to the contribution of electron quantity according to the well-established “chemical sensitization” mechanism.35–38 On the interface of Ag and SnO2 grains, electrons transfer from SnO2 to Ag because the Fermi level of the former is higher than that of the latter. Once this transfer process reaches a kinematic equilibrium state, an electron accumulation layer and an electron depletion layer is generated on each side of the grain boundary, as shown in Fig. 3. The barrier height on the side of SnO2 is
| qVD = W1 − W2 = 0.2 eV | (1) |
| qΦns = qVD + En = W1 − W2 + En = W1−χ = 0.22 eV | (2) |
 | ||
| Fig. 3 Energy band on Ag and SnO2 grain boundary. | ||
This catalytic effect of Ag might further spill electrons on the surface of these materials and promote the ionization of molecular oxygen; so the electrons withdrawn from the Ag/SnO2 composite materials become amplified and much faster than those withdrawn from pure SnO2. Once the material was exposed to methoxy propanol, reactions between methoxy propanol and oxygen species were activated. As the quantity of released electrons after these chemical reactions increased, the sensitivity of Ag/SnO2 composite materials also increased. The typical reactions of methoxy propanol (chemical formula: CH3CHOHCH2OCH3) and ethanol (chemical formula: C2H5OH) with ionized oxygen species are as follows:
| CH3CHOHCH2OCH3 + (13/2) O2− → 4CO2↑ + 5H2O + 13e− | (3) |
| C2H5OH + 3O2− → 2CO2↑ + 3H2O + 6e− | (4) |
It is obvious that as long as there are sufficient adsorbed oxygen species, methoxy propanol will react with them and release more electrons back to the material surface than in the case of ethanol. This might be the main aspect of the superior sensing ability of methoxy propanol.
Theoretical methods and computing platform
Based on the above-mentioned Surface Resistance Controlling Theory applied to our SnO2 gas sensing material, a three-layer adsorption model (TLAM) was proposed to investigate the methoxy propanol gas sensing performance of the SnO2 (110) surface. In our TLAM method, the SnO2 (110) surface is considered the base of the composite; layer 1 refers to the decoration of Ag metal on SnO2, and layer 2 represents the adsorption of molecular oxygen on the Ag metal decorated SnO2 (110) surface. Layer 3 indicates the adsorbed methoxy propanol, and for comparison, three other VOC gases (namely, ethanol, isopropanol and p-xylene) on the Ag decorated SnO2 (110) surface where the oxygen species were pre-adsorbed.In this paper, the DFT method was employed to carry out the calculations. All DFT calculations were implemented through the DMol3 package in the Materials Studio platform.39,40 The exchange and correlation energy calculations were performed by applying the Generalized Gradient Approximation through the Perdew–Burke–Ernzerhof method (GGA-PBE),41 which adopts double numerical basis sets polarization functions (DNP). The applied convergence criteria of optimal geometry were as follows: 1 × 10⁻⁵ Ha (energy), 0.002 Ha·Å−1 (force) and 0.005 Å (displacement). A 3 × 1 × 1 Monkhorst–Pack k-point mesh was utilized for the Brillouin zone sampling and a 3 × 1 × 1 Monkhorst–Pack grid was used to calculate the total energy and density of states (DOS). The Milliken population analysis (MPA)42 method was used to calculate the charge transfer during the gas adsorption process.
Results and discussion
Layer 1 in TLAM method: modelling and optimization of SnO2 (110) surface with Ag decoration
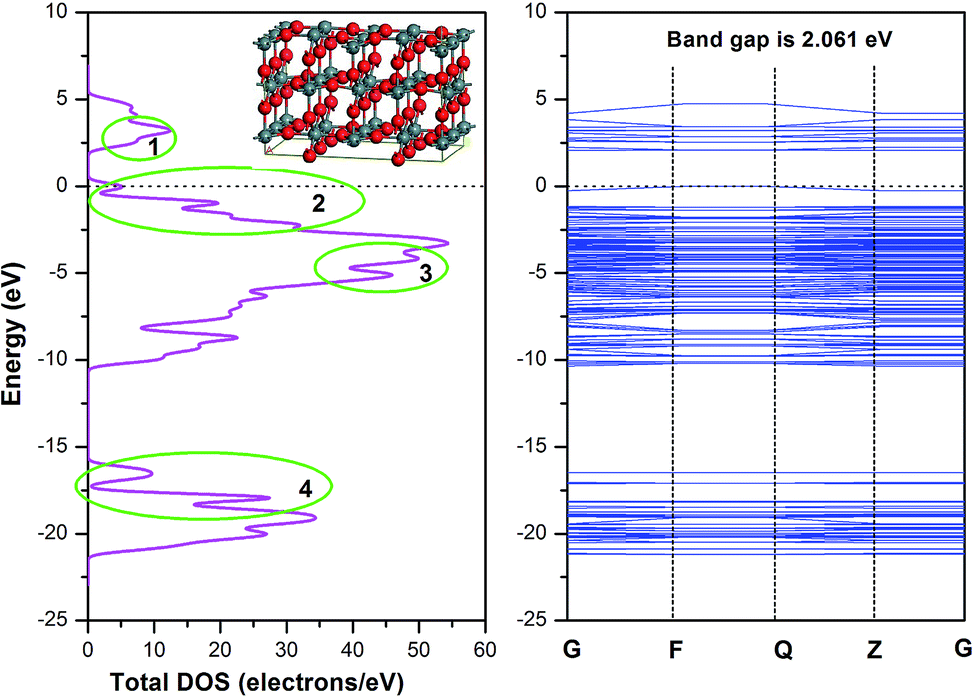
Due to the minimum surface energy, SnO2 (110) is the most thermodynamically stable one among all crystal surfaces of SnO2. In this section, the SnO2 atomic model with tetragonal structure (Pmnm(42)) was firstly built, and then a crystal model with 48 atoms in the super cell was established with lattice constants a = b = 4.73727 Å, c = 3.18638 Å. The DOS (Density of States) spectrogram and band structure of SnO2 super cell are shown in Fig. 4. It could be seen that the bandgap of the SnO2 material is 3.602 eV, which is in line with the experimental data,43,44 and the valence bandwidth of SnO2 is 8.8 eV, coinciding with the experimental evidence.45 As the conduction band bottom and the valence band top are both at the zero point of the Brillouin zone (G point), it could be inferred that the as-built SnO2 model belongs to a direct transition semiconductor.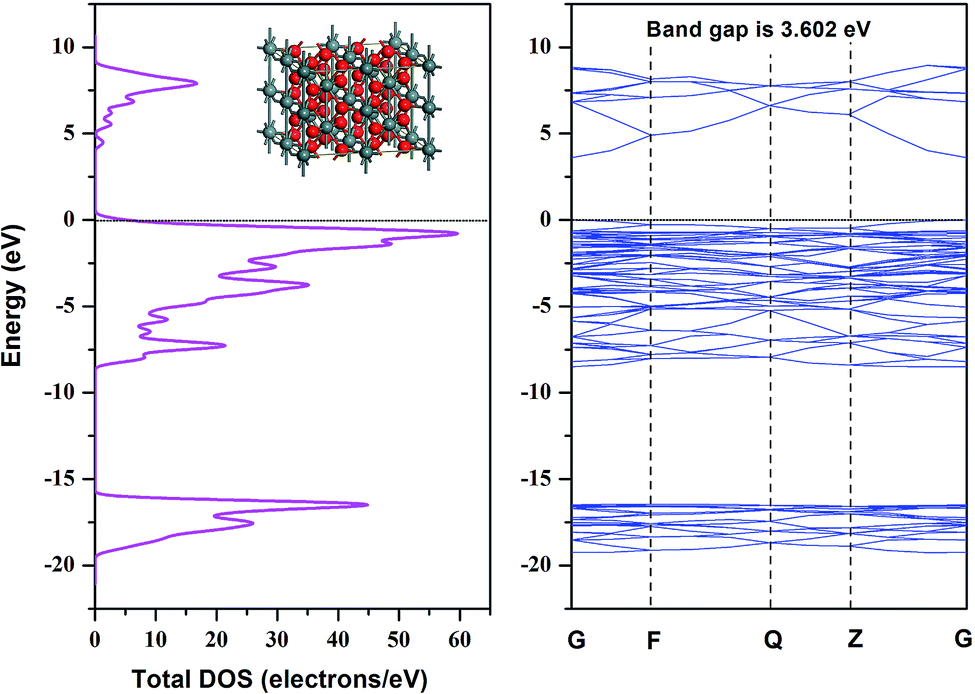 | ||
| Fig. 4 DOS spectrogram and Band Structure of SnO2 super cell with 48 atoms. | ||
The SnO2 (110) surface was cleaved from the as-optimized SnO2 bulk and a vacuum of 12 Å was added to simulate the periodic boundary conditions. The calculated DOS spectrum and band structure of SnO2 (110) surface are shown in Fig. 5. Compared with the bulk material, the band gap of SnO2 (110) was reduced to 2.061 eV, while the valence bandwidth was increased to 10.5 eV. Furthermore, there are four places (labelled as 1–4) where obvious changes could be observed: in place 1, the peak shifted from 7.5 eV to 3 eV; in place 2–4, the DOS curve changed sharply and differentiated into several small peaks.
 | ||
| Fig. 5 DOS spectrogram and Band Structure of SnO2 (110) surface. | ||
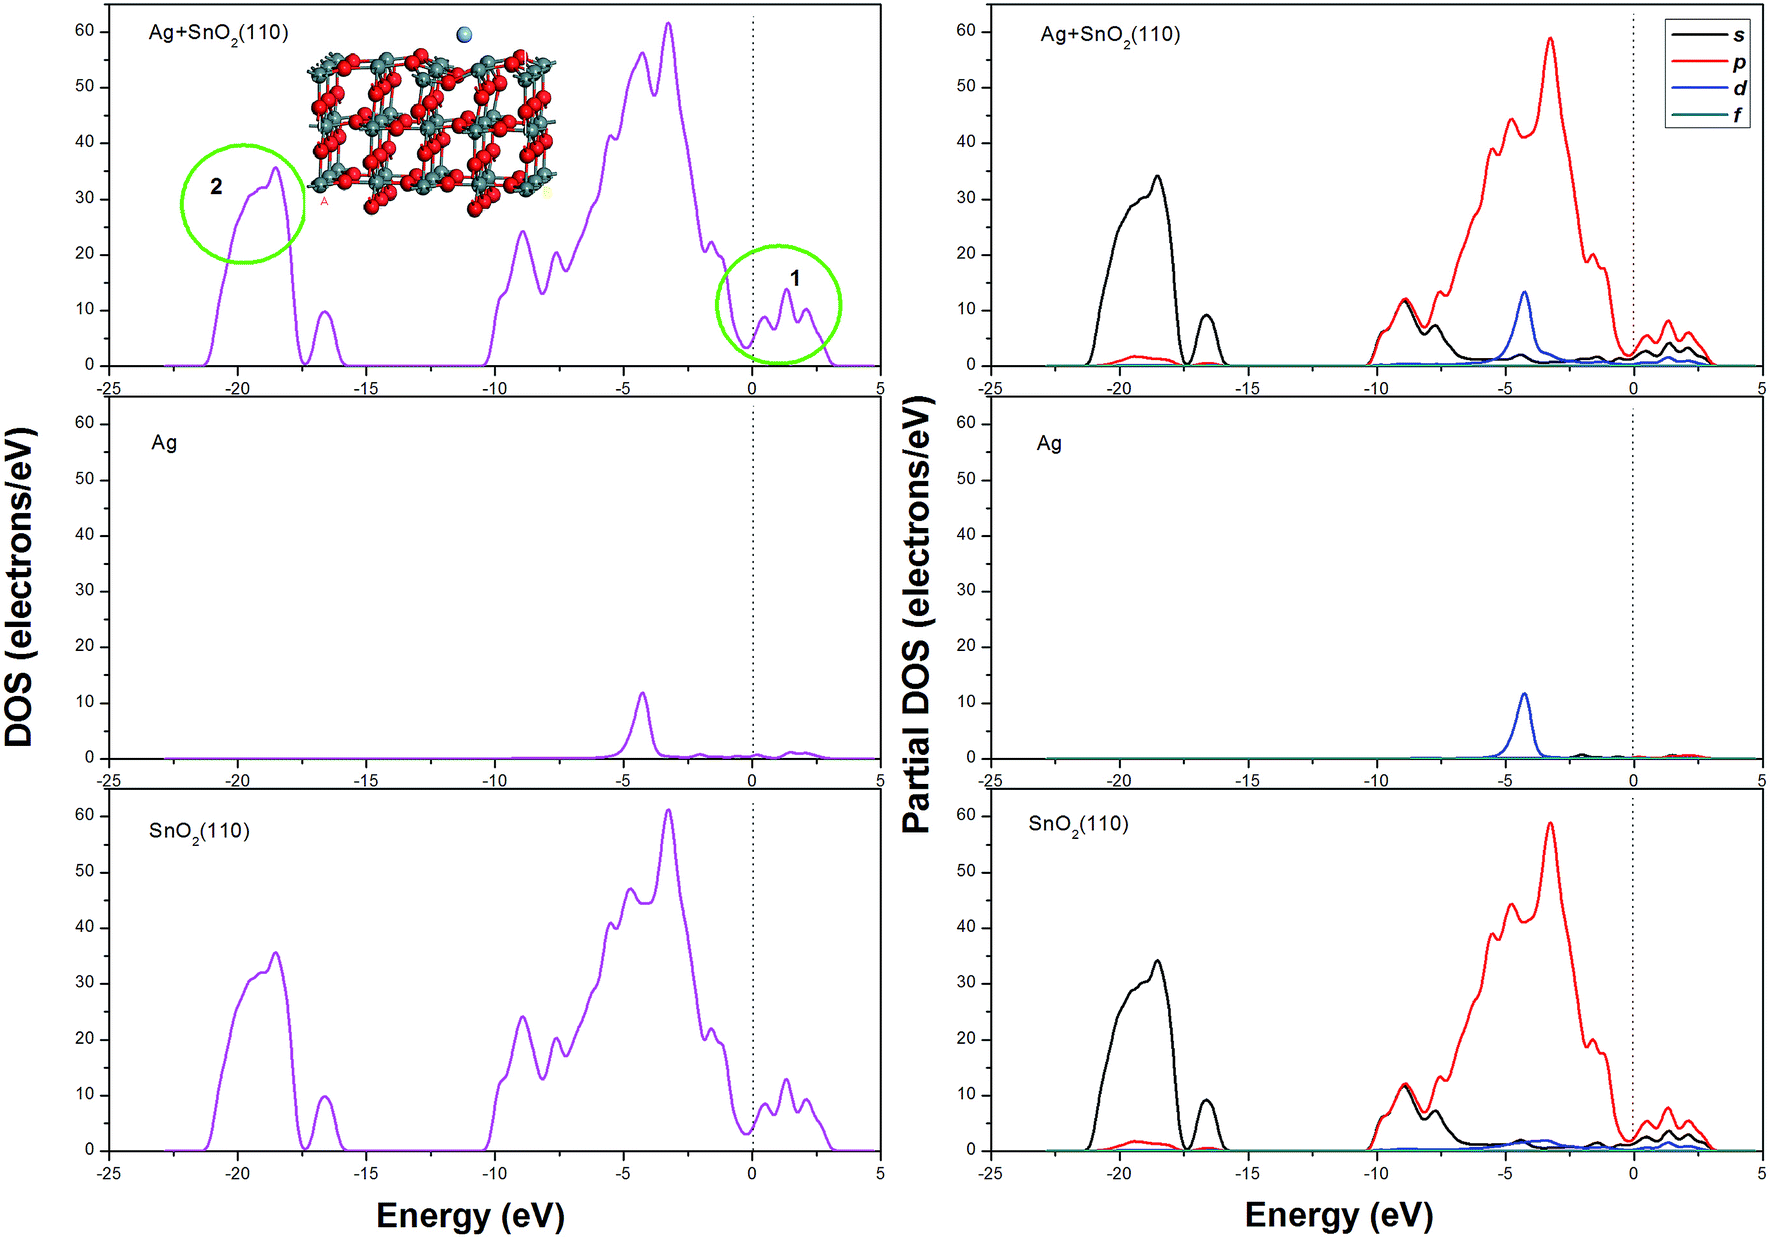
For the decoration of Ag on the SnO2 (110) surface, two kinds of configurations were considered; in one case, Ag atom was above Sn atom and in the other case Ag was above O atom, as shown in Fig. 6(a) and (b), respectively. In each configuration, the structure on the left of the arrow is the case before decoration and the right one is the case after decoration. The total energy of each optimized configurations has the same value of −3538.727 Ha, and the net transfer charge of Ag atom is −0.136e and −0.085e, respectively. The DOS and PDOS spectrum of Ag decorated SnO2 (110) surface are shown in Fig. 7; it is very interesting that the band gap has disappeared and the DOS curve in the conduction has differentiated into three small peaks (labelled as 1), which might imply an enhanced electric conductivity for SnO2 (110) surface to some extent. In addition, in the DOS fragment labelled as 2, the curve became smooth, which might imply that the energy distribution of electrons became gradual. A more detailed PDOS spectrum could be seen showing that this phenomenon was mainly attributed by s and p electrons of SnO2 (110). Comparing the DOS spectrum before and after Ag decoration, it is reasonable to deduce that the catalysis of Ag atom, especially the d electrons in Ag, plays an important role in the electrical conductivity changes of SnO2 (110) surface.
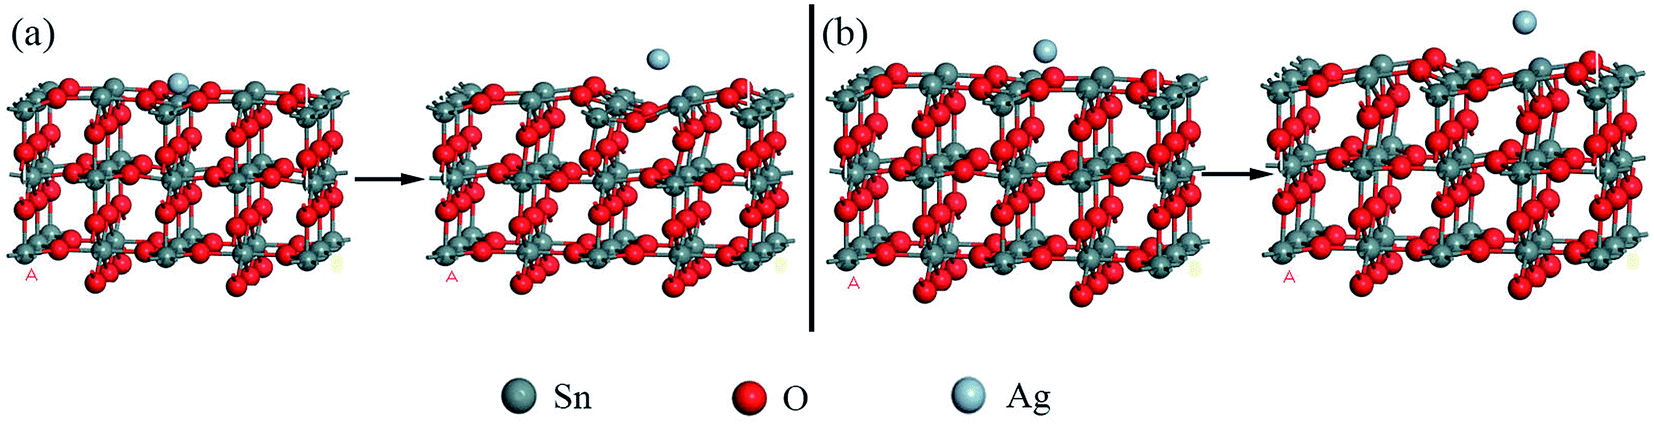 | ||
| Fig. 6 Decoration of Ag on SnO2 (110) surface, (a) Ag is above Sn atom, (b) Ag is above O atom. | ||
 | ||
| Fig. 7 DOS and PDOS spectrogram of Ag decorated SnO2 (110) surface. | ||
Layer 2 in TLAM method: pre-adsorption of molecular oxygen on Ag decorated SnO2 (110) surface
In order to understand the adsorption property of molecular oxygen on Ag decorated SnO2 (110) surface, six kinds of possible adsorption configurations (labelled as Ag-1 to Ag-6 in sequence) was built as shown as Fig. 8. In Ag-1, Ag-2 and Ag-3 configurations, molecular oxygen (O2) was placed respectively perpendicularly to the OA axis, parallelly to the OA axis and parallelly to the OB axis, and all the three configurations take the optimized Ag decorated SnO2 (110) surface as shown in Fig. 6(a) as the adsorptive substrate. In Ag-4, Ag-5 and Ag-6 configurations, molecular O2 was placed respectively perpendicularly to the OA axis, parallelly to the OA axis and parallelly to the OB axis, and all the three configurations take the optimized Ag decorated SnO2 (110) surface as shown in Fig. 6(b) as the adsorptive substrate.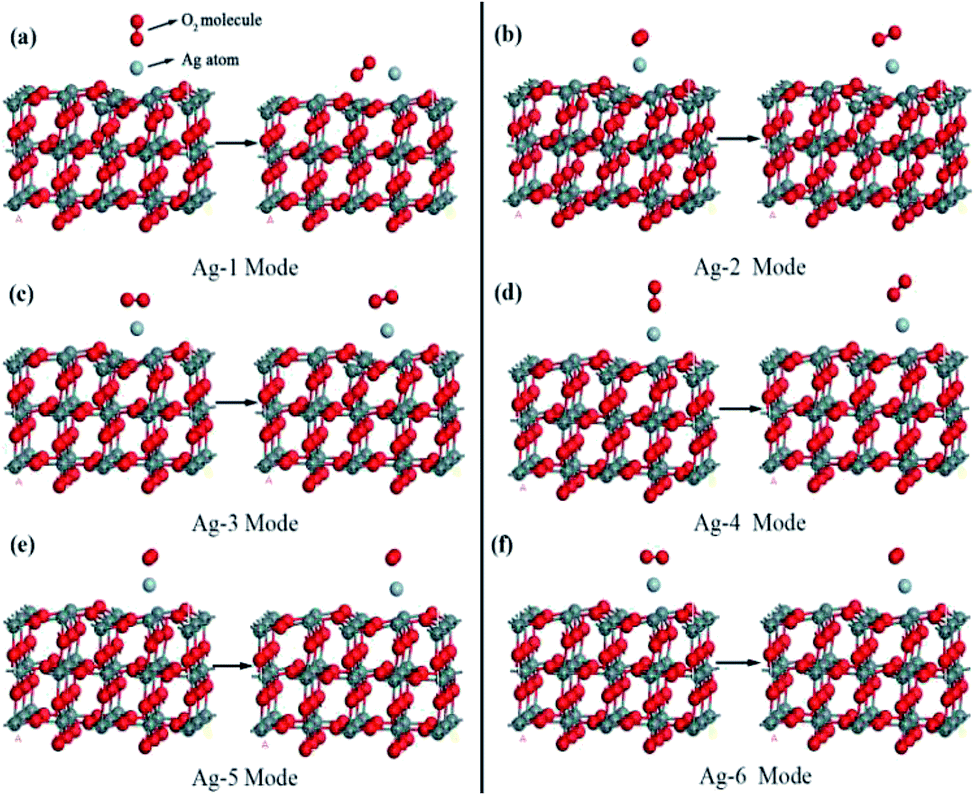 | ||
| Fig. 8 Adsorption of O2 molecule on Ag decorated SnO2 (110) surface. | ||
All calculations of six adsorption configurations have been carried out successively and the results are summarized in Table 1. There into, adsorption energy was adopted to judge the adsorption strength of molecular oxygen, which is defined as follows:46
| Eads = Eadsorbate+surface − Esurface − Eadsorbate | (5) |
| Adsorption configuration | Adsorption energy (eV) | O–O bond length (Å) | Transfer charge of O2 (e) | Transfer charge of Ag atom (e) |
|---|---|---|---|---|
| Ag-1 | −1.63 | 1.345 | −0.468 | 0.032 |
| Ag-2 | −0.98 | 1.309 | −0.304 | −0.043 |
| Ag-3 | −0.98 | 1.309 | −0.304 | −0.047 |
| Ag-4 | −0.98 | 1.279 | −0.253 | 0.016 |
| Ag-5 | −0.98 | 1.319 | −0.332 | 0.060 |
| Ag-6 | −0.98 | 1.320 | −0.336 | 0.058 |
It could be seen from Table 1 that, firstly, the adsorption energies of six configurations are all negative, which means that molecular oxygen could be adsorbed spontaneously on the SnO2 (110) surface. The absolute value of adsorption energy in Ag-1 configuration is the greatest, which means the strongest adsorption strength, and in other words, this kind of adsorption was most likely to take place. Secondly, after adsorption, the O–O band length in oxygen species increased than the original O–O band length (1.226 Å) before adsorption, and among them, the increment of O–O band length in Ag-1 configuration is the greatest. This case proves that the adsorption process would lead to a dissociation tendency of the two O atoms in oxygen species. Thirdly, oxygen species had negative net transfer charges in all adsorption configurations; Ag had negative charge in Ag-2 and Ag-3 configurations, while the polarity of transfer charge in Ag-1, Ag-4, Ag-5 and Ag-6 configurations were positive.
Taking Ag-1 configuration for example, a three-dimensional (3D) plot of deformation charge density is shown in Fig. 9, where the blue regions represent electron trapping and yellow regions correspond to electron releasing; specifically, the transferred charge of O2 molecule is −0.468e, while that of Ag atom is 0.032e. The DOS and PDOS spectra after O2 adsorption for Ag-1 configuration are shown in Fig. 10; it is obvious that a small DOS peak in the range of −15 to −13 eV (as labelled 1) attributed by O2 appeared, in places labelled as 2 and 3; the DOS value both increased, which implied the increase of electron energy and chemical activity in turn.
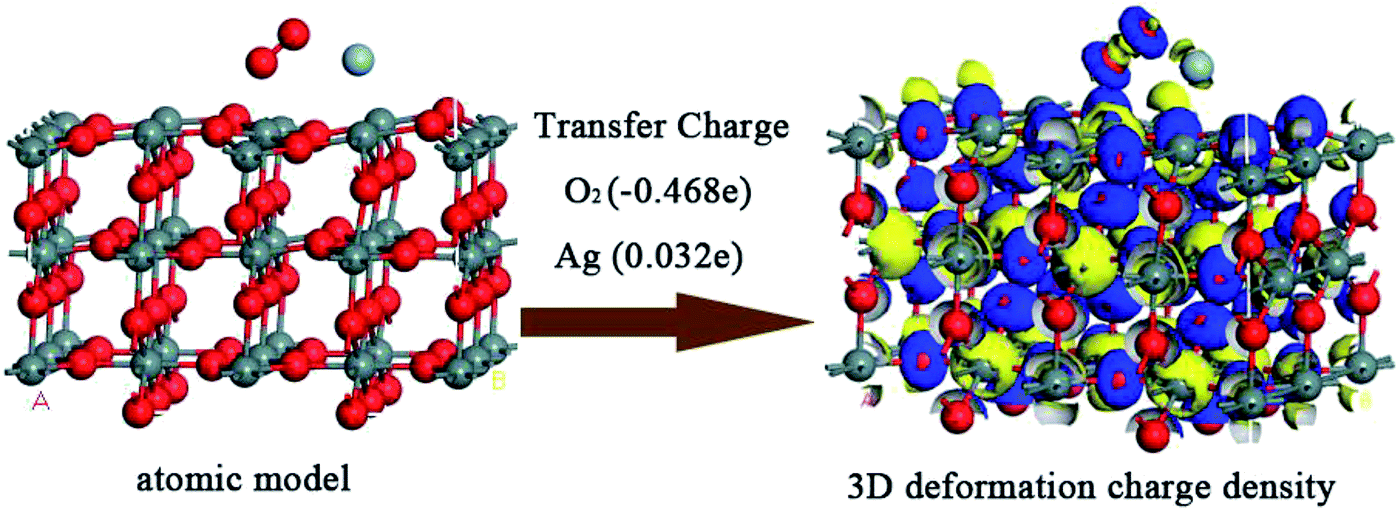 | ||
| Fig. 9 3D deformation charge density of oxygen species pre-adsorbed and Ag decorated SnO2 (110) surface in Ag-1 configuration. | ||
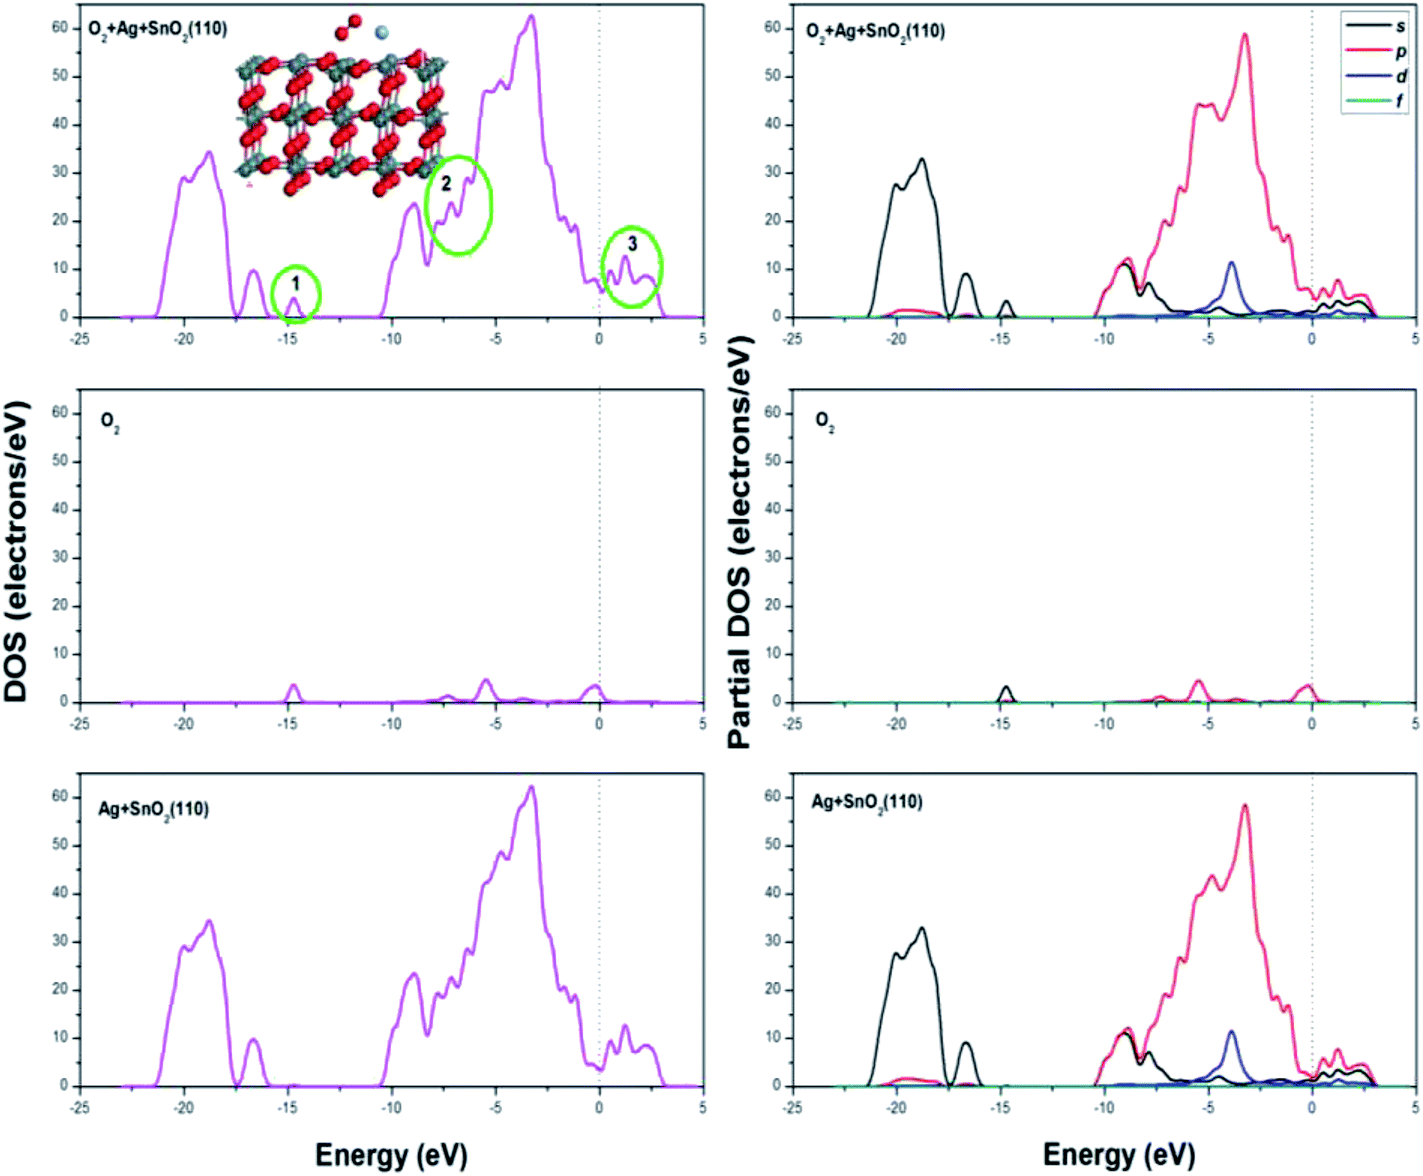 | ||
| Fig. 10 DOS and PDOS spectrogram after O2 adsorption on Ag decorated SnO2 (110) surface. | ||
In short, in Ag-1 configuration, the adsorption of molecular oxygen on the SnO2 (110) surface would be the strongest and molecular oxygen would capture the maximum electrons from the material surface. Additionally, it is obvious that oxygen species moved closer to the SnO2 (110) surface in Ag-1 configuration, while in the other five configurations, oxygen species moved farther from the surface or showed almost no change, which implies more adsorption easiness in Ag-1 configuration. So, in the subsequent research, the oxygen species adsorbed surface in Ag-1 configuration would be taken as the adsorption substrate for the upcoming target gases.
Layer 3 in TLAM method: adsorption of methoxy propanol on Ag metal decorated SnO2 (110) surface with oxygen species pre-adsorbed
According to the traditional sensing theory, the chemical reaction between the target gas and pre-adsorbed oxygen species would cause the conductivity change through an electron exchange mechanism. In order to study the high sensitivity and good selectivity of the Ag metal decorated SnO2 material to methoxy propanol, three more kinds of VOC gases (also widespread in our life) were configurated for comparison, namely, ethanol, isopropanol and p-xylene. Molecular structures of the abovementioned VOC gases are shown in Fig. 11.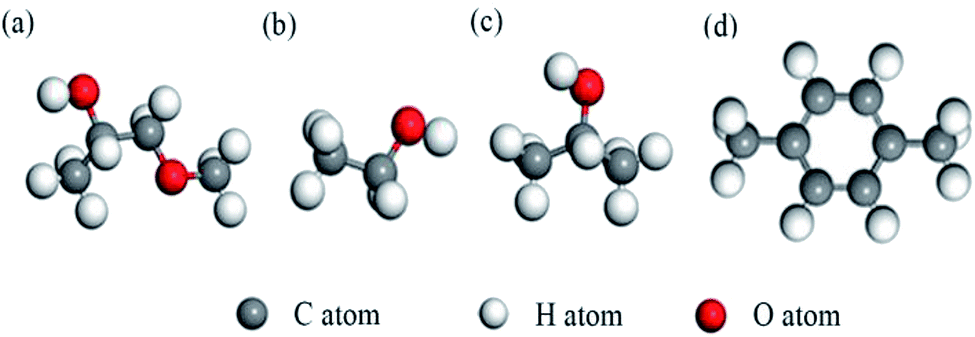 | ||
| Fig. 11 Configurated molecular structure of methoxy propanol, ethanol, isopropanol and p-xylene. | ||
For each VOC gas, two typical adsorption configurations on Ag metal decorated SnO2 (110) surface with oxygen species pre-adsorbed were simulated, namely, vertical configuration (gas molecule was placed vertically) and parallel configuration (gas molecule was placed parallelly). The two adsorption configurations of methoxy propanol on SnO2 (110) surface are shown in Fig. 12 and the case of the other three gases are similar.
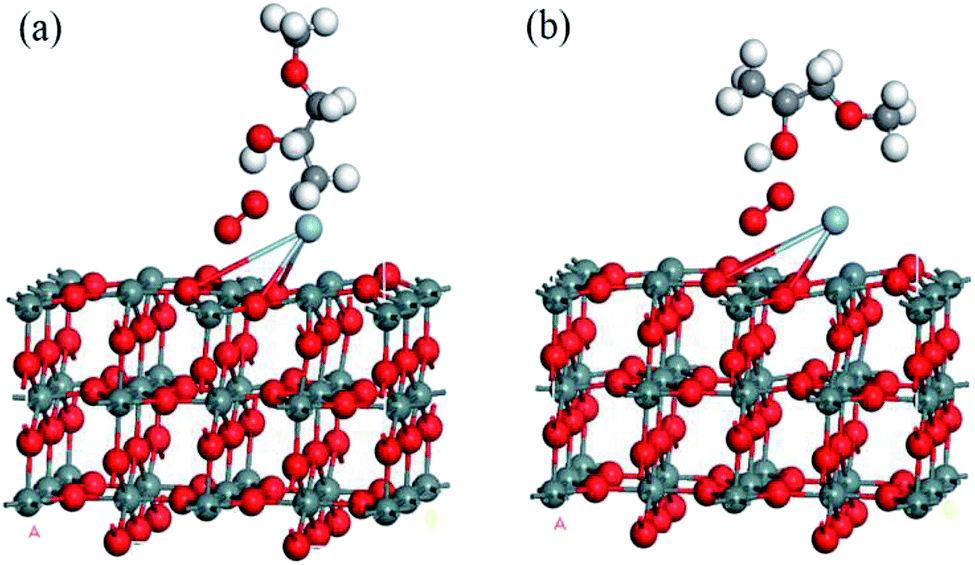 | ||
| Fig. 12 Vertical and parallel adsorption configurations on oxygen species pre-adsorbed and Ag decorated SnO2 (110) surface of methoxy propanol. | ||
The adsorption energy of four kinds of VOC gases on Ag metal decorated SnO2 (110) surface with oxygen species pre-adsorbed were calculated and the results are summarized in Table 2. It could be seen that the absolute value of adsorption energy for methoxy propanol is the largest in the vertical configuration, parallel configuration or the average value, which implies that the adsorption strength of methoxy propanol on SnO2 (110) surface is the strongest.
| Adsorption energy (eV) | Target VOC gases | |||
|---|---|---|---|---|
| Methoxy propanol | Ethanol | Isopropanol | p-Xylene | |
| Vertical | −2.231 | −1.170 | −1.932 | −1.960 |
| Parallel | −3.184 | −1.823 | −0.707 | −1.850 |
| Average value | −2.708 | −1.497 | −1.320 | −1.905 |
Transfer charge of different gases on Ag metal decorated SnO2 (110) surface with oxygen species pre-adsorbed are summarized in Table 3. Compared with the data in Table 1, the negative charge of oxygen species pre-adsorbed in all cases increased after gas adsorption, which states that pre-adsorbed oxygen species obtained more charges. On the other hand, all the four gases lost electrons in every adsorption configuration and the charge transferred from methoxy propanol is the maximum.
| Transfer charge (e) | Methoxy propanol | Ethanol | Isopropanol | p-Xylene | ||||
|---|---|---|---|---|---|---|---|---|
| Vertical | Parallel | Vertical | Parallel | Vertical | Parallel | Vertical | Parallel | |
| Oxygen | −0.727 | −0.867 | −0.624 | −0.812 | −0.805 | −0.677 | −0.748 | −0.583 |
| Gases | 0.160 | 0.240 | 0.150 | 0.201 | 0.175 | 0.073 | 0.363 | 0.323 |
The DOS and PDOS spectrogram for the adsorption of methoxy propanol are shown in Fig. 13; it could be seen that three more peaks could be found in the energy range of −13 to −11 eV (labelled as 1), which was attributed by the adsorbate of methoxy propanol; the DOS value increased in the place labelled as 2. The changes in DOS and PDOS would further account for the increase in the electron energy and hence a better electrical conductivity.
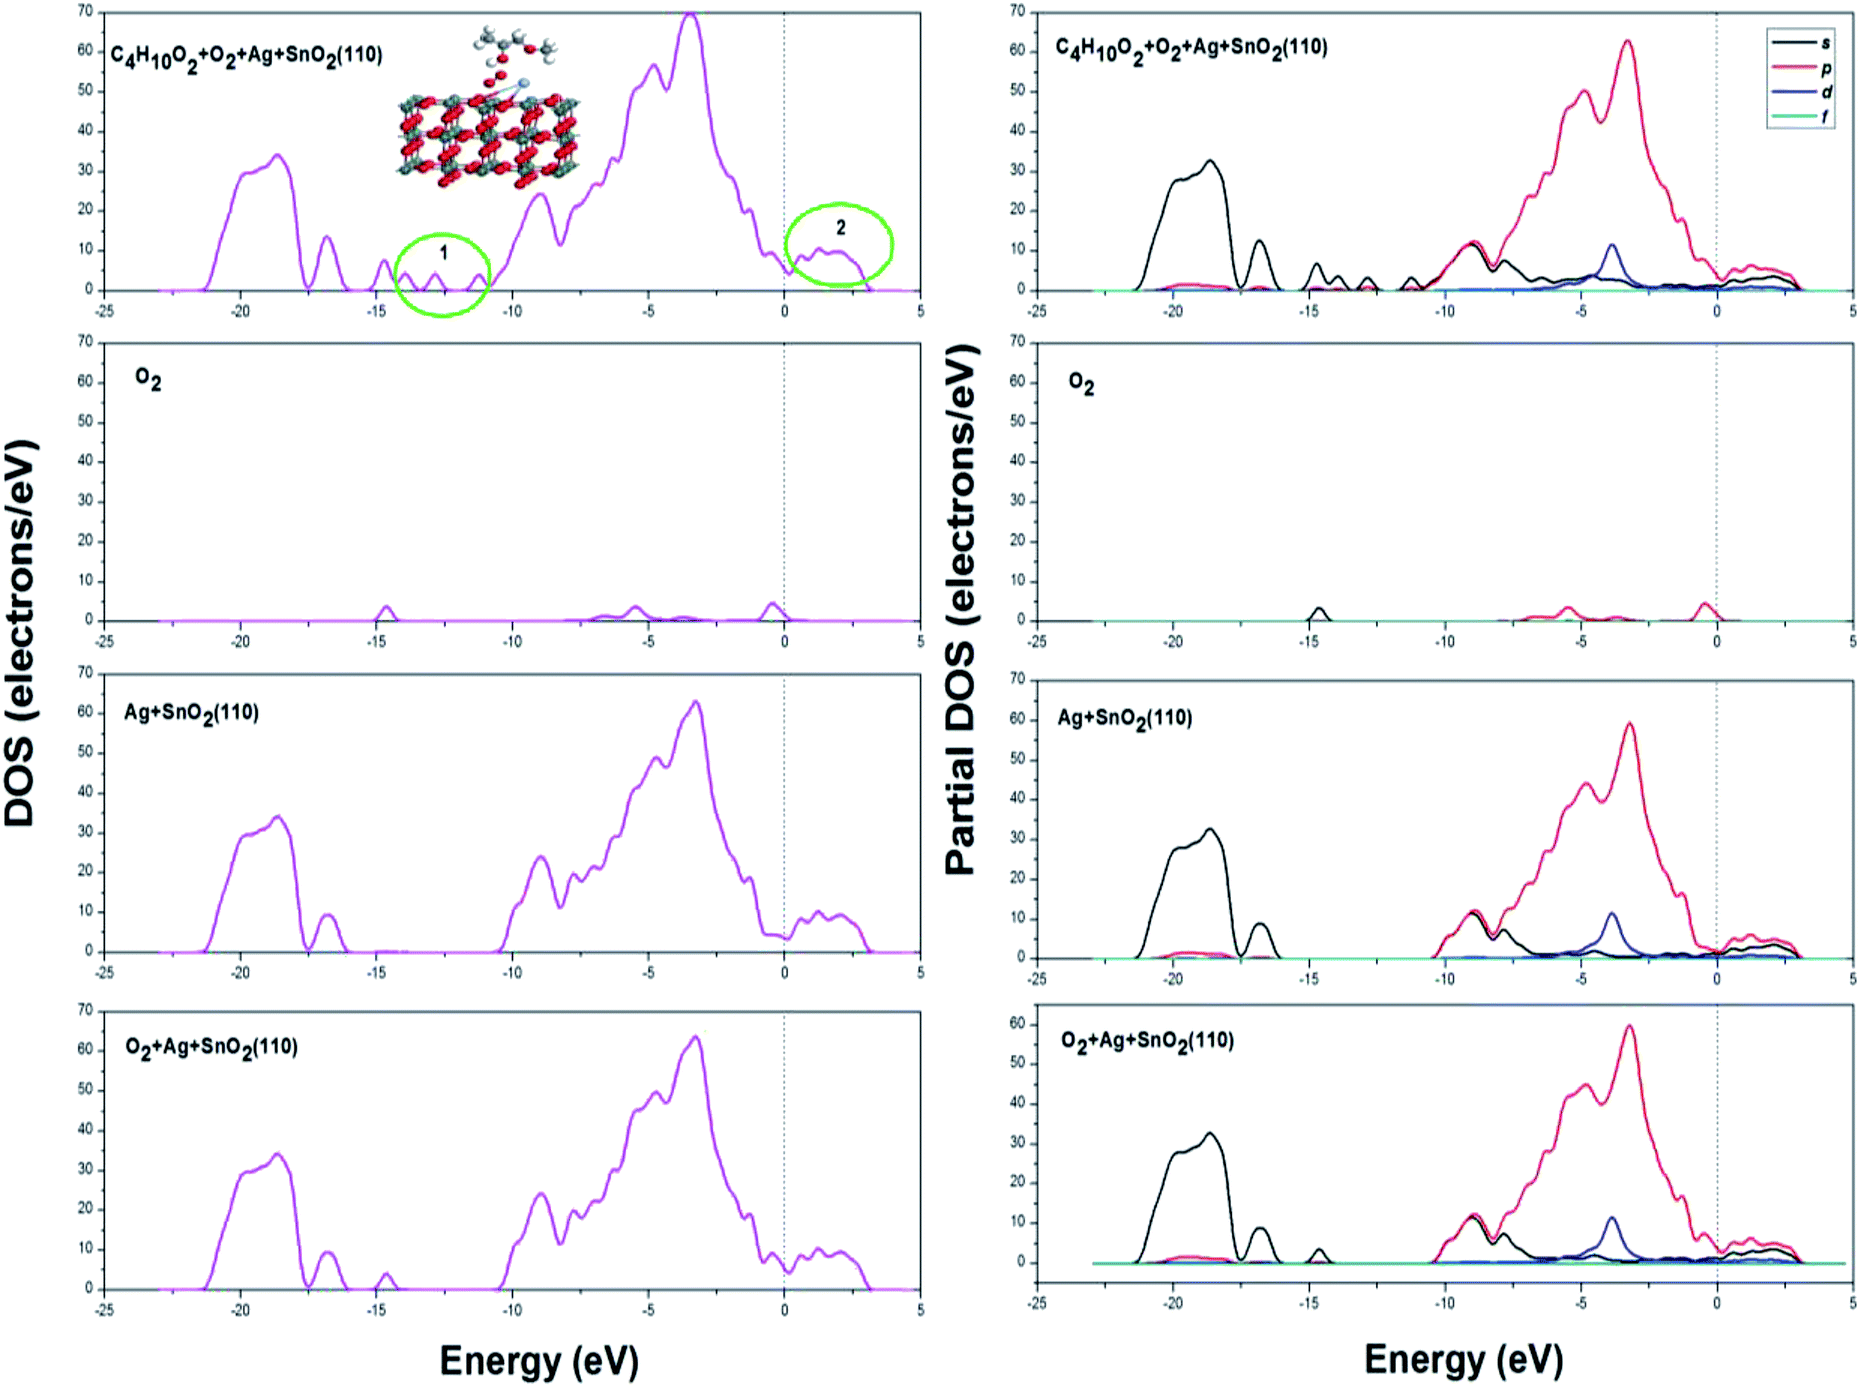 | ||
| Fig. 13 DOS and PDOS spectrogram after methoxy propanol (C4H10O2) adsorption on Ag decorated SnO2 (110) surface with oxygen species pre-adsorbed. | ||
In brief, when methoxy propanol was adsorbed on Ag metal decorated SnO2 (110) surface with oxygen species pre-adsorbed, the adsorption energy and transfer charge are both the maximum, which implies the strongest adsorption, chemical reaction and therefore the influence on the conductivity of adsorption surface during the adsorption of methoxy propanol gas.
Conclusions
In summary, based on Surface Resistance Controlling Theory of SnO2 gas sensing material, firstly, an electron transfer model on Ag and SnO2 grain interface was put forward to illustrate the methoxy propanol gas sensing mechanism. Then, a three-layer adsorption model (TLAM) was proposed to investigate the VOC gas sensing mechanism on Ag decorated SnO2 (110) surface. The calculation results of layer 1 showed that Ag atom indeed gained negative charges and therefore accumulated more electrons on the surface of Ag metal decorated SnO2 materials than the case of pure SnO2, which was in good line with the catalytic effect, as mentioned in this paper. In contrast, Ag atom could get more charge from the SnO2 (110) surface when decorated above Sn atom than above O atom. The results of layer 2 showed that the adsorption of molecular oxygen on Ag metal decorated SnO2 (110) surface was the strongest; molecular oxygen captured the maximum electrons from the material surface when molecular O2 was above the Ag atom perpendicular to the OA axis. In layer 3 of TLAM, for comparison, three more gases (ethanol, isopropanol and p-xylene) were configurated to study the high sensitivity and good selectivity of Ag metal decorated SnO2 material to methoxy propanol. The results show that the adsorption energy and transfer charge of methoxy propanol are both the maximum among the target gases, which implies the strongest adsorption, chemical reaction and the influence on the conductivity of adsorption surface, and therefore provides more theoretical evidences for high sensitivity and good selectivity of Ag metal decorated SnO2 materials to methoxy propanol.Conflicts of interest
There are no conflicts to declare.Acknowledgements
The authors thank Key Research and Development Projects of Yantai (2018XSCC033, 2016ZH053, 2017ZH064); PhD Start-up Fund of Shandong Technology and Business University (BS201810, BS201811); National Natural Science Foundation of China (61804089, 61174007); Natural Science Foundation of Shandong Province (ZR2019MF069); Project of Shandong Province Higher Educational Science and Technology Program (J18KA325, J16LN04) for financial support.References
- K. Andersson, J. V. Bakke and O. Bjørseth, Indoor Air, 1997, 7, 78 CrossRef CAS.
- A. Dentan, A. Devanthéry and J. E. de Peyer, Int. Arch. Occup. Environ. Health, 2000, 73, 349 CrossRef CAS.
- A. Muttray, J. Gosepath and J. Brieger, Toxicol. Lett., 2013, 220, 187 CrossRef CAS.
- Deutsche Forschungsgemeinschaft, The MAK Collection for Occupational Health and Safety, Wiley-VCH, Weinheim, 1998 Search PubMed.
- J. Brieger, A. Muttray and D. Jung, Toxicol. Lett., 2008, 177(2), 138 CrossRef CAS.
- V. Heinrich, P. S. Cui, H. Pu and E. C. Mattson, Nanoscale, 2012, 4, 5887 RSC , http://med.wanfangdata.com.cn/Paper/Detail/PeriodicalPaper_PM22899322.
- M. Batzill and U. Diebold, The surface and materials science of tin oxide, Prog. Surf. Sci., 2005, 79, 47 CrossRef CAS.
- X. C. Ma, H. Y. Song and C. S. Guan, Sens. Actuators, B, 2013, 177, 196 CrossRef CAS.
- F. Gyger, M. Hübner and C. Feldmann, Chem. Mater., 2010, 22, 4821 CrossRef CAS.
- D. Ju, H. Xu and X. Qi, Sens. Actuators, B, 2015, 215, 39 CrossRef CAS.
- M. Li, W. Yan and H. Zhu, RSC Adv., 2015, 5, 51953 RSC.
- L. Liu, C. Guo and S. Li, Sens. Actuators, B, 2010, 150, 806 CrossRef CAS.
- J. Aguilar-Leyva, A. Maldonado and M. de la L. Olvera, Mater. Charact., 2007, 58, 740 CrossRef CAS.
- Y. V. Kaneti, J. Yue and J. Moriceau, Sens. Actuators, B, 2015, 219, 83 CrossRef CAS.
- T. T. Wang, S. Y. Ma and L. Cheng, Sens. Actuators, B, 2015, 216, 212 CrossRef CAS.
- L. Mädler, T. Sahm and A. Gurlo, J. Nanopart. Res., 2006, 8, 783 CrossRef.
- J. Oviedo and M. J. Gillan, Surf. Sci., 2001, 490, 221 CrossRef CAS.
- F. R. Sensato, R. Custódio and M. Calatayud, Surf. Sci., 2002, 511, 408 CrossRef CAS.
- Y. B. Xue and Z. A. Tang, Sens. Actuators, B, 2007, 20, 2364 CAS.
- A. V. Bandura, J. D. Kubicki and J. O. Sofo, J. Phys. Chem. B, 2008, 112, 11616 CrossRef CAS PubMed.
- J. B. L. Martins, E. Longo and J. Andres, J. Mol. Struct.: THEOCHEM, 1995, 335, 167 CrossRef CAS.
- M. MelleFranco and G. Pacchioni, Surf. Sci., 2000, 461, 54 CrossRef CAS.
- F. Ciriaco, L. Cassidei and G. Petrella, Chem. Phys., 2004, 303, 55 CrossRef CAS.
- Y. B. Xue and Z. A. Tang, Sens. Actuators, B, 2009, 138, 108 CrossRef CAS.
- J. D. Prades, A. Cirera and J. R. Morante, Sens. Actuators, B, 2007, 126, 62 CrossRef CAS.
- G. Xu, L. Zhang and C. He, Sens. Actuators, B, 2015, 221, 717 CrossRef CAS.
- M. Calatayud, J. Andrés and A. Beltrán, Surf. Sci., 1999, 430, 213 CrossRef CAS.
- J. Yue, X. C. Jiang and A. B. Yu, J. Phys. Chem. C, 2013, 117, 9962 CrossRef CAS.
- W. Zhao, F. H. Tian and X. Wang, J. Colloid Interface Sci., 2014, 430, 18 CrossRef CAS.
- F. H. Tian, C. Gong and Y. Peng, Sens. Actuators, B, 2017, 244, 655 CrossRef CAS.
- M. Li, H. Zhu and B. Wang, Sens. Actuators, B, 2016, 232, 545 CrossRef CAS.
- D. Williams, Sens. Actuators, B, 1999, 57, 1 CrossRef CAS.
- N. Bârsan, M. Schweizer-Berberich and W. Göpel, Fresenius. J. Anal. Chem., 1999, 365, 287 CrossRef.
- W. Göpel and K. D. Schierbaum, Sens. Actuators, B, 1995, 26, 1 CrossRef.
- S. Cui, H. Pu and E. C. Mattson, Nanoscale, 2012, 4, 5887 RSC , http://med.wanfangdata.com.cn/Paper/Detail/PeriodicalPaper_PM22899322.
- I. S. Hwang, J. K. Choi and H. S. Woo, ACS Appl. Mater. Interfaces, 2011, 3, 3140 CrossRef CAS.
- H. Wang, Q. Liang and W. Wang, Cryst. Growth Des., 2011, 11, 2942 CrossRef CAS.
- S. Liu, M. Xie and Y. Li, Sens. Actuators, B, 2010, 151, 229 CrossRef CAS.
- B. Delley, J. Chem. Phys., 2000, 113, 7756 CrossRef CAS.
- B. Delley, J. Chem. Phys., 1990, 92, 508 CrossRef CAS.
- J. P. Perdew, K. Burke and M. Ernzerhof, Phys. Rev. Lett., 1996, 77, 3865 CrossRef CAS.
- R. S. Mulliken, Chem. Phys., 1955, 23(12), 1833 CAS.
- B. Cheng, J. M. Russell and W. S. Shi, J. Am. Chem. Soc., 2004, 126(19), 5972 CrossRef CAS.
- D. F. Zhang, L. D. Sun and J. L. Yin, Adv. Mater., 2003, 15(12), 1022 CrossRef CAS.
- J. M. Themlin, M. Chtaïb and L. Henrard, Phys. Rev. B: Condens. Matter Mater. Phys., 1992, 46(4), 2460 CrossRef CAS.
- J. Goniakowski and M. J. Gillan, Surf. Sci., 1996, 350, 145 CrossRef CAS.
- M. Viitala, O. Cramariuc and B. Delley, Surf. Sci., 2011, 605, 1563 CrossRef CAS.
- W. Zeng, T. Liu and D. Liu, Phys. B, 2010, 405, 4235 CrossRef CAS.
| This journal is © The Royal Society of Chemistry 2019 |