 Open Access Article
Inorganic carbonate composites as potential high temperature CO2 sorbents with enhanced cycle stability†
Maria Vall,
Jonas Hultberg,
Maria Strømme* and
Ocean Cheung *
*
Nanotechnology and Functional Materials Division, Department of Engineering Sciences, The Ångström Laboratory, Uppsala University, Box 534, SE-751 21 Uppsala, Sweden. E-mail: ocean.cheung@angstrom.uu.se
First published on 28th June 2019
Abstract
A calcium magnesium carbonate composite (CMC) material containing highly porous amorphous calcium carbonate (HPACC) and mesoporous magnesium carbonate (MMC) was synthesized. CMCs with varying HPACC![[thin space (1/6-em)]](https://www.rsc.org/images/entities/char_2009.gif) :
:![[thin space (1/6-em)]](https://www.rsc.org/images/entities/char_2009.gif) MMC mol ratios and high BET surface area (over 490 m2 g−1) were produced. The CMCs retained the morphology shared by HPACC and MMC. All these materials were built up of aggregated nanometer-sized particles. We tested the CO2 uptake properties of the synthesized materials. The CMCs were calcined at 850 °C to obtain the corresponding calcium magnesium oxide composites (CMOs) that contained CaO
MMC mol ratios and high BET surface area (over 490 m2 g−1) were produced. The CMCs retained the morphology shared by HPACC and MMC. All these materials were built up of aggregated nanometer-sized particles. We tested the CO2 uptake properties of the synthesized materials. The CMCs were calcined at 850 °C to obtain the corresponding calcium magnesium oxide composites (CMOs) that contained CaO![[thin space (1/6-em)]](https://www.rsc.org/images/entities/char_2009.gif) :
:![[thin space (1/6-em)]](https://www.rsc.org/images/entities/char_2009.gif) MgO at different mol ratios. CMO with CaO
MgO at different mol ratios. CMO with CaO![[thin space (1/6-em)]](https://www.rsc.org/images/entities/char_2009.gif) :
:![[thin space (1/6-em)]](https://www.rsc.org/images/entities/char_2009.gif) MgO = 3
MgO = 3![[thin space (1/6-em)]](https://www.rsc.org/images/entities/char_2009.gif) :
:![[thin space (1/6-em)]](https://www.rsc.org/images/entities/char_2009.gif) 1 (CMO-3) showed comparable CO2 uptake at 650 °C (0.586 g g−1) to CaO sorbents obtained from pure HPACC (0.658 g g−1) and the commercial CaCO3 (0.562 g g−1). Over 23 adsorption–desorption cycles CMOs also showed a lower CO2 uptake capacity loss (35.7%) than CaO from HPACC (51.3%) and commercial CaCO3 (79.7%). Al was introduced to CMO by the addition of Al(NO3)3 in the synthesis of CMC-3 to give ACMO after calcination. The presence of ∼19 mol% of Al(NO3)3 in ACMO-4 significantly enhanced its stability over 23 cycles (capacity loss of 5.2%) when compared with CMO-3 (calcined CMC-3) without adversely affecting the CO2 uptake. After 100 cycles, ACMO-4 still had a CO2 uptake of 0.219 g g−1. Scanning electron microscope images clearly showed that the presence of Mg and Al in CMO hindered the sintering of CaCO3 at high temperatures and therefore, enhanced the cycle stability of the CMO sorbents. We tested the CO2 uptake properties of CMO and ACMO only under ideal laboratory testing environment, but our results indicated that these materials can be further optimized as good CO2 sorbents for various applications.
1 (CMO-3) showed comparable CO2 uptake at 650 °C (0.586 g g−1) to CaO sorbents obtained from pure HPACC (0.658 g g−1) and the commercial CaCO3 (0.562 g g−1). Over 23 adsorption–desorption cycles CMOs also showed a lower CO2 uptake capacity loss (35.7%) than CaO from HPACC (51.3%) and commercial CaCO3 (79.7%). Al was introduced to CMO by the addition of Al(NO3)3 in the synthesis of CMC-3 to give ACMO after calcination. The presence of ∼19 mol% of Al(NO3)3 in ACMO-4 significantly enhanced its stability over 23 cycles (capacity loss of 5.2%) when compared with CMO-3 (calcined CMC-3) without adversely affecting the CO2 uptake. After 100 cycles, ACMO-4 still had a CO2 uptake of 0.219 g g−1. Scanning electron microscope images clearly showed that the presence of Mg and Al in CMO hindered the sintering of CaCO3 at high temperatures and therefore, enhanced the cycle stability of the CMO sorbents. We tested the CO2 uptake properties of CMO and ACMO only under ideal laboratory testing environment, but our results indicated that these materials can be further optimized as good CO2 sorbents for various applications.
1. Introduction
Reducing carbon dioxide emissions and their contribution to the greenhouse effect is one of the greatest environmental challenges of modern times. Reducing CO2 emissions from their emission sources (i.e. power plants, industries) can be achieved by carbon capture and storage (CCS) targeted at the exhaust flue gas of these processes. CO2 capture can be carried out at different temperatures. CO2 capture at low or moderate temperatures can be performed by absorption using amines1 or adsorptions using solid adsorbents.2 Various types of solid sorbents, including zeolites,3 metal organic frameworks,1 hydrotalcites4 and oxides5 have been tested as solid adsorbents for CO2 sorption at low or moderate temperatures.High temperature CO2 sorption is also possible and can be desirable for high temperature processes such as hydrogen production, steel production, as well as combustion of fossil fuel for electricity generation. Some solid sorbents have the advantage of being thermally stable when compared with liquid sorbents. In particular, metal based oxide sorbents have been well-studied for CO2 sorption at high temperatures, Salaudeen et al.6 provide an excellent review of various types of metal oxide based sorbents.
Calcium looping (CaL) is a promising process for CO2 capture at high temperatures, it is based on the reversible reaction CaO (s) + CO2 (g) ⇌ CaCO3 (s). CaL can be implemented into an existing system using fluidized bed technology,7 making it relatively simple and cost effective. The drawback with using CaL is that the sintering temperature (also called the Tamman temperature) of CaCO3 is between 276 and 533 °C (ref. 8) which is much lower than the required operating temperature. This will cause sintering of CaCO3 during cycling. Sintering will cause the sorbent to lose its reactive sites over multiple CO2 uptake cycles and subsequently the loss of CO2 sorption capacity. Numerous efforts have been made to improve the cyclic performance of CaO sorbents, including the synthesis of nanostructured CaO composite sorbents,9 cage-like CaO microspheres,10 modification of CaO using organic acids,11,12 steam treatment during calcination,13–15 and the synthesis of sintering resistant sorbents.16,17
Sintering resistant CaO sorbents typically involves supporting CaO on a stabilizing or spacer material that can hinder the sintering of CaCO3 by sterically restricting contact between CaCO3 particles. The mineral dolomite, containing both MgO and CaO, has been proven to have a greater stability over multiple cycles compared to limestone.18 This is believed to be because MgO is functioning as a stabilizing material, effectively hindering CaCO3 from sintering because of its higher thermal stability and Tamman temperature of 1276 °C.8 Aihara et al. were among the first to suggest using a more inert material to prevent sintering of CaCO3 and demonstrated this by incorporating CaCO3 into a CaTiO2 framework.19 Hu et al. have presented an extensive screening of different inert supports for high temperature CO2 adsorption,20 a sorbent containing yttrium proved to be one of the best with a CO2 uptake of 0.48 g g−1 after 15 cycles.
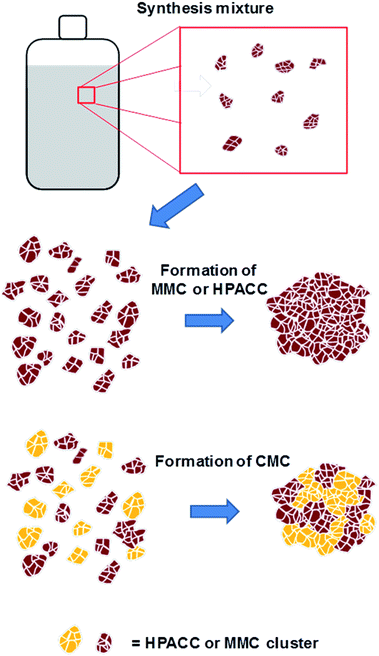
Recently our group has synthesized the highly porous, X-ray amorphous calcium carbonate (HPACC)21 and amorphous mesoporous magnesium carbonate (MMC)22,23 with very high BET surface area and porosity. The syntheses of HPACC and MMC do not require the use of any surfactants or organic additives. Typically during synthesis, CaO (for HPACC) or MgO (for MMC) is dispersed in methanol until a homogenous mixture is obtained. The synthesis mixture would then be subjected to 4 bar of CO2 in a sealed reaction vessel and stirred overnight at 50 °C (for HPACC) or at room temperature (for MMC). A synthesis mixture containing clusters of nanometer-sized CaCO3 (HPACC) or MgO (MMC) particles dispersed in methanol (Fig. 1, top) is obtained thereafter. HPACC and MMC powder with high porosity were then obtained by gelation and solvent evaporation of the reaction mixtures (Fig. 1, middle). During solvent evaporation, the nanometer-sized CaCO3 and MgCO3 particles act as building blocks that form clusters, resulting in solid particles with significant porosity. The obtained HPACC (BET > 350 m2 g−1)21 and MMC (BET > 700 m2 g−1)22 have similar micro and nano-structure as revealed by electron microscopy previously. The porosity arises from the void space between these nanometer-sized HPACC and MMC building blocks. MMC and HPACC have been tested for various bio and environmental applications, such as drug delivery,24–27 support for UV blocking semiconductor,28 dye adsorption29 and the synthesis of hierarchical porous carbon for the adsorption of SF6.21 In this study, we describe the synthesis of a highly porous inorganic carbonate composite (CMC) material that is made up of both HPACC and MMC. The corresponding inorganic oxide composite (CMO) was obtained through calcination of the synthesized CMCs. The nanoparticle-aggregate structure of the resulting CMOs would allow for rapid diffusion of CO2. We tested the CO2 uptake properties of these CMOs under pure CO2 environment to get an idea on how CMOs could potentially be further optimized as high temperature CO2 sorbents. The effect of the addition of Al(NO3)3 during the synthesis of CMCs and CMOs was also investigated.
2. Materials and methods
2.1. Synthesis of inorganic carbonates
![[thin space (1/6-em)]](https://www.rsc.org/images/entities/char_2009.gif) :
:![[thin space (1/6-em)]](https://www.rsc.org/images/entities/char_2009.gif) MMC were synthesized – HPACC
MMC were synthesized – HPACC![[thin space (1/6-em)]](https://www.rsc.org/images/entities/char_2009.gif) :
:![[thin space (1/6-em)]](https://www.rsc.org/images/entities/char_2009.gif) MMC = 1
MMC = 1![[thin space (1/6-em)]](https://www.rsc.org/images/entities/char_2009.gif) :
:![[thin space (1/6-em)]](https://www.rsc.org/images/entities/char_2009.gif) 3, 1
3, 1![[thin space (1/6-em)]](https://www.rsc.org/images/entities/char_2009.gif) :
:![[thin space (1/6-em)]](https://www.rsc.org/images/entities/char_2009.gif) 1 and 3
1 and 3![[thin space (1/6-em)]](https://www.rsc.org/images/entities/char_2009.gif) :
:![[thin space (1/6-em)]](https://www.rsc.org/images/entities/char_2009.gif) 1. These CMCs will hereafter be referred to as CMC-1, CMC-2 and CMC-3, the number following CMC indicates the increasing HPACC content in the material (Table 1). For the materials containing aluminum (Al), Al(NO3)3 was added to the MeOH during the pre-heating at different ratios (10–55 wt% with respect to the weight of CaO and MgO combined).
1. These CMCs will hereafter be referred to as CMC-1, CMC-2 and CMC-3, the number following CMC indicates the increasing HPACC content in the material (Table 1). For the materials containing aluminum (Al), Al(NO3)3 was added to the MeOH during the pre-heating at different ratios (10–55 wt% with respect to the weight of CaO and MgO combined).
Sample (HPACC![[thin space (1/6-em)]](https://www.rsc.org/images/entities/char_2009.gif) : :![[thin space (1/6-em)]](https://www.rsc.org/images/entities/char_2009.gif) MMC) MMC) |
Abbreviation |
|---|---|
1![[thin space (1/6-em)]](https://www.rsc.org/images/entities/char_2009.gif) : :![[thin space (1/6-em)]](https://www.rsc.org/images/entities/char_2009.gif) 3 3 |
CMC-1 |
1![[thin space (1/6-em)]](https://www.rsc.org/images/entities/char_2009.gif) : :![[thin space (1/6-em)]](https://www.rsc.org/images/entities/char_2009.gif) 1 1 |
CMC-2 |
3![[thin space (1/6-em)]](https://www.rsc.org/images/entities/char_2009.gif) : :![[thin space (1/6-em)]](https://www.rsc.org/images/entities/char_2009.gif) 1 1 |
CMC-3 |
| Al added to the synthesis of CMC-3 (mol% of Al/Al + Ca + Mg) | Abbreviation |
|---|---|
| 10% | ACMC-1 |
| 25% | ACMC-2 |
| 35% | ACMC-3 |
| 45% | ACMC-4 |
| 55% | ACMC-5 |
2.2. CO2 sorption – TGA
The CO2 sorption cycles were carried out on a Mettler Toledo TGA 2 (Schwerzenbach, Switzerland). The calcination/desorption steps were carried out under 100% nitrogen (N2) flow (50 mL min−1) with a heating rate of 10 °C min−1 up to 850 °C and held for 30 minutes, the CO2 uptake (sorption) was carried out at 650 °C for 60 minutes with 100% CO2 flow at 50 mL min−1. For the long term stability study (100 cycles), the CO2 uptake step was reduced to 30 minutes with a following desorption time of 15 minutes. The heating rate was increased to 20 °C min−1. The flow rates and temperatures remained unchanged.2.3. Nitrogen adsorption
The Brunauer–Emmett–Teller (BET) specific surface area (SBET) and porosity of the materials were determined by recording nitrogen adsorption and desorption isotherms (at 78 K) using a Micromeritics ASAP 2020 surface area analyzer (Norcross, GA, USA). Prior to the analysis, the samples were pre-treated by heating to 373 K under dynamic vacuum (1 × 10⁻⁴ Pa) using a Micromeritics SmartVacPrep sample preparation unit. Equilibrium adsorption data points were obtained when the change in pressure dropped below 0.01% within a 10 s interval (with minimum 100 s delay). SBET was obtained using the BET equation for adsorption points between p/p0 = 0.05 and 0.15. Average pore size of the samples was determined using the Density Functional Theory (DFT) methods (slit shape pore, N2 model).2.4. XRD
Powder X-ray diffraction (XRD) patterns were recorded using a Bruker D8 Twin diffractometer (Billerica, Massachusetts, USA) with Cu-Kα radiation (λ = 1.54 Å) for 2θ = 10.0 to 90.0° at room temperature. The instrument was set to operate at 45 kV and 40 mA.2.5. SEM/EDX
The morphology of the samples was examined using Zeiss LEO 1550 and 1530 electron microscopes (Oberkochen, Germany; operated at 2 kV), and an in-lens secondary electron detector was used for imaging. Samples were mounted on aluminum stubs with double adhesive carbon tape and sputtered with Au/Pd prior to analysis to avoid charge build up in the non-conductive materials. Energy dispersed X-ray spectroscopy (EDX) was carried out using a Zeiss LEO 1550 electron microscope, with an Oxford instruments X-Max detector (Abingdon, England) with an accelerating voltage of 15 kV and at a working distance of 6.5 mm.3. Result and discussion
3.1. The synthesis and characterization of CMC
CMC containing three different ratios of HPACC![[thin space (1/6-em)]](https://www.rsc.org/images/entities/char_2009.gif) :
:![[thin space (1/6-em)]](https://www.rsc.org/images/entities/char_2009.gif) MMC (3
MMC (3![[thin space (1/6-em)]](https://www.rsc.org/images/entities/char_2009.gif) :
:![[thin space (1/6-em)]](https://www.rsc.org/images/entities/char_2009.gif) 1, 1
1, 1![[thin space (1/6-em)]](https://www.rsc.org/images/entities/char_2009.gif) :
:![[thin space (1/6-em)]](https://www.rsc.org/images/entities/char_2009.gif) 1 and 1
1 and 1![[thin space (1/6-em)]](https://www.rsc.org/images/entities/char_2009.gif) :
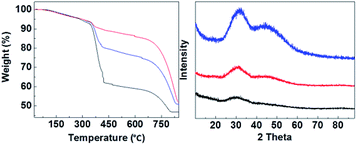
:![[thin space (1/6-em)]](https://www.rsc.org/images/entities/char_2009.gif) 3) were synthesized. Fig. 2 shows that CMC-3, CMC-2 and CMC-1 were X-ray amorphous according to their powder XRD patterns with no appearance of any sharp diffraction peaks. The amorphous nature of CMCs was in agreement with the earlier observed structure of HPACC and MMC.21,22 The two humps that appeared in the diffraction patterns of CMC at around 2θ = ∼30° and ∼45° were related to the short range atomic order observed in HPACC as discussed in detail in our previous work.21 As expected, the intensity of these humps collated to the HPACC
3) were synthesized. Fig. 2 shows that CMC-3, CMC-2 and CMC-1 were X-ray amorphous according to their powder XRD patterns with no appearance of any sharp diffraction peaks. The amorphous nature of CMCs was in agreement with the earlier observed structure of HPACC and MMC.21,22 The two humps that appeared in the diffraction patterns of CMC at around 2θ = ∼30° and ∼45° were related to the short range atomic order observed in HPACC as discussed in detail in our previous work.21 As expected, the intensity of these humps collated to the HPACC![[thin space (1/6-em)]](https://www.rsc.org/images/entities/char_2009.gif) :
:![[thin space (1/6-em)]](https://www.rsc.org/images/entities/char_2009.gif) MMC ratio; CMC-3 with the highest HPACC content showed the most noticeable humps when compared with CMC-2 and CMC-1. TGA curves (Fig. 2) of the CMCs also confirmed the different HPACC
MMC ratio; CMC-3 with the highest HPACC content showed the most noticeable humps when compared with CMC-2 and CMC-1. TGA curves (Fig. 2) of the CMCs also confirmed the different HPACC![[thin space (1/6-em)]](https://www.rsc.org/images/entities/char_2009.gif) :
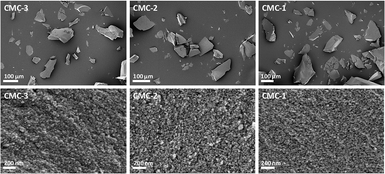
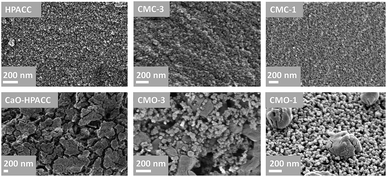
:![[thin space (1/6-em)]](https://www.rsc.org/images/entities/char_2009.gif) MMC ratios of the synthesized CMC. Two mass drops were observed in the TGA curves of the CMCs, the first mass drop at ∼400 °C was attributed to the decomposition of magnesium carbonate (MgCO3) to magnesium oxide (MgO).22 The second mass drop at ∼700 °C was related to the decomposition of calcium carbonate (CaCO3) to calcium oxide (CaO).21 SEM images of the CMCs are shown in Fig. 3. The morphology of the CMC particles resemble that observed for HPACC and MMC – the particles were irregularly shaped on a μm scale, and each particle are clusters of the nanometer-sized particles that had dimensions in the nm scale range. No big differences in morphology were observed between CMCs with different ratios of HPACC
MMC ratios of the synthesized CMC. Two mass drops were observed in the TGA curves of the CMCs, the first mass drop at ∼400 °C was attributed to the decomposition of magnesium carbonate (MgCO3) to magnesium oxide (MgO).22 The second mass drop at ∼700 °C was related to the decomposition of calcium carbonate (CaCO3) to calcium oxide (CaO).21 SEM images of the CMCs are shown in Fig. 3. The morphology of the CMC particles resemble that observed for HPACC and MMC – the particles were irregularly shaped on a μm scale, and each particle are clusters of the nanometer-sized particles that had dimensions in the nm scale range. No big differences in morphology were observed between CMCs with different ratios of HPACC![[thin space (1/6-em)]](https://www.rsc.org/images/entities/char_2009.gif) :
:![[thin space (1/6-em)]](https://www.rsc.org/images/entities/char_2009.gif) MMC. The synthesis and structure of CMCs could therefore, be represented by the scheme shown in Fig. 1 as discussed earlier. N2 adsorption revealed that all synthesized CMC have BET surface area and porosity comparable to HPACC and MMC (Table 2). The BET surface area of the CMCs correlated increasingly with increased MMC content, which was somewhat expected as MMC typically had a higher BET surface area than HPACC.
MMC. The synthesis and structure of CMCs could therefore, be represented by the scheme shown in Fig. 1 as discussed earlier. N2 adsorption revealed that all synthesized CMC have BET surface area and porosity comparable to HPACC and MMC (Table 2). The BET surface area of the CMCs correlated increasingly with increased MMC content, which was somewhat expected as MMC typically had a higher BET surface area than HPACC.
| Sample | BET surface area before calcination (m2 g−1) | CO2 uptake 1st cycle (g g−1) | CO2 uptake 23rd cycle (g g−1) | Capacity loss after 23 cycles (%) |
|---|---|---|---|---|
| MMC | 698 | — | — | — |
| HPACC | 394 | 0.658 | 0.320 | 51.3 |
| CaCO3 | 1 | 0.562 | 0.114 | 79.7 |
| CMC-3 | 490 | 0.586 | 0.377 | 35.7 |
| CMC-2 | 543 | 0.445 | 0.356 | 19.8 |
| CMC-1 | 623 | 0.274 | 0.246 | 0.7 |
3.2. CO2 uptake on CMC derived sorbents
The synthesized CMC sorbents were tested for CO2 uptake properties. The experiments were carried out using pure CO2 gas. While our experimental conditions did not resemble the conditions of real-life applications well, it gave some ideas on CO2 uptake properties and allowed us to investigate the CO2–CMO interaction. The information is important for the further optimization of CMO based CO2 sorbents. The CMCs were first calcined in N2 at 850 °C in order to obtain the different CMOs containing CaO and MgO.CaO and MgO sorbents obtained from the calcination of HPACC (CaO-HPACC), CaCO3 (CaO-CaCO3) and MMC (MgO-MMC) were also tested for comparison. The powder XRD diffractograms shown in Fig. S1† showed that the conversion from CMCs to CMOs was successful. XRD peaks related to MgO and CaO were observed.
After calcination, CO2 uptake experiments were performed at 650 °C with pure CO2 over 23 cycles and the CO2 uptake at the end of each cycle is shown in Fig. 4. The CO2 uptake capacities of the CMOs, CaO-HPACC and MgO-MMC at the first and 23rd cycle are listed in Table 2. CaO-HPACC showed the highest CO2 uptake of all the tested sorbents. The CO2 uptake on CaO-HPACC was 0.658 g g−1 in the first cycle. The high CO2 uptake was most probably due to the highly porous nature of the HPACC precursor, yielding a CaO sorbent with increased porosity. Note that sintering of the nanoparticles in the HPACC precursor would take place during the initial calcination, but the extent of sintering was expected to be less than that of the commercialized CaO-CaCO3, which was not constructed from aggregated nanometer-sized particles. A clear trend in the CO2 uptake was observed among the CMO samples. During the first cycle, CMO-3 with the highest HPACC content had the highest CO2 uptake of 0.586 g g−1. The CO2 uptake at the first cycle decreased when the HPACC content was decreased. The CO2 uptake of CMO-1 during the first cycle was 0.247 g g−1. This observation was expected as the CO2 uptake experiment temperature (650 °C) was higher than the decomposition temperature of MgCO3 to MgO (∼450 °C observed in the TGA curves in Fig. 2). MgO-MMC was unable to take up CO2 at the experiment temperature. Furthermore, there was no noticeable correlation between the BET surface area of the CMCs (before calcination) and the CO2 uptake capacity of the CMOs. The pores on CMCs and CMOs are not uniform and have no regular shape, therefore the difference in CO2 uptake between the different samples was also not related to the shape of the pores. Over 23 cycles, the CO2 uptake of the tested sorbents reduced. CaO-HPACC showed the most significant loss in CO2 uptake capacity of around 80%. CaO-CaCO3 showed the second most significant CO2 uptake capacity loss of over 51%. The CMOs performed better than CaO-HPACC and CaCO3; the relative loss of CO2 uptake capacity after 23 cycles appeared to be related to the MgO content within the CMOs.
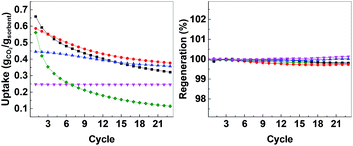 | ||
| Fig. 4 Left: CO2 uptake over 23 cycles, right: regeneration over 23 cycles. CaO-HPACC (■, black), MgO-MgCO3 (♦, green), CMO-3 (●, red), CMO-2 (▲, blue) and CMO-1 (▼, magenta). | ||
CMO-3 and CMO-2 lost around 36% and 20%, respectively, of their CO2 uptake capacity after 23 cycles. In contrast, the high MgO content CMO-1 lost less than 1% of its CO2 uptake capacity after 23 cycles, but it is important to note that the CO2 uptake capacity of CMO-1 at the first cycle was already lower than that of CMO-3 and CMO-2 after 23 cycles. When comparing the CO2 uptake capacity loss over 23 cycles, it was clear that the presence of MgO in CMOs could reduce the CO2 uptake capacity loss on the CMOs after a number of cycles. Desorption analysis showed that after each desorption cycle, the mass of the calcined CMO sorbent returned to within 0.3% of the initial value (Fig. 4, right). This observation indicated that all of the captured CO2 was removed from the sorbent during each desorption cycle. The full adsorption–desorption cycles for all CMOs, CaO-HPACC and CaO-CaCO3 can be viewed in ESI (Fig. S2–S6†).
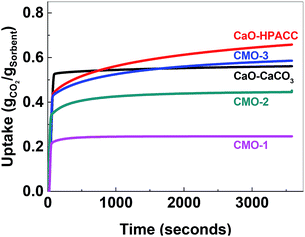
The uptake kinetics of the CMOs during the first CO2 uptake cycle is compared in Fig. 5. All of the tested sorbents showed a rapid uptake of CO2 initially (up to ∼70 seconds, depending on the sorbent). A more gradual increase in the CO2 uptake followed thereafter. The CO2 uptake kinetics of the first and the 23rd cycles were analyzed using the pseudo first order kinetic model and the pseudo second order kinetic model for all sorbents (Fig. S7–S11†). Although it was not possible to fit the pseudo first order kinetic model to the data, a seemingly straight line could be observed in the pseudo first order kinetic plot for the CO2 uptake kinetics of all samples except CaO-CaCO3 at t = ∼20–60 s (exact time scale varied between samples). This suggested that diffusion controlled CO2 uptake could be the main mechanism of CO2 uptake during this time frame. The CO2 uptake after this initial stage also showed a reasonably straight line in the pseudo second order kinetic model, which implied that CO2 uptake mainly went by a chemisorption mechanism. Unfortunately, neither of the two models provided fitting parameters that could be interpreted (the Elovich model also failed to fit our data). We therefore, assume that the CO2 uptake was controlled by more than one uptake mechanism, but with chemisorption being the dominating one.
The SEM images in Fig. 6 show the morphology of the CaO-HPACC and CMOs after 23 CO2 uptake cycles. According to Fig. 6, sintering of the nanoparticles could be observed clearly on CaO-HPACC after the 23 CO2 uptake cycles. Sintering was also observed on CMO-3 after 23 cycles, but it was clear that the presences of MgO nanoparticles had restricted the further sintering of the CaCO3 and provided some void spaces between the CaCO3 particles (that can be regenerated to CaO). Similar observation could be made for CMO-1, although the presence of MgO was not able to completely halt the sintering of CaCO3, MgO was able to hinder the individual CaCO3 particles to come into contact with each other, preventing further sintering. This was clearly seen in Fig. 6 (CMO-1), where the sintered CaCO3 particles appeared to be supported on the MgO nanoparticles, with some distances away from other CaCO3 particles. The negligible CO2 uptake capacity loss observed on the CMO-1 suggested that the CaCO3 particles observed in Fig. 6 (CMO-1) could be results of sintering during the first cycle. As these particles have no contact with one another, further sintering did not take place and the CO2 uptake capacity therefore, remained effectively unchanged. Note that in the case of CMO-3 and CMO-1, sintering of the MgO particles also occurred to a low extent, as the particles size of MgO showed a clear increase after 23 CO2 uptake cycles. Nevertheless, it was clear that the stability of these CMO sorbents in high temperature CO2 uptake could be improved by adjusting the HPACC![[thin space (1/6-em)]](https://www.rsc.org/images/entities/char_2009.gif) :
:![[thin space (1/6-em)]](https://www.rsc.org/images/entities/char_2009.gif) MMC ratio of the pre-calcination CMC materials. Out of the three CMOs tested here, CMO-3 showed the highest CO2 uptake capacity through all cycles. The CO2 uptake capacity loss was also noticeably lower than that of CaO-HPACC and CaO-CaCO3.
MMC ratio of the pre-calcination CMC materials. Out of the three CMOs tested here, CMO-3 showed the highest CO2 uptake capacity through all cycles. The CO2 uptake capacity loss was also noticeably lower than that of CaO-HPACC and CaO-CaCO3.
In an attempt to further improve the cyclic stability of CMO-3, we introduced different amounts of aluminum nitrate Al(NO3)3 (from 10 to 55 wt%, in the synthesis mixture, see Table 1) to the synthesis of CMC-3 (denoted: ACMC). The final Al compositions within ACMC were quantified using inductively coupled plasma-optical emission spectroscopy (ICP-OES, performed by MEDAC Ltd. UK) and listed in Table 3. Note that the content of Al did not increase significantly when the Al content during the CMC synthesis was increased from 35 wt% to 45 wt% and to 55 wt% (ACMC-3, ACMC-4 and ACMC-5, respectively). All three ACMCs had a final Al(NO3)3 content of close to 20 mol%. The specific surface area of ACMC decreased with increasing Al content (Table 3). ACMCs were calcined to ACMOs (an Al(NO3)3![[thin space (1/6-em)]](https://www.rsc.org/images/entities/char_2009.gif) :
:![[thin space (1/6-em)]](https://www.rsc.org/images/entities/char_2009.gif) CaO
CaO![[thin space (1/6-em)]](https://www.rsc.org/images/entities/char_2009.gif) :
:![[thin space (1/6-em)]](https://www.rsc.org/images/entities/char_2009.gif) MgO composite), TGA curves of the decomposition of ACMOs can be seen in ESI (Fig. S12†), and the CO2 uptake capacity of ACMOs were recorded over 23 cycles and is shown in Fig. 7 and Table 3. When compared with the CO2 uptake capacities of CMOs (Fig. 4 and Table 2), the addition of Al(NO3)3 had undoubtedly improved the cyclic stability of CMO sorbents without adversely affecting the CO2 uptake capacity, even during the initial cycles.
MgO composite), TGA curves of the decomposition of ACMOs can be seen in ESI (Fig. S12†), and the CO2 uptake capacity of ACMOs were recorded over 23 cycles and is shown in Fig. 7 and Table 3. When compared with the CO2 uptake capacities of CMOs (Fig. 4 and Table 2), the addition of Al(NO3)3 had undoubtedly improved the cyclic stability of CMO sorbents without adversely affecting the CO2 uptake capacity, even during the initial cycles.
| Sample | Al/(Al + Ca + Mg) mol% | BET surface area before calcination (m2 g−1) | CO2 uptake 1st cycle (g g−1) | CO2 uptake 23rd cycle (g g−1) | Capacity loss after 23 cycles (%) |
|---|---|---|---|---|---|
| ACMC-1 | 3.3 | 501 | 0.594 | 0.392 | 34 |
| ACMC-2 | 12.5 | 418 | 0.579 | 0.477 | 17.6 |
| ACMC-3 | 18.1 | 306 | 0.538 | 0.482 | 10.4 |
| ACMC-4 | 19.7 | 288 | 0.537 | 0.509 | 5.2 |
| ACMC-5 | 23 | 349 | 0.517 | 0.502 | 2.8 |
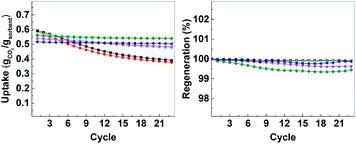 | ||
| Fig. 7 Left: CO2 uptake over 23 cycles, right: regeneration over 23 cycles. CMO-3 (●, red), ACMO-1 (■, black), ACMO-2 (▲, cyan), ACMO-3 (▼, magenta), ACMO-4 (♦, green) and ACMO-5 (◀, blue). | ||
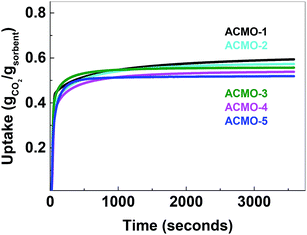
The CO2 uptake capacity of ACMOs were comparable to CMO-3. The ACMO-1 had the highest CO2 uptake capacity of all ACMOs synthesized here. The CO2 uptake capacity decreased slightly when the Al content of the ACMOs was increased. ACMO with the highest Al content (ACMO-5) showed high CO2 uptake during the first cycle (0.571 g g−1). After each CO2 desorption cycle, the mass of the ACMO sorbent also did not show noticeable deviation (within 0.7%, see Fig. 7) from the initial value, meaning that all of the captured CO2 desorbed from the sorbent after each cycle. The CO2 uptake kinetics of ACMOs is shown in Fig. 8. The full adsorption and desorption cycles and kinetic analysis could be found in the ESI (Fig. S13–S22†) with a similar conclusion as that drawn earlier for the CMOs.
Similar to the CMOs, the BET surface areas of ACMCs before calcination did not appear to be related to their CO2 uptake capacities. As shown in Table 3, the capacity loss over 23 cycles was affected by the addition of Al(NO3)3. The presence of Al in CMOs in high amounts appeared to have increased the stability of these sorbents. In the case of ACMO-1, where the Al content was only 3.3 mol%, the CO2 uptake capacity loss (34%) was very similar to that of CMO-3 (35.7%). When the presence of Al was increased, the CO2 uptake capacity loss after 23 cycles reduced from 17.6% in ACMO-2 down to 5.2% in ACMO-4 and 2.8% in ACMO-5. After 23 cycles, the CO2 uptake capacity of ACMO-4 and ACMO-5 was 0.508 g g−1 and 0.502 g g−1, respectively. The cycle CO2 uptake capacity and the stability of ACMO-4 and ACMO-5 can be compared with other sorbents. Tian et al. studied sorbents derived from steel slag and doped with different metal oxides (MgO, Al(NO3)3, Fe2O3 and MnO) and found that they have CO2 uptakes ranging from 0.2 to 0.3 g g−1 after 30 cycles.30 In their study that also found that the best performing dopants (i.e. with most improved stability) were MgO and Al(NO3)3. Luo et al. described a CaO/MgO material made by sol–gel combustion synthesis that had a CO2 uptake of 0.52 g g−1 after 20 cycles.31
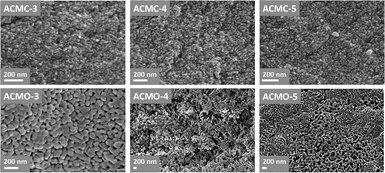
The SEM images of ACMO-3, ACMO-4 and ACMO-5 after 23 CO2 uptake cycles can be found in Fig. 9. In all of the ACMOs, the sintered CaCO3 that was noted on CMOs (HPACC-MgO, CMO-3 and CMO-1, in Fig. 6) was not observed for ACMOs with high Al content. This lack of sintered CaCO3 suggested that the addition of Al to CMOs was able to restrict the sintering of CaCO3, this was most probably due to the high Tamman temperature of Al(NO3)3 (900 °C)32 and MgO. Despite that, some levels of sintering/particle growth were observed in all three ACMO samples after 23 CO2 uptake cycles, particularly on ACMO-3. When comparing the SEM images shown in Fig. 9, it appears that ACMO-4 showed the least amount of particle sintering. It was clear to us that the improved cyclic CO2 uptake capacity on ACMOs was related to the low levels of CaCO3 sintering, which was the result of Al addition into CMOs. EDX mapping shown in the ESI (Fig. S23†) revealed that there was an even distribution of Al, Ca and Mg in ACMO-4 before and after CO2 cycling.
3.3. Long-term cyclic stability test
In order to evaluate the possibility for further development of ACMOs as CO2 sorbent for high temperature applications, we selected ACMO-4 and ACMO-5 for long-term cyclic CO2 uptake experiments. ACMO-4 and ACMO-5 were subjected to 100 CO2 uptake cycles (note that these cycles were shorter than that for the 23 cycle experiments – see Experimental section, therefore a more rapid capacity loss was not unexpected). Fig. 10 (left) shows the uptake of CO2 on ACMO-4 and ACMO-5 at the end of each CO2 uptake cycle with respect to the first cycle. Both ACMOs showed a decrease in their CO2 uptake capacity over these 100 cycles. The capacity loss profile can be divided into three stages. During the first 20 cycles, both ACMOs were able to keep most of their CO2 uptake capacity. However, the CO2 uptake capacity of ACMO-5 began to decay rapidly in the next 20 cycles before gradually leveling out. After 100 cycles the CO2 uptake was around 37% of the original value (CO2 uptake at the 100th cycle = 0.191 g g−1). The ACMO-4 appeared to be slightly more stable during the early cycles, the capacity loss was gradual up to the 30th cycle. Thereafter, the same rapid decay observed for ACMO-5 was seen, although at a slower pace. After 100 cycles the CO2 uptake was around 40% of the original value (0.219 g g−1). The desorption analysis showed that the captured CO2 fully desorbed from both of these sorbents after each desorption cycle. The mass of the calcined sorbent deviated less than 0.5% from the initial value (Fig. 10, right). Although there was a significant loss in CO2 uptake capacity in both ACMOs after 100 cycles, the CO2 uptake at the 100th cycle was still higher than that of CaO-CaCO3 after just 23 cycles (0.114 g g−1). Full adsorption–desorption cycles can be viewed in ESI (Fig. S24 and S25†). XRD of ACMO-4 (Fig. S26†) after cycling showed the presence of the mineral mayenite (Ca12Al14O33)33 in small amounts. The changes in the chemistries around the Ca and Al metals were also observed by considering the XPS spectra (Fig. S27†) of ACMO-4 after 23 and 39 CO2 cycles. The presence of mayenite may further explain the improved cyclic stability of ACMO-4 as mayenite has previously been used as an inert support for CaO in CaL.34 Furthermore, the performance of ACMOs over 100 cycles could be compared with the performance of other similar materials using Al and Mg as support. Wang et al. studied a mixed oxide material derived from Ca–Al–ClO2-layered double hydroxide and recorded a CO2 uptake of 0.29 g g−1 during the first cycle, which was subsequently reduced to 0.25 g g−1 after 50 cycles.35 In another study, Luo et al. found that the CO2 uptake on MgO/CaO material was 0.15 g g−1 after 100 cycles.36 For a more extensive comparison of different metal oxides as inert support materials we refer the readers to Hu et al.20 It would appear that the cyclic stability of ACMO-4 and ACMO-5 was higher than that of some of the other sorbents previously studied with a high level of CO2 uptake still possible after 100 cycles. When compared with CaO-CaCO3 and CaO-HPACC obtained from the calcination of CaCO3 and HPACC, ACMOs demonstrate enhanced cyclic CO2 uptake capacity due to the ability for MgO and Al(NO3)3 to hinder the sintering of CaCO3 in ACMOs. The results presented here would suggest that it would be interesting to further develop ACMO-4 and ACMO-5 as high temperature CO2 sorbents. Additionally, we performed CO2 uptake experiments using ACMO-4 in a mixed gas conditions (20% CO2, 80% N2) as well as under mild humid conditions (by bubbling the CO2 gas through 5 water traps before subjecting the gas to the experimental setup) to gain some insight as to how these changes would affect the performance of ACMO-4. The obtained preliminary results can be found in the ESI (Fig. S2†). We are aware that more work is required in order to test ACMO-4 as a potential CO2 sorbent under industrially relevant conditions.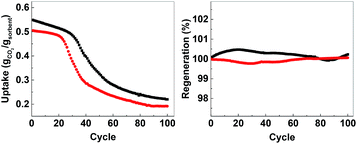 | ||
| Fig. 10 Left; uptake over 100 cycles, right; regeneration over 100 cycles. AMCO-4 (■, black) and AMCO-5 (●, red). | ||
4. Conclusions
In this study, we successfully synthesized a number of calcium magnesium carbonate composites (CMCs) by adapting from the synthesis of high porosity amorphous calcium carbonate (HPACC) and mesoporous magnesium carbonate (MMC). Three different CMCs with HPACC![[thin space (1/6-em)]](https://www.rsc.org/images/entities/char_2009.gif) :
:![[thin space (1/6-em)]](https://www.rsc.org/images/entities/char_2009.gif) MMC the ratios 3
MMC the ratios 3![[thin space (1/6-em)]](https://www.rsc.org/images/entities/char_2009.gif) :
:![[thin space (1/6-em)]](https://www.rsc.org/images/entities/char_2009.gif) 1, 1
1, 1![[thin space (1/6-em)]](https://www.rsc.org/images/entities/char_2009.gif) :
:![[thin space (1/6-em)]](https://www.rsc.org/images/entities/char_2009.gif) 1 and 1
1 and 1![[thin space (1/6-em)]](https://www.rsc.org/images/entities/char_2009.gif) :
:![[thin space (1/6-em)]](https://www.rsc.org/images/entities/char_2009.gif) 3 were obtained and all CMCs were highly porous with high BET surface area (over 490 m2 g−1). These CMCs were calcined to obtain calcium magnesium oxide composites (CMOs) and their CO2 uptake properties at a high temperature (650 °C) was examined. CMO-3, with a CaO
3 were obtained and all CMCs were highly porous with high BET surface area (over 490 m2 g−1). These CMCs were calcined to obtain calcium magnesium oxide composites (CMOs) and their CO2 uptake properties at a high temperature (650 °C) was examined. CMO-3, with a CaO![[thin space (1/6-em)]](https://www.rsc.org/images/entities/char_2009.gif) :
:![[thin space (1/6-em)]](https://www.rsc.org/images/entities/char_2009.gif) MgO ratio of 3
MgO ratio of 3![[thin space (1/6-em)]](https://www.rsc.org/images/entities/char_2009.gif) :
:![[thin space (1/6-em)]](https://www.rsc.org/images/entities/char_2009.gif) 1, showed a CO2 uptake capacity 0.586 g g−1 during the first CO2 uptake cycle, which was comparable to that of CaO obtained from the calcination of commercial CaCO3 (0.562 g g−1). The cyclic stability of CMO-3 over 23 CO2 uptake cycles was higher than that of CaO (35% capacity loss for CMO-3, and 80% for CaO). The enhanced stability was due to the presence of MgO in CMO-3 that acted as a spacer between CaCO3 nanoparticles to hinder sintering. Full desorption of the captured CO2 from CMOs was achieved during every sorption cycle. Al(NO3)3 was introduced to CMO-3 to further enhance the stability of the CMOs. The amount of Al in the CMO-3 was varied between 3 to 23 mol% (of all metals). ACMO-4 with an Al content of 19.2 mol% showed comparable CO2 uptake (0.536 g g−1) to CMO-3 during the initial cycle. The CO2 uptake capacity loss for ACMO-4 after 23 cycles (5.2%) was significantly lower than for CMO-3 (35%). Long-term cyclic experiments showed that after 100 CO2 uptake cycles, the ACMO-4 still showed a significant CO2 uptake of 0.219 g g−1. In summary, we have shown here that the stability of HPACC derived CaO sorbent could be enhanced by introducing MMC and Al(NO3)3 to the synthesis. ACMOs was found to be more stable over 100 cycles than CaO as well as some other CaO based sorbents. With its high CO2 uptake and enhanced stability, ACMOs appears to have properties that could be further developed for CO2 sorption at high temperatures. This study was limited to testing the CO2 uptake of ACMO in pure CO2 atmosphere and calcination in pure N2, which indicated the potential of ACMOs as CO2 sorbents. We are aware that to fully develop ACMOs as CO2 sorbent, it is essential to focus on the performance of ACMOs in industrially relevant conditions (i.e. CO2 mixed with N2 in flue gas, sorbent regeneration in CO2 rather than pure N2 as used in this study). It would also be interesting to study the possibility of using CMOs and ACMOs as a catalyst support for high temperature applications.
1, showed a CO2 uptake capacity 0.586 g g−1 during the first CO2 uptake cycle, which was comparable to that of CaO obtained from the calcination of commercial CaCO3 (0.562 g g−1). The cyclic stability of CMO-3 over 23 CO2 uptake cycles was higher than that of CaO (35% capacity loss for CMO-3, and 80% for CaO). The enhanced stability was due to the presence of MgO in CMO-3 that acted as a spacer between CaCO3 nanoparticles to hinder sintering. Full desorption of the captured CO2 from CMOs was achieved during every sorption cycle. Al(NO3)3 was introduced to CMO-3 to further enhance the stability of the CMOs. The amount of Al in the CMO-3 was varied between 3 to 23 mol% (of all metals). ACMO-4 with an Al content of 19.2 mol% showed comparable CO2 uptake (0.536 g g−1) to CMO-3 during the initial cycle. The CO2 uptake capacity loss for ACMO-4 after 23 cycles (5.2%) was significantly lower than for CMO-3 (35%). Long-term cyclic experiments showed that after 100 CO2 uptake cycles, the ACMO-4 still showed a significant CO2 uptake of 0.219 g g−1. In summary, we have shown here that the stability of HPACC derived CaO sorbent could be enhanced by introducing MMC and Al(NO3)3 to the synthesis. ACMOs was found to be more stable over 100 cycles than CaO as well as some other CaO based sorbents. With its high CO2 uptake and enhanced stability, ACMOs appears to have properties that could be further developed for CO2 sorption at high temperatures. This study was limited to testing the CO2 uptake of ACMO in pure CO2 atmosphere and calcination in pure N2, which indicated the potential of ACMOs as CO2 sorbents. We are aware that to fully develop ACMOs as CO2 sorbent, it is essential to focus on the performance of ACMOs in industrially relevant conditions (i.e. CO2 mixed with N2 in flue gas, sorbent regeneration in CO2 rather than pure N2 as used in this study). It would also be interesting to study the possibility of using CMOs and ACMOs as a catalyst support for high temperature applications.
Conflicts of interest
There are no conflicts to declare.Acknowledgements
The authors thank Swedish Research Council (grant # 2014-3929), the Swedish Research Council for Sustainable Development (FOMAS, grant #2018-00651) and The Swedish Foundation for Strategic Environmental Research-MISTRA (project name Mistra TerraClean, project number 2015/31) for their financial support. Michelle Åhlén from Uppsala University is acknowledged for her help with the XPS experiments.References
- S. Choi, J. H. Drese and C. W. Jones, ChemSusChem, 2009, 2, 796–854 CrossRef CAS PubMed.
- N. Hedin, L. Andersson, L. Bergström and J. Yan, Appl. Energy, 2013, 104, 418–433 CrossRef CAS.
- O. Cheung and N. Hedin, RSC Adv., 2014, 4, 14480–14494 RSC.
- B. Dou, C. Wang, Y. Song, H. Chen, B. Jiang, M. Yang and Y. Xu, Renewable Sustainable Energy Rev., 2016, 53, 536–546 CrossRef CAS.
- L. K. G. Bhatta, S. Subramanyam, M. D. Chengala, S. Olivera and K. Venkatesh, J. Cleaner Prod., 2015, 103, 171–196 CrossRef CAS.
- S. A. Salaudeen, B. Acharya and A. Dutta, J. CO2 Util., 2018, 23, 179–199 CrossRef CAS.
- T. Mattisson, M. Keller, C. Linderholm, P. Moldenhauer, M. Rydén, H. Leion and A. Lyngfelt, Fuel Process. Technol., 2018, 172, 1–12 CrossRef CAS.
- A. M. Kierzkowska, R. Pacciani and C. R. Müller, ChemSusChem, 2013, 6, 1130–1148 CrossRef CAS PubMed.
- J. Chen, L. Duan, F. Donat, C. R. Müller, E. J. Anthony and M. Fan, Chem. Eng. J. (Lausanne), 2018, 351, 1038–1046 CrossRef CAS.
- J. Chen, L. Duan and Z. Sun, Environ. Sci. Technol., 2019, 53, 2249–2259 CrossRef CAS PubMed.
- Y. Li, C. Zhao, H. Chen, C. Liang, L. Duan and W. Zhou, Fuel, 2009, 88, 697–704 CrossRef CAS.
- R. Sun, Y. Li, S. Wu, C. Liu, H. Liu and C. Lu, Powder Technol., 2013, 233, 8–14 CrossRef CAS.
- A. Wang, N. Deshpande and L. S. Fan, Energy Fuels, 2015, 29, 321–330 CrossRef CAS.
- V. Manovic and E. J. Anthony, Ind. Eng. Chem. Res., 2010, 49, 9105–9110 CrossRef CAS.
- A. Coppola, P. Salatino, F. Montagnaro and F. Scala, Fuel, 2014, 127, 109–115 CrossRef CAS.
- L. Barelli, G. Bidini, A. Di Michele, F. Gallorini, C. Petrillo and F. Sacchetti, Appl. Energy, 2014, 127, 81–92 CrossRef CAS.
- H. R. Radfarnia and M. C. Iliuta, Chem. Eng. J. (Lausanne), 2013, 232, 280–289 CrossRef CAS.
- J. M. Valverde, P. E. Sanchez-Jimenez and L. A. Perez-Maqueda, Appl. Energy, 2015, 138, 202–215 CrossRef CAS.
- M. Aihara, T. Nagai, J. Matsushita, Y. Negishi and H. Ohya, Appl. Energy, 2001, 69, 225–238 CrossRef CAS.
- Y. Hu, W. Liu, H. Chen, Z. Zhou, W. Wang, J. Sun, X. Yang, X. Li and M. Xu, Fuel, 2016, 181, 199–206 CrossRef CAS.
- R. Sun, P. Zhang, É. G. Bajnóczi, A. Neagu, C.-W. Tai, I. Persson, M. Strømme and O. Cheung, ACS Appl. Mater. Interfaces, 2018, 10, 21556–21564 CrossRef CAS PubMed.
- J. Forsgren, S. Frykstrand, K. Grandfield, A. Mihranyan and M. Strømme, PLoS One, 2013, 8, e68486 CrossRef CAS PubMed.
- O. Cheung, P. Zhang, S. Frykstrand, H. Zheng, T. Yang, M. Sommariva, X. Zou and M. Strømme, RSC Adv., 2016, 6, 74241–74249 RSC.
- P. Zhang, T. Z. Gómez De La Torre, J. Forsgren, C. A. S. Bergström and M. Strømme, J. Pharm. Sci., 2016, 105, 657 CrossRef CAS PubMed.
- M. Vall, P. Zhang, A. Gao, S. Frykstrand, O. Cheung and M. Strømme, Int. J. Pharm., 2017, 524, 141–147 CrossRef CAS PubMed.
- P. Zhang, J. Forsgren and M. Strømme, Int. J. Pharm., 2014, 472, 185–191 CrossRef CAS PubMed.
- P. Zhang, T. Zardán Gómez de la Torre, K. Welch, C. A. S. Bergström and M. Strømme, Eur. J. Pharm. Sci., 2016, 93, 468–474 CrossRef CAS PubMed.
- M. Åhlén, O. Cheung and M. Strømme, ACS Omega, 2019, 4, 4429–4436 CrossRef.
- M. Vall, M. Strømme and O. Cheung, ACS Omega, 2019, 4, 2973–2979 CrossRef CAS.
- S. Tian, J. Jiang, F. Yan, K. Li and X. Chen, Environ. Sci. Technol., 2015, 49, 7464–7472 CrossRef CAS PubMed.
- C. Luo, Y. Zheng, Y. Xu, N. Ding, Q. Shen and C. Zheng, Chem. Eng. J., 2015, 267, 111–116 CrossRef CAS.
- J. Phromprasit, J. Powell and S. Assabumrungrat, Chem. Eng. J., 2016, 284, 1212–1223 CrossRef CAS.
- Z. Li, N. Cai, Y. Huang and H. Han, Energy Fuels, 2005, 19, 1447–1452 CrossRef CAS.
- V. Manovic and E. J. Anthony, Environ. Sci. Technol., 2009, 43, 7117–7122 CrossRef CAS PubMed.
- S. Wang, C. Li, S. Yan, Y. Zhao and X. Ma, Energy Fuels, 2016, 30, 1217–1222 CAS.
- C. Luo, Y. Zheng, J. Yin, C. Qin, N. Ding, C. Zheng and B. Feng, Energy Fuels, 2013, 27, 4824–4831 CrossRef CAS.
Footnote |
| † Electronic supplementary information (ESI) available. See DOI: 10.1039/c9ra02843a |
| This journal is © The Royal Society of Chemistry 2019 |

