 Open Access Article
Anions influence the extraction of rutile nanoparticles from synthetic and lake water†
Tianrui Zhaoac,
Fangyuan Liuad,
Chunpeng Zhang *ad and
Xiaochen Chen
 b
b
aKey Laboratory of Groundwater Resources and Environment, Ministry of Education, Jilin University, Changchun, 130021, China. E-mail: zhang_cp@jlu.edu.cn
bFujian Provincial Engineering Research Center of Rural Waste Recycling Technology, College of Environment and Resources, Fuzhou University, Fuzhou, 350108, China
cState Key Laboratory of Urban Water Resource and Environment, Harbin Institute of Technology, Harbin 150090, China
dJilin Provincial Key Laboratory of Water Resources and Environment, Jilin University, China
First published on 29th May 2019
Abstract
Due to their recent widespread use, nanoparticles (NPs) may contaminate water sources and pose a health risk. Thus, it is important to understand the fate of NPs in order to evaluate potential threats. Here we show that the presence of anions influences the stability of NPs in synthetic and lake water. Concentrations of 0.3 and 3 mM PO43− exhibited stronger stabilizing effects on NPs than 30 mM. Moreover, chloride ions promoted the coagulation of TiO2 NPs over a range of concentrations (0.3–30 mM elicited similar effects). On the other hand, phosphate was found to hinder the coagulation effect. These results are expected to contribute to novel water purification strategies for the efficient removal of NPs. Further experiments should focus on the mechanism of phosphate on the removal of NPs in the coagulation/flocculation/sedimentation (C/F/S) process.
1. Introduction
Nanomaterials have been used for decades in applications ranging from window glass and sunglasses to car bumpers and paints. Huge investments have been made to develop numerous applications of nanoparticles (NPs). Although there are clear benefits to the use of NPs, we have a limited understanding of what happens to them once they are inevitably released into the environment.1–3 The increasing levels of NP production and use in consumer products have raised concerns about the environmental fates and ecological toxicity of NPs.4–6 It was found that most TiO2 NPs are discharged into sewage systems but some of the TiO2 (10–100 μg L−1) remained in the secondary effluents following wastewater treatment.4,7 It has been suggested that landfills, which were previously assumed to be the ultimate sinks for synthetic NPs, may serve as continuous sources of NPs into aquatic environments.8The US Environmental Protection Agency (EPA) issued a report on the potential hazards of nanomaterials to drinking water sources in 2017.9 The International Water Association (IWA) recently included NPs as an emerging pollutant in the drinking water supply for the first time in 2018 (IWA, 2018).10 NPs have been found to contaminate drinking water sources,11 which is a potential route for human exposure, making NPs a potential threat to human health. Westerhoff et al. (2018) showed that the concentration of NPs in drinking water is extremely low and poses only a limited risk to human metabolism but noted that the occurrence and toxicity of NPs in drinking water treatment facilities and water supplies should not be ignored.12
Once NPs enter bodies of water, their destabilization in the water matrix determines the size of the aggregates formed and, thus, influences the fates and toxicity of NPs. Therefore, studies on the destabilization of NPs in natural water environments are necessary. Previous studies have revealed that NP destabilization in an aquatic environment is influenced by the surface characteristics of the NPs,13 the NP size,14 and the pH, ionic strength and ionic species, and dissolved organic matter in the solution.15–19 Additional studies have been done to further investigate how the stability of TiO2 NPs is affected by the presence of ions, such as electrolytes or organic matter, dissolved in pure water (i.e., synthetic water). One group characterized the effects of organic matter (including surfactants) and inorganic ions (such as Na+ and Ca2+) on the NP stability; it was found that the secondary energy minima played a critical role in the deposition mechanisms of nano-TiO2, and the reversibility of the deposition of nano-TiO2 was observed due to changes in the solution chemistry.20 Chen et al. (2006) reported that, although Ca2+ has a stronger effect on the destabilization of hematite, Na+ adversely influences the destabilization by Ca2+ due to competition for adsorption sites.21 Zhang et al. reported that 0.06 M Ca2+ destabilizes NOM-coated metal oxide NPs.22 However, those studies have considered only cations such as Na+ and Ca2+. Domingos et al. (2010) studied the effects of both cations and anions but reported only the individual effects of those ions in isolation.23 PO43− has been shown to destabilize TiO2 NPs when the ionic strength is high;24,25 however, the NP surface charge remained unchanged, which is contrary to the conventional models of NP destabilization. Thus, although there are several studies on the destabilization of NPs in aquatic environments, some questions remain about the interaction and competition between different ions and between ions and organic matter.26 In addition, all of these studies have aimed to elucidate the aggregation process of NPs and, thus, focused on analyzing the properties of the aggregates. However, while the aggregates can be easily settled and removed from the water, it is the NPs that remain suspended in the supernatant after destabilization that will contaminate drinking water sources and pose the greatest risk to public health.12 Hence, it is imperative to investigate the properties of NPs that remain suspended in natural water bodies after destabilization and settling.27
The degree of NP removal from drinking water is determined by the efficacy of the water treatment process, which generally includes coagulation, flocculation, sedimentation, and filtration.28–32 Different NPs are generally removed at different rates depending on the particle size, surface properties, and original concentration. Wastewater treatment operations with the highest potential for removing NPs are primary and secondary sedimentation tanks.33,34 However, wastewater contains surfactants and natural organic matter, which may hinder the removal of NPs from wastewater.7,35,36 The types of ions, ionic strength, pH, alkalinity, and presence of natural organic matter also influences the process. It has been shown that coagulation is a promising option for the removal of TiO2 NPs from water. Wang et al. (2013) found that polyferric sulfate (PFS) at 0.3 mM can remove about 84% of TiO2 NPs (initial concentration 30 mg L−1) with less pH reduction than alternative methods. In addition, Abbott Chalew (2013) studied the removal efficiencies of various NPs at an initial concentration of 1 mg L−1 by conventional treatment processes. It was found that in the coagulation process, Ag, TiO2, and ZnO NPs could be removed at rates of 80–98%, 92–97%, and 1–52%, respectively.37 After coagulation, microfiltration removed 55–99% of the Ag NPs, 56–100% of the TiO2 NPs, and 17–64% of the ZnO NPs. The ultrafiltration removed 98–100% of the Ag NPs, 96–100% of the TiO2 NPs, and 4–98% of the ZnO NPs. The NP removal rates by membrane filtration depended on the NP stability, with aggregated NPs being removed more effectively than stable NPs and dissolved NP ions. Other studies have further demonstrated that, although the majority of aggregated NPs can be removed by conventional and advanced treatments, NP metals remain in the treated water.38–40 Thus, the type of coagulant and the initial water quality should be taken into consideration in the removal of NPs from aquatic environments.41
In eutrophicated water, anions such as phosphate may influence the stability of the nanoparticles. However, the influence of monovalent, divalent and trivalent anions on NPs stability have not been investigated. In this context, herein, we consider the use of anions to influence the stability of NPs and improve the NP removal efficiency by coagulation.
2. Materials and methods
Rutile nano-powder was purchased from Sigma Aldrich, the purity of which was 99.5% based on trace metals analysis. The nominal particle size was smaller than 100 nm, which was confirmed by transmission electron micrograph (Fig. S1†). The BET showed the surface area was 37.5 m2 g−1.2.1 Evaluation of NP stability in electrolyte solutions
Electrolyte solutions (NaCl, Na2SO4, and Na2HPO4/NaH2PO4 solutions) were prepared at concentrations of 0.3, 3, and 30 mM (the three types of electrolytes and three concentration levels resulted in a total of nine types of solutions). The volume of each solution containing a single species of electrolyte was 500 mL. Then, 10 mg of TiO2 NPs was added to each solution to yield a 20 mg L−1 solution. A control solution was also prepared by accurately adding 10 mg of TiO2 NPs to Milli-Q water. First, each solution was completely mixed using a magnetic stirrer and then left undisturbed for 12 h. Note that 12 hours was considered adequate for solutions to reach equilibrium, and this condition was similar to that of lake water featuring relatively slow water circulation.42 The magnetic stirrer was stopped after the initial sample was taken, allowing the particles to settle via gravitational settling during the 12 h. After allowing the NPs to settle, a 5 mL aliquot was taken from the supernatant of each sample (1 cm from the water surface). The pH values of the solutions and the concentrations, particle size distributions, and ζ-potentials of the TiO2 NPs were measured. During the experiments, the beakers were capped with vinyl membranes to avoid evaporation. The ambient temperature was 25 ± 2 °C.2.2 Coagulation jar test
A jar test experiment was employed in this study to evaluate the removal efficiency of the NPs in the solution. FeCl3 was used as coagulant, and NaHCO3 was used to adjust the pH and generalize Fe(OH)3. The 50 mM NaHCO3 and FeCl3 stock solutions were prepared separately using analytical grade reagents (1.350 g FeCl3·6H2O (MW: 270.3) was added to 100 mL of Milli-Q water to prepare the 50 mM FeCl3 solution and 0.420 g NaHCO3 (MW: 84.01) was added to 100 mL of mill-Q water to produce 50 mmol L−1 NaHCO3 solution).In the coagulation experiments, the stock solutions were added to each NP–electrolyte solution described above to form concentrations of 0.2 mM Fe and 1.0 mM NaHCO3. In the same way, coagulation was performed on natural lake water with 20 mg L−1 dispersed TiO2 NPs to evaluate the NP removal efficiency. Herein, a lake water sample near the city of Changchun was used to evaluate the coagulation removal efficiency of the nanoparticles. A total of 10 mg of TiO2 NPs were added to 500 mL of the lake water to produce a 20 mg L−1 solution. Each solution was rapidly mixed at 200 rpm for 2 min followed by slow mixing at 30 rpm for 30 min. The velocity gradient (G) was decreased from the rapid mixing period (G: 125.9 s−1, GT 22662) to the slow mixing period (G: 7.3 s−1, GT 35802). The turbidity and TiO2 concentration were analyzed after 30 min of gravitational settling.
2.3 Evaluation methods
The particle sizes were measured using a dynamic light scattering instrument (Bettersize 2000; Baite, Dandong, CN). The zeta potential was analyzed using a zeta-potential analyzer (ZS90, Malvern, UK). The turbidity was analyzed using a portable turbidity meter (WGZ-200B, Qiwei, CN).TiO2 concentration was determined based on the correlation between turbidity and concentration, as described by Wang et al. (2013).41 All samples were tested in triplicate.
The phosphate concentration was determined using an ammonium molybdate spectrophotometry method (GB/T11893-1989) with a detection limit of 0.01 mg L−1.
Fluorescence excitation–emission matrix (F-EEM) profiles were measured using a fluorescence spectrophotometer (F-4500; Hitachi, Japan) at excitation and emission wavelengths in the ranges of 220–450 and 230–550 nm, respectively, in intervals of 5 nm. Milli-Q was used as the blank sample.
The level of dissolved organic carbon (DOC) was analyzed based on the non-purgeable organic carbon method using a total organic carbon analyzer (TOC-L, Shimadzu, Japan). All samples were filtered through a 0.45 μm polytetrafluoroethylene membrane before analysis.
3. Results and discussion
3.1 Kinetic changes in the NP concentrations and ζ-potential
As shown in Fig. 1, NP ζ-potential was negative after being dispersed in each electrolyte. The ζ-potential was similar in the Cl− and SO42− solutions; while it was expected that the SO42− would provide more negative charge to the rutile NPs, the data revealed that those in the Cl− solution were slightly more negative. On the other hand, the NPs in the PO43− solution had more negative ζ-potentials (mostly below −25 mV) than those in the Cl− and SO42− solutions.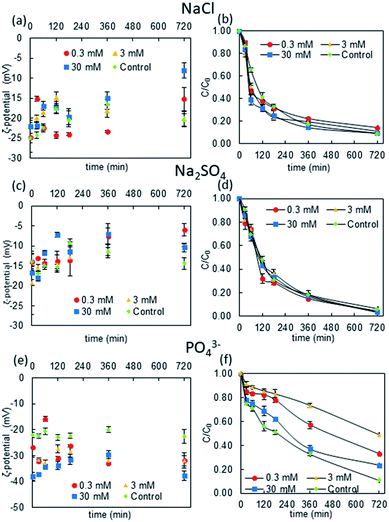 | ||
| Fig. 1 Changes in the ζ-potential and NP concentration over time in different electrolytes (20 mg L−1 rutile NPs). | ||
Moreover, the ζ-potential was more negative in higher PO43− concentrations in the first 240 min after the initial mixing, and it decreased to the same ζ-potential as in solutions with lower ionic strengths thereafter. This phenomenon could be attributed to the adsorption and desorption of PO43− ions, i.e., the highest ionic strength (30 mM electrolyte concentration) caused strong ion adsorption, giving an initial ζ-potential of around −40 mV, but then the NPs stabilized after about 12 h.42 On the other hand, lower ionic strengths (0.3–3 mM electrolyte concentrations) cause slower adsorption: anions progressively become attached to the NP surfaces so the ζ-potential becomes more negative over time.
The differences between the ζ-potentials of NPs in PO43−, Cl−, and SO42− were attributed to the different ion-complexation modes. Cl− and SO42− are relatively inert anions and their attachment to the surfaces of rutile NPs is considered to be outer-sphere complexation, which is relatively weak and can be easily reversed. However, the adsorption of PO43− ions is considered to be inner-sphere complexation, which is generally strong and results in a more negative charge on the NPs. Thus, the ζ-potential changes more significantly in the presence of PO43− ions than with Cl− and SO42− ions.
The kinetic changes in the NP concentration over time further suggested that PO43− has the strongest stabilizing effect on rutile NPs. This implies that the negative charges on the NPs may cause repulsive forces between the NPs. On the other hand, in Cl− and SO42− solutions, the NP concentration was similar to that in the control solution without anions after 12 hours. This indicates that the anions adsorbed via inner-sphere complexation did not induce a strong stabilizing effect on the NPs.
3.2 NP stability in terms of DLVO energy
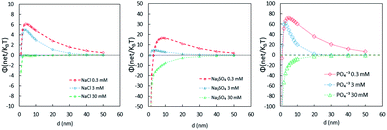
To further understand the stabilizing effect of PO43−, the interactive force was measured in terms of the Derjaguin–Landau–Verwey–Overbeek (DLVO) energy barrier. The DLVO interaction energy of the TiO2 NPs in each solution was calculated according to the following equation under the assumption of identically sized spheres:
 | (1) |
The parameters used in eqn (1) are listed in Table S1 in ESI.†
Fig. 2 shows that the energy barrier provided by NaCl was much lower than that with PO43−. In addition, 0.3 and 3 mM PO43− have stronger stabilizing effects than 30 mM. It was previously thought that the higher the PO43− concentration is, the more stability it imparts to the NPs;23,43,44 however, these results show that higher concentrations of PO43− increase the ionic strength, which reduces the energy barrier to less than zero. This indicates that, given the conditions, P is in a certain range in the water environment, where the NPs would likely be stably dispersed in the aquatic environment and would not settle. This finding may be useful to those who study the toxicological effects of nanoparticles, because in an aquatic environment, there is a synergistic effect of phosphate and NPs on the toxicity of microorganisms. The lowest concentration of P in this study is 0.3 mM, and in some algal bloom water bodies in China, such a concentration of P is possibly present.45 In such a case, the effect of phosphate on NPs may become a concern.
3.3 Particle size distribution over time
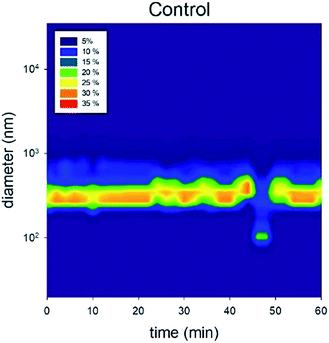
The number-based distribution of NP size is shown in Fig. 3 and 4. Note that the measured sizes are those of the TiO2 NPs that remained suspended in the supernatant after settling; the particles that settled to the bottom of the vial were not characterized. In the control solution containing 20 mg L−1 of rutile NPs, the size distribution was relatively uniform with a particle size of approximately 300 nm.46 A deviation occurred at 45 min because the large particles sedimented and only the relatively small particles were observed.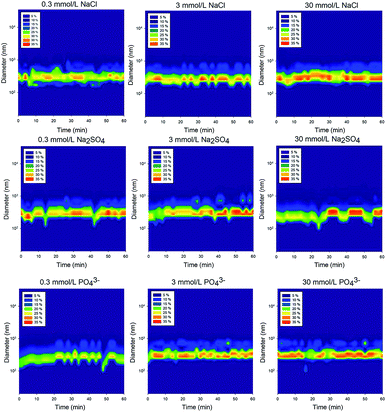 | ||
| Fig. 4 Number-based particle size distribution after dispersion in different of electrolytes of various concentrations (20 mg L−1 rutile NPs). | ||
The unstable phase of the TiO2 NPs size distribution in the nine types of electrolyte solutions may indicate that the particles are undergoing an aggregation process.44,47 It is generally believed that the particles are first stable in the solution and then start to aggregate under the influence of NaCl and Na2SO4. When these aggregates grow large enough, they settle from the supernatant. During this process, the particle size varies.
Compared to the uniform size distribution of NPs in the control solution, those in solutions containing Cl−, SO42− and PO43− of different ionic strengths were in more discrete size ranges. However, there was no significant difference between the particle size distributions in the different electrolytes of different ionic strengths, which implies that the NP stability cannot be solely evaluated based on changes in particle size distributions. The total interactive energy likely has a stronger influence than the particle size on the stability of NPs in aquatic environments.48
The variations indicate that aggregation and agglomeration are constant processes during the settling period, and even though the size of the particles may change, the average size distribution remains between 100 nm and 300 nm (Fig. 4). Therefore, even though there have been studies focusing on changes in the nanoparticle size, in the supernatant, the size of the nanoparticles does not change drastically. The reason why the size did not change significantly was that aggregation and disaggregation occurred simultaneously. When a proportion of the particles tended to become larger through aggregation at a time span, the disaggregation offset the effect. Thus, for the whole process, the variation in the size-distribution Fig. 4 did not lead to a significant variation in the mean size of the nanoparticles.24 Future studies should focus on different layers to evaluate the size changes as opposed to only focusing on the particle size changes in a certain layer in the supernatant.
3.4 Removal efficiency of NPs from synthetic and natural water
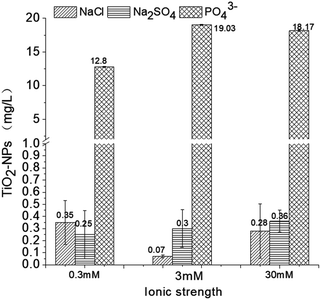
According to the above data, the presence of chloride ions promotes the coagulation of TiO2 NPs. Moreover, electrolyte concentrations of 0.3 and 30 mM have relatively similar effects while a concentration of 3 mM has the strongest influence on NP stability. It is known that the presence of sulfate ions slightly inhibits the coagulation effect of ferric chloride on TiO2 NPs; further, this inhibitory effect is gradually weakened as the ionic strength increases.19,41After sedimentation, the TiO2 NP concentration in the control solution was ∼0.13 ± 0.01 mg L−1. In the NaCl electrolyte solution (0.3, 3, and 30 mM), the concentrations after coagulation were 0.35 ± 0.18, 0.07 ± 0.01, and 0.28 ± 0.22 mg L−1, respectively. However, it is still unclear why Cl− would enhance the removal of TiO2 NPs; we conclude that the Cl− may help compress the double layer of TiO2 NPs, which helps the nanoparticles to form flocs under the effect of a coagulant.2,49 The 0.3, 3, and 30 mM Na2SO4 solutions would bring the TiO2 concentrations to 0.25 ± 0.20, 0.30 ± 0.15, and 0.36 ± 0.09 mg L−1, respectively, and the inhibitory effect of the sulfate ions on the coagulation is attributed to the complex between the sulfate and the monomers.50 Future studies should focus on the ζ-potential change during coagulation to evaluate the change in the energy barrier. Similarly, as shown in Fig. 5, the presence of PO43− ions greatly inhibits the effects of ferric chloride on the TiO2 NPs and counteracts the coagulation induced by ferric chloride. Even a lower concentration of P (0.3 mM) would inhibit the coagulation effect likely due to the outer-sphere complexation.42 In this case, there would still be some effects due to the coagulant. If we add more coagulant, the NP removal efficiency could be improved. However, when the phosphate concentration rises to 3 mM and 30 mM, the complexation will become inner-sphere complexation, NPs and phosphate will bind as one object, and the redundant phosphate in the solution may react with the coagulant; in this case, the removal efficiency of the NPs will not be improved by adding more coagulants.
The initial pH of the lake water was 7.42, and the concentration of PO43− was 0.09 mg L−1. The EEM spectra in Fig. 6 show that the organic matter intensity decreased, meanwhile DOC decreased from 7.68 to 4.81 mg L−1 upon coagulation. This removal efficiency was lower than expected. Also, the PO43− concentration decreased from 0.09 to 0.04 mg L−1, and the TiO2 concentration decreased from 20 to 0.62 mg L−1. In general, coagulation could not efficiently remove the organic matters.51 Additionally, the low efficiency in the removal of organic matters could be attributed to the interference by PO43−, i.e., part of Fe reacted with PO43− and formed precipitates, and hence did not work effectively as coagulant. In the lake water, it was possible that P induced the pelagic organisms, which further influenced the coagulation process.52 However, additional experiments need to be carried out to confirm the speculation.
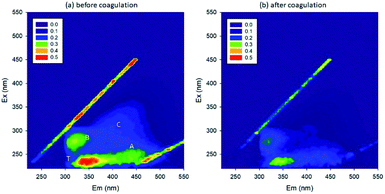 | ||
| Fig. 6 EEM spectra (a) before and (b) after coagulation (A: fulvic-like, B: microbial products, C: humic-like, T: protein-like). | ||
4. Conclusions
In this study, we evaluated the kinetics of the NP concentration in the presence of different anions. It was found that 0.3 and 3 mM PO43− have stronger stabilizing effects than 30 mM. Although many studies have focused on the change in particle size, we found particle size may not be the most effective factor in evaluating the effectiveness of NP stabilization. We would recommend analyzing the concentrations of NPs in different layers of the solution in future studies to have a three-dimensional view of the NPs distribution.To the best of our knowledge, no other reports have noted the inhibitory effect of PO43− on the removal of TiO2 NPs from water. Another implication is that the synergistic toxicological effect of phosphate and TiO2 NPs should be studied because we found that a low concentration (0.3 mM) of phosphate could be able to stabilize TiO2 NPs.
We showed Cl− enhances the coagulation efficiency while SO42− and PO43− hinder the effectiveness of the coagulation in terms of the NP concentration and dissolved TiO2 concentration, respectively. To the best of our knowledge, no other reports have noted the inhibitory effect of PO43− on the removal of TiO2 NPs from water. Another implication is that the synergistic toxicological effect of phosphate and TiO2 NPs should be studied because we found that a low concentration (0.3 mM) of phosphate could be able to stabilize TiO2 NPs.
With the rapid development of industrial applications of NPs, NPs will inevitably enter aquatic environments. Thus, there is an urgent need for an efficient way to remove the NPs. Along with studies on the mechanisms of NP aggregation in aquatic environments, it is also important to study ways to improve the NP removal efficiency. Thus, additional studies should be done to assess the effect of PO43− on the removal of NPs.
Funding
This work was funded partially by Natural Science Foundation of Jilin Province (No. 20180520219JH), and this work was also supported by the 111 Project: B16020.Conflicts of interest
The authors declare no conflict of interest.Acknowledgements
The authors would like to give thanks to Dr Chunxin Lv in the assistance of the experiment.References
- G. E. Schaumann, A. Philippe, M. Bundschuh, G. Metreveli, S. Klitzke, D. Rakcheev, A. Grün, S. K. Kumahor, M. Kühn, T. Baumann, F. Lang, W. Manz, R. Schulz and H. J. Vogel, Sci. Total Environ., 2015, 535, 3–19 CrossRef CAS PubMed.
- Y. Nur, J. R. Lead and M. Baalousha, Sci. Total Environ., 2015, 535, 45–53 CrossRef CAS PubMed.
- Z.-J. Zhu, H. Wang, B. Yan, H. Zheng, Y. Jiang, O. R. Miranda, V. M. Rotello, B. Xing and R. W. Vachet, Environ. Sci. Technol., 2012, 46, 12391–12398 CrossRef CAS PubMed.
- A. B. a Boxall, K. Tiede and Q. Chaudhry, Nanomedicine, 2007, 2, 919–927 CrossRef PubMed.
- W. Shi, Y. Han, C. Guo, W. Su, X. Zhao, S. Zha, Y. Wang and G. Liu, Sci. Rep., 2019, 9, 3516 CrossRef.
- B. Nowack and T. D. Bucheli, Environ. Pollut., 2007, 150, 5–22 CrossRef CAS.
- M. A. Kiser, P. Westerhoff, T. Benn, Y. Wang, J. Pérez-Rivera and K. Hristovski, Environ. Sci. Technol., 2009, 43, 6757–6763 CrossRef CAS.
- X. He, D. M. Mitrano, B. Nowack, Y. K. Bahk, R. Figi, C. Schreiner, M. Bürki and J. Wang, Environ. Pollut., 2017, 223, 616–623 CrossRef CAS PubMed.
- EPA, Technical Fact Sheet – Nanomaterials, 2017 Search PubMed.
- International Water Association (IWA), Shaping Our Water Future World Water Congress & Exhibition 2018, http://worldwatercongress.org/programme/, accessed 16 September 2018.
- C. M. Park, K. H. Chu, N. Her, J. Min, B. Mohammed, H. Jiyong and Y. Yoon, Sep. Purif. Rev., 2017, 46, 255–272 CrossRef CAS.
- P. Westerhoff, A. Atkinson, J. Fortner, M. S. Wong, J. Zimmerman, J. Gardea-Torresdey, J. Ranville and P. Herckes, Nat. Nanotechnol., 2018, 13, 661–669 CrossRef CAS PubMed.
- Y. Zhang, Y. Chen, P. Westerhoff, K. Hristovski and J. C. Crittenden, Water Res., 2008, 42, 2204–2212 CrossRef CAS PubMed.
- J. M. Pettibone, D. M. Cwiertny, M. Scherer and V. H. Grassian, Langmuir, 2008, 24, 6659–6667 CrossRef CAS PubMed.
- M. Chen, N. Xu, C. Christodoulatos and D. Wang, Environ. Pollut., 2018, 243, 1368–1375 CrossRef CAS PubMed.
- R. A. French, A. R. Jacobson, B. Kim, S. L. Isley, L. Penn and P. C. Baveye, Environ. Sci. Technol., 2009, 43, 1354–1359 CrossRef CAS.
- V. K. Sharma, J. Environ. Sci. Health, Part A: Toxic/Hazard. Subst. Environ. Eng., 2009, 44, 1485–1495 CrossRef CAS PubMed.
- R. F. Domingos, N. Tufenkji and K. J. Wilkinson, Environ. Sci. Technol., 2009, 43, 1282–1286 CrossRef CAS PubMed.
- A. A. Keller, H. Wang, D. Zhou, H. S. Lenihan, G. Cherr, B. J. Cardinale, R. Miller and J. I. Zhaoxia, Environ. Sci. Technol., 2010, 44, 1962–1967 CrossRef CAS PubMed.
- I. G. Godinez and C. J. G. Darnault, Water Res., 2011, 45, 839–851 CrossRef CAS PubMed.
- K. L. Chen, S. E. Mylon and M. Elimelech, Environ. Sci. Technol., 2006, 40, 1516–1523 CrossRef CAS PubMed.
- Y. Zhang, Y. S. Chen, P. Westerhoff and J. Crittenden, Water Res., 2009, 43, 4249–4257 CrossRef CAS PubMed.
- R. F. R. F. Domingos, C. Peyrot and K. J. K. J. Wilkinson, Environ. Chem., 2010, 7, 61–66 CrossRef CAS.
- C. Zhang, J. Lohwacharin and S. Takizawa, Sci. Rep., 2017, 7, 9943 CrossRef PubMed.
- F. Liu, C. Zhang, T. Zhao, Y. Zu, X. Wu, B. Li, X. Xing, J. Niu, X. Chen and C. Qin, Chemosphere, 2019, 224, 580–587 CrossRef CAS PubMed.
- J. Liu, S. M. Louie, C. Pham, C. Dai, D. Liang and Y. Hu, Environ. Res., 2019, 172, 552–560 CrossRef CAS PubMed.
- D. L. Slomberg, P. Ollivier, H. Miche, B. Angeletti, A. Bruchet, M. Philibert, J. Brant and J. Labille, Sci. Total Environ., 2019, 656, 338–346 CrossRef CAS PubMed.
- R. Khan, M. Inam, D. Park, S. Zam Zam, S. Shin, S. Khan, M. Akram and I. Yeom, Processes, 2018, 6, 170 CrossRef.
- R. Khan, M. A. Inam, M. M. Iqbal, M. Shoaib, D. R. Park, K. H. Lee, S. Shin and S. Khan, Sustainability, 2019, 11, 1–22 Search PubMed.
- A. Rosińska and L. Dąbrowska, Water, 2018, 10, 886 CrossRef.
- C. Zhang, Y. Fan, X. Wang, X. Xing, X. Chen, J. Zhang and J. Bian, Chem. Lett., 2017, 46, 1846–1848 CrossRef CAS.
- C. Zhang, J. Lohwacharin and S. Takizawa, Environ. Eng. Sci., 2018, 35, 420–429 CrossRef CAS.
- D. Li, F. Cui, Z. Zhao, D. Liu, Y. Xu, H. Li and X. Yang, Biodegradation, 2014, 25, 167–177 CrossRef CAS PubMed.
- A. Azimzada, N. Tufenkji and K. J. Wilkinson, Environ. Sci.: Nano, 2017, 4, 1339–1349 RSC.
- S. Hackenberg, A. Scherzed, M. Kessler, S. Hummel, A. Technau, K. Froelich, C. Ginzkey, C. Koehler, R. Hagen and N. Kleinsasser, Toxicol. Lett., 2010, 201, 27–33 CrossRef PubMed.
- E. T. Hwang, J. H. Lee, Y. J. Chae, Y. S. Kim, B. C. Kim, B.-I. Sang and M. B. Gu, Small, 2008, 4, 746–750 CrossRef CAS PubMed.
- T. E. Abbott Chalew, G. S. Ajmani, H. Huang and K. J. Schwab, Environ. Health Perspect., 2013, 121, 1161–1166 CrossRef CAS PubMed.
- S. Sun, M. Weber-Shirk and L. W. Lion, Environ. Eng. Sci., 2016, 33, 25–34 CrossRef CAS.
- K. M. Mousa and H. J. Hadi, Int. J. Curr. Eng. Technol., 2016, 6, 551–555 Search PubMed.
- V. Serrão Sousa, C. Corniuc and M. Ribau Teixeira, Water Res., 2017, 109, 1–12 CrossRef PubMed.
- H. T. Wang, Y. Y. Ye, J. Qi, F. T. Li and Y. L. Tang, Water Sci. Technol., 2013, 68, 1137–1143 CrossRef CAS PubMed.
- S. A. Kang, W. Li, H. E. Lee, B. L. Phillips and Y. J. Lee, J. Colloid Interface Sci., 2011, 364, 455–461 CrossRef CAS PubMed.
- N. Xu, X. Cheng, D. Wang, X. Xu, X. Huangfu and Z. Li, Water Res., 2018, 146, 264–274 CrossRef CAS PubMed.
- L. Li, M. Sillanpää and M. Risto, Environ. Pollut., 2016, 219, 132–138 CrossRef CAS PubMed.
- H. Zhang, Z. Cao, Q. Shen and M. Wong, Chemosphere, 2003, 50, 695–701 CrossRef CAS PubMed.
- K. Suttiponparnit, J. Jiang, M. Sahu, S. Suvachittanont, T. Charinpanitkul and P. Biswas, Nanoscale Res. Lett., 2010, 6, 1–8 Search PubMed.
- X. Liu, G. Chen and C. Su, J. Colloid Interface Sci., 2011, 363, 84–91 CrossRef CAS PubMed.
- Y. S. Cheng and Y. Zhou, Aerosol Sci. Technol., 2017, 51, 972–980 CrossRef CAS.
- W. Janusz, Mater. Chem. Phys., 1989, 24, 39–50 CrossRef CAS.
- D. Wang, H. Tang and J. Gregory, Environ. Sci. Technol., 2002, 36, 1815–1820 CrossRef CAS PubMed.
- M. Sillanpää, M. C. Ncibi, A. Matilainen and M. Vepsäläinen, Chemosphere, 2018, 190, 54–71 CrossRef PubMed.
- H. T. Yap, J.-A. von Oertzen and U. Schiewer, Cont. Shelf Res., 1987, 7, 1439–1444 CrossRef.
Footnote |
| † Electronic supplementary information (ESI) available. See DOI: 10.1039/c9ra02419k |
| This journal is © The Royal Society of Chemistry 2019 |

