
 Open Access Article
 This Open Access Article is licensed under a Creative Commons Attribution-Non Commercial 3.0 Unported Licence
A smart fluorescent biosensor for the highly sensitive detection of BRCA1 based on a 3D DNA walker and ESDR cascade amplification†
Hongmin Ma‡
,
Bin Guo‡,
Xiaoyu Yan,
Tong Wang,
Haiying Que,
Xiufeng Gan,
Ping Liu and
Yurong Yan *
*
Key Laboratory of Clinical Laboratory Diagnostics (Ministry of Education), College of Laboratory Medicine, Chongqing Medical University, Chongqing 400016, China. E-mail: yanyurong163@163.com; yanyurong@cqmu.edu.cn; Fax: +86-23-68485786; Tel: +86-23-68485688
First published on 20th June 2019
Abstract
Nucleic acid analysis plays an important role in the diagnosis of diseases. There is a continuous demand to develop rapid and sensitive methods for the specific detection of nucleic acids. Herein, we constructed a highly sensitive and rapid fluorescent biosensor for the detection of BRCA1 by coupling a 3D DNA walker machine with spontaneous entropy-driven strand displacement reactions (ESDRs). In this study, the 3D DNA walker machine was well activated by the target DNA; this resulted in the cyclic utilization of the target DNA and the release of intermediate DNAs. Subsequently, the free intermediate DNAs triggered the circulation process of ESDRs with the help of the assistant probe A, leading to a significant enhancement of the fluorescence intensity. Due to the robust execution of the 3D DNA walker machine and highly efficient amplification capability of ESDRs, the developed biosensing method shows a wide linear range from 0.1 pM to 10 nM with the detection limit as low as 41.44 fM (S/N = 3). Moreover, the constructed biosensor displays superior specificity and has been applied to monitor BRCA1 in complex matrices. Thus, this elaborated cascade amplification biosensing strategy provides a potential platform for the bioassays of nucleic acids and the clinical diagnosis of diseases.
1. Introduction
The accurate analysis of nucleic acids is fundamentally important in the diagnosis,1 therapeutics2 and biological differentiation3 of diseases. However, low concentrations of target DNA or RNA in biological samples present a great challenge for analytical technology.4,5 Although non-isothermal amplification techniques, such as the polymerase chain reaction (PCR), the digital polymerase chain reaction (dPCR) and so on, are among the most widely used methods for biomolecular detection, researchers continue to seek an isothermal amplification-based strategy capable of adapting to the requirements of nucleic acid detection in various environments. Therefore, various studies have been employed to explore novel biosensing methods for the precise analysis of nucleic acids.6,7 For example, Li's team established a new DNA colorimetric sensing strategy by conjugating graphene oxide with DNA-modified gold nanoparticles for the detection of DNA.8 However, these biosensing strategies still cannot meet the needs of low-abundance target molecule detection due to their insufficient sensitivity.To overcome this drawback, substantial signal amplification strategies, including rolling circle amplification,9 the ligase chain reaction,10 the hairpin-based amplification assay11,12 and a molecular machine-based assay,13,14 have been developed to improve the analytical performance. In particular, the development of DNA walker machines has drawn extensive attention due to their precise controllability along a designated trace.15,16 However, conventional one-dimensional (1D) or two-dimensional (2D) DNA walker machines usually have common defects such as low mobility and less cargo payload.17,18 Impressively, three-dimensional (3D) DNA machines, with effective cargo-loading capacity and rapid target-recycling kinetics, show more prominent amplification performance. Furthermore, via highly efficient catalysis of proteases, the multistep movement of the cargo instead of a single step can be achieved in the 3D DNA machine.19,20 For example, Li's group designed a nicking endonuclease-driven 3D DNA walker machine and explored its isothermal, rapid and homogeneous advantages to detect specific nucleic acids.21 However, only a single recycling amplification strategy was adopted in the design, which limited the signal enhancement.
Due to the abovementioned issues, a number of cascade signal amplification strategies have been extensively developed to further improve the performance of detection.22,23 In 2017, Chen's group developed an electrochemiluminescence (ECL) biosensor based on a DNA walker and rolling circle amplification (RCA), achieving ultrasensitive and specific detection of the K-ras gene.24 Subsequently, Jiang et al. constructed a fluorescent biosensor based on a DNAzyme-powered three-dimensional DNA walker and hybridization chain reaction (HCR), achieving enzyme-free and label-free detection of miRNAs.25 In these studies, various cascaded circuit products from the first DNA-based circuit served as the input/trigger for the second DNA-based circuit and resulted in further signal enhancement. It is undeniable that these strategies have improved the sensitivity of detection to some extent. However, these methods also have some limitations. For instance, the RCA reaction requires the participation of multiple proteases and time-consuming template preparation, which limit the application of RCA in practice. The hybridization chain reaction, involving complicated secondary structures of hairpin and laborious sequence design, usually produces a higher background signal.26,27
Compared to the hairpin-based designs, entropy-driven strand displacement reactions (ESDRs)28–30 employ a series of single-stranded DNA to perform multiple hybridization and separation in the catalytic circuit via toehold-assisted strand migration. More importantly, the design of ESDRs, which does not involve complex secondary structures, is relatively simple and fast. For instance, Chen's group introduced ESDRs into a electrochemiluminescence platform to achieve the ultrasensitive detection of target DNA.31 Furthermore, due to the good biocompatibility of ESDRs, Chen and co-workers constructed a cascade reaction by coupling strand displacement amplification with ESDRs for the rapid and ultrasensitive detection of microRNA.32 Altogether, as a valuable tool for nucleic acid amplification, ESDR assays are receiving significant attention due to their inherent advantages including excellent thermostability, high amplification efficiency and robust resistance to complex environments.
Inspired by the high cargo payload ability of DNA walker machines and excellent amplification effectiveness of ESDRs, a smart fluorescence biosensing strategy was developed for nucleic acid detection using the BRCA1 gene as a model. By integrating a 3D DNA walker machine and ESDRs, the sensitivity of the DNA detection was significantly enhanced, and the signal-to-noise ratio was obviously improved. Furthermore, due to the superb discriminative ability of toehold-mediated strand displacement reaction (TMSDR), this biosensing strategy shows high specificity. To the best of our knowledge, this is the first attempt to combine a 3D DNA walker with ESDR assays for BRCA1 detection, which may present a promising tool for nucleic acid analysis in biochemical studies and clinical diagnosis.
2. Experimental
2.1 Materials and reagents
Streptavidin-magnetic beads (1 μm diameter, 4 mg mL−1, an aqueous suspension containing 0.1% bovine serum albumin, pH 7.4, 0.05% Tween-20, and 0.05% NaN3), nicking endonuclease (Nb.BbvCI) and 10× CutSmart™ buffer (20 mM, Tris-acetate, 500 mM potassium acetate, 10 mM magnesium acetate, and 100 μg mL−1 BSA, pH 7.9) were purchased from New England Biolabs (Beijing, China). Gold View I (GV I) (10![[thin space (1/6-em)]](https://www.rsc.org/images/entities/char_2009.gif) 000×) used in this study was provided by Solarbio Co. Ltd. (Xiamen, China). The DL 200 DNA marker was ordered from Takara (Dalian, China). Salmon sperm DNA was obtained from Solarbio Inc. (Beijing, China). All oligonucleotides were synthesized and purified via HPLC by Sangon Biotechnology Co. Ltd. (Shanghai, China), and the corresponding sequences are illustrated in Table S1 (ESI).† All oligonucleotides were dissolved in tris-ethylenediaminetetraacetic acid (TE) buffer (pH 8.0, 10 mM Tris–HCl, 1 mM EDTA) and stored at −20 °C for further use.
000×) used in this study was provided by Solarbio Co. Ltd. (Xiamen, China). The DL 200 DNA marker was ordered from Takara (Dalian, China). Salmon sperm DNA was obtained from Solarbio Inc. (Beijing, China). All oligonucleotides were synthesized and purified via HPLC by Sangon Biotechnology Co. Ltd. (Shanghai, China), and the corresponding sequences are illustrated in Table S1 (ESI).† All oligonucleotides were dissolved in tris-ethylenediaminetetraacetic acid (TE) buffer (pH 8.0, 10 mM Tris–HCl, 1 mM EDTA) and stored at −20 °C for further use.
Moreover, 0.1 M phosphate-buffered solution (PBS) included 136.89 mM NaCl, 2.67 mM KCl, 8.10 mM Na2HPO4 and 1.76 mM KH2PO4 (pH 7.4). The reaction buffer contained 10 mM Tris–HCl, 1 mM EDTA and 12.5 mM MgCl2 (pH 8.0). Other chemicals (analytical grade) were obtained from standard reagent suppliers. Millipore-Q water (≥18 MΩ, Milli-Q, Millipore) was used throughout the experiments.
2.2 Instrumentations
Fluorescence signals were obtained using the Cary Eclipse Fluorescence spectrophotometer (Agilent, California). The concentrations of DNA suspensions were measured using the NanoDrop 1000 spectrophotometer (Thermo Scientific, Wilmington, DE, USA). Gel electrophoresis was carried out using the DYY-6C electrophoresis analyzer (Liuyi Instrument Company, China), and the image was acquired using the Bio-Rad ChemDoc XRS (Bio-Rad Laboratories, USA). Furthermore, the Bio-Rad T100 thermal cycler (Bio-Rad, USA) was used as a temperature control device in this study.2.3 Preparation of SDs-PWTs-SMBs
Before use, 10 μM biotin-modified DNA walker tracks (DWTs) and 10 μM protecting probe (PP) were dissolved in TE buffer at equal volumes. The resulting mixture was incubated at 90 °C for 10 min and then gradually cooled down to room temperature to form the protected DNA walker probe (PWTs, 5 μM). Then, 12.5 μL SMBs was washed three times with PBS and then redispersed in 41.75 μL of the same buffer. The PWTs and biotin-modified substrate strands of DNA (SDs) at the ratio of 1 to 20 were sufficiently mixed and then added to the SMB solution for 30 min at 37 °C. Due to the specific interaction between streptavidin and biotin, the biotin-modified DNA were firmly bound to the streptavidin SMBs to obtain a mixing solution (PWTs-SDs-SMBs) containing 75 nM PWTs and 1.5 μM SDs.2.4 Preparation the P–L–S complex probes of ESDRs
The BRCA1 gene sequence was designed on the basis of reported studies.33 Before conducting the formal experiment, P–L–S three-stranded complex probes of ESDRs were first prepared with single strands of L, P and S at the molar concentration ratio of 1.2:1:1.2 in a reaction buffer. Then, the solution was heated to 80 °C for 5 min and cooled down to room temperature gradually. Finally, the probes were stored at 4 °C for further use.
2.5 Fluorescence spectrophotometer analysis
The DNA walker amplification reaction was initiated by adding 1 μL of various concentrations of target gene, 12.5 μL of 75 nM SDs-PWTs-SMBs, 1 μL of 10 U μL−1 Nb.BbvCI, 5 μL 10× CutSmart buffer and 30.5 μL ultrapure water. The final volume was 50 μL. The DNA nanomachine was operated at 37 °C for 20 min. The supernatant was used to trigger the ESDRs at ambient temperature for 40 min in the solution containing 25 μL of 800 nM P–L–S and 25 μL of 800 nM assistant probe A. The ESDR products were measured by a fluorescence spectrophotometer in the wavelength range from 500 to 600 nm with the excitation wavelength at 492 nm. Both the excitation and emission slits were chosen to be 5 nm.2.6 Validation of the amplification strategy by gel electrophoresis
Native polyacrylamide gel electrophoresis (PAGE) on 8% polyacrylamide gel was used to validate the designed novel fluorescent biosensor. Electrophoresis was conducted with 1× TBE buffer (89 mM Tris, 89 mM boric acid, and 2 mM EDTA) at pH 8.3 and 100 V constant voltage for 40 min. After this, the gel was stained with GV I for 30 min and then imaged using a Bio-Rad ChemDoc XRS (Bio-Rad, USA).3. Results and discussion
3.1 The principle of the cascade amplification strategy
Our detection scheme for BRCA1 can be mainly divided into two portions: the DNA walker step and the subsequent ESDRs step. As illustrated in Scheme 1, the recognition sequence of Nb.BbvCI located on the DWTs was originally sealed by the PP. The PP involved a DNA overhang, working as a toehold. Abundant T bases were included in the DWTs as spacers to reduce steric hindrance. The DWTs partially hybridized with the PP to form PWTs. Subsequently, the PWTs were mixed with SDs at appropriate proportions and simultaneously anchored onto the SMBs through the specific streptavidin–biotin interaction. When the target BRCA1 was added to the sensing system, BRCA1 could bind with the 3′-terminus of the PP through the DNA toehold; this caused the release of the PP from the DWTs by TMSDR and exposed the recognition sequence of Nb.BbvCI. The intermolecular interaction between the activated DWTs and SDs enables the formation of the double stranded DNA (dsDNA) including the specific digestion site; hence, one SD is cleaved by Nb.BbvCI; this results in the dissociation of the intermediate DNA from the functionalized SMBs. Subsequently, the free DWTs spontaneously walk along the adjacent unabridged SDs to form a stable dsDNA structure and repeat the Nb.BbvCI nicking progress. In theory, one DNA walker can give rise to the release of plentiful intermediate DNA. Subsequently, the intermediate DNA, obtained by magnetic separation, specifically combines with the toehold region at the 3′-terminus of the strand L to form the P–L–S–intermediate DNA complex and immediately catalyzes the release of the strand S from the three-stranded complex (P–L–S) through the ESDRs. The dissociation of the strand S causes the exposure of the initially obstructed toehold in the middle of the strand L. Upon the addition of the assistant probe A, the system is driven by the entropic gain of the liberated molecules to combine with the exposed toehold strand in the P–L–intermediate DNA complex to form the P–L–A–intermediate DNA; this causes the liberation of the intermediate DNA and strand P and generation of the duplex L–A. Subsequently, the intermediate DNA is cyclically reused, whereas the strand P labeled with FAM as a signal probe is dramatically released; this leads to the enhancement of the fluorescent signal.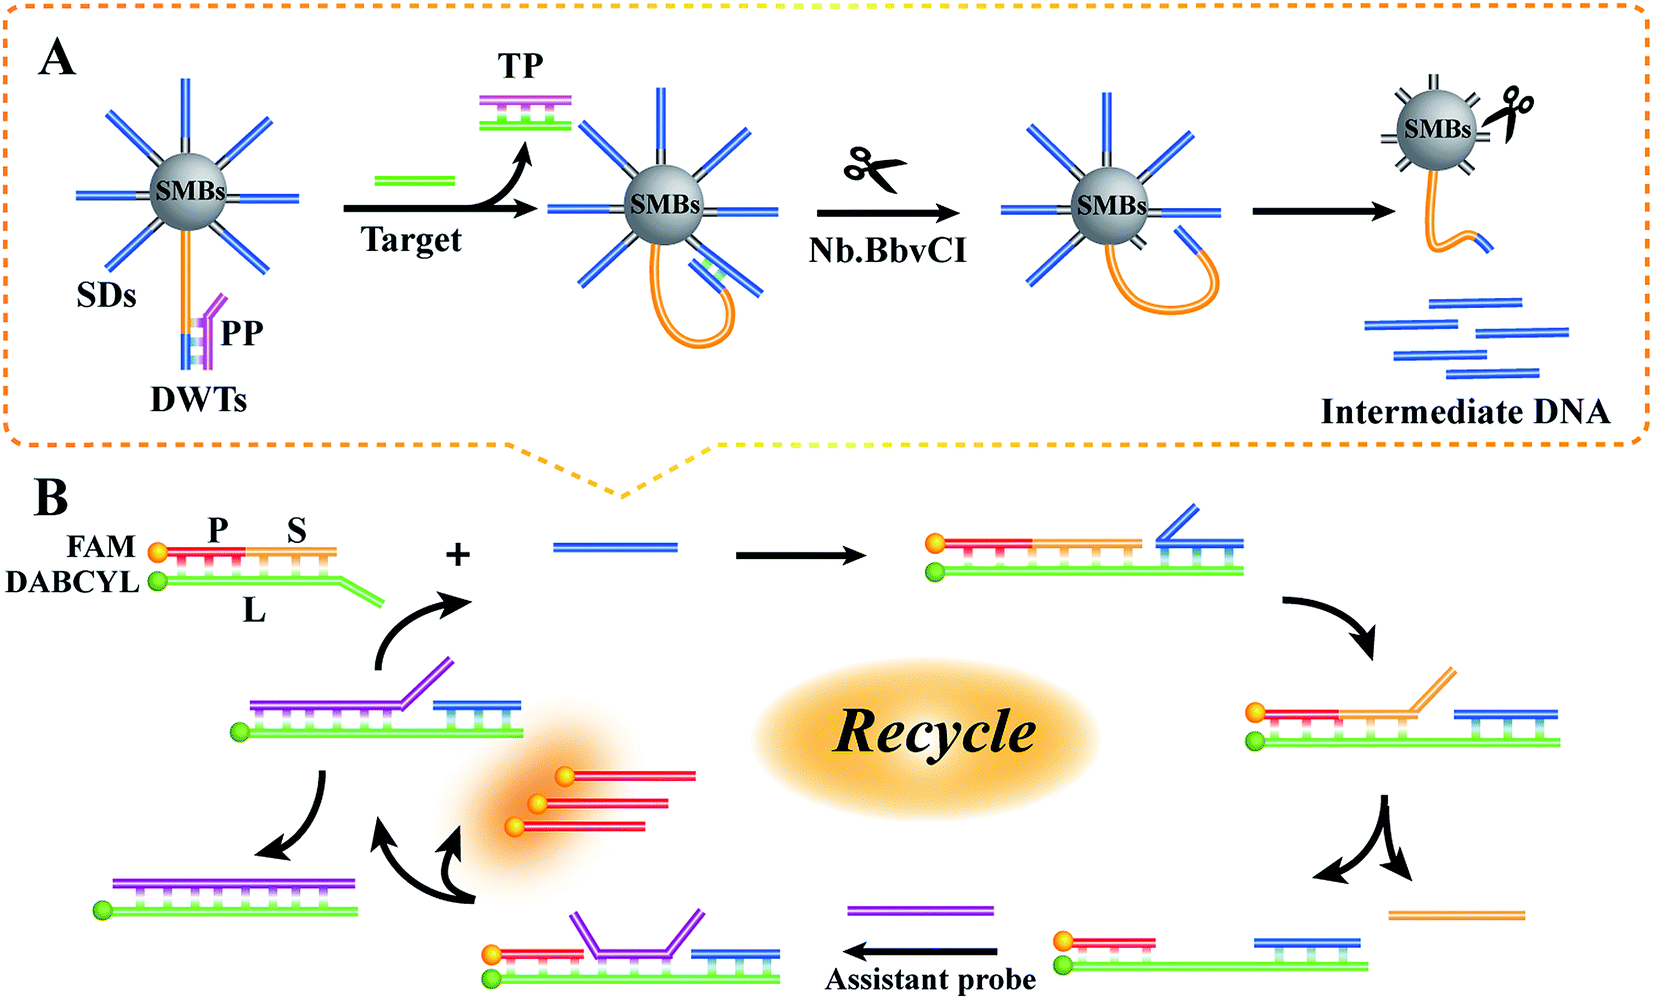 | ||
| Scheme 1 Schematic of the smart fluorescent biosensor for BRCA1 gene detection. (A) 3D DNA walker machine produced intermediate DNA strands. (B) Amplification of ESDRs triggered by intermediate DNA strands and fluorescence detection. | ||
3.2 Feasibility research
At first, using the fluorescence method and native polyacrylamide gel electrophoresis, only the migration of the DNA walker was confirmed (as shown in Fig. S1†). The results showed that (1) the DWTs could be successfully activated by the target DNA and (2) the DNA walker was well established. In addition, the resulting products were detected by the fluorescence method to confirm the availability of the cascade amplification system. As shown in Fig. 1A, the fluorescence intensity of the mixture only containing P–L–S complex probes was very weak due to the quenching effect of DABCYL on FAM (curve a). The fluorescence intensity of the mixtures that lacked the target DNA, Nb.BbvCI or assistant probe A (curves b, c and d, respectively) was also very weak. In contrast, a distinct fluorescent signal was obtained from the simultaneous presence of 10 nM of target DNA, SMBs-PWTs-SDs, 10 U of Nb.BbvCI, 200 nM of P–L–S complex probes and 200 nM of assistant probe A (curve e). These results indicated that the dual-amplification strategy produced large amounts of fluorescent group-labeled signal probes on strand P.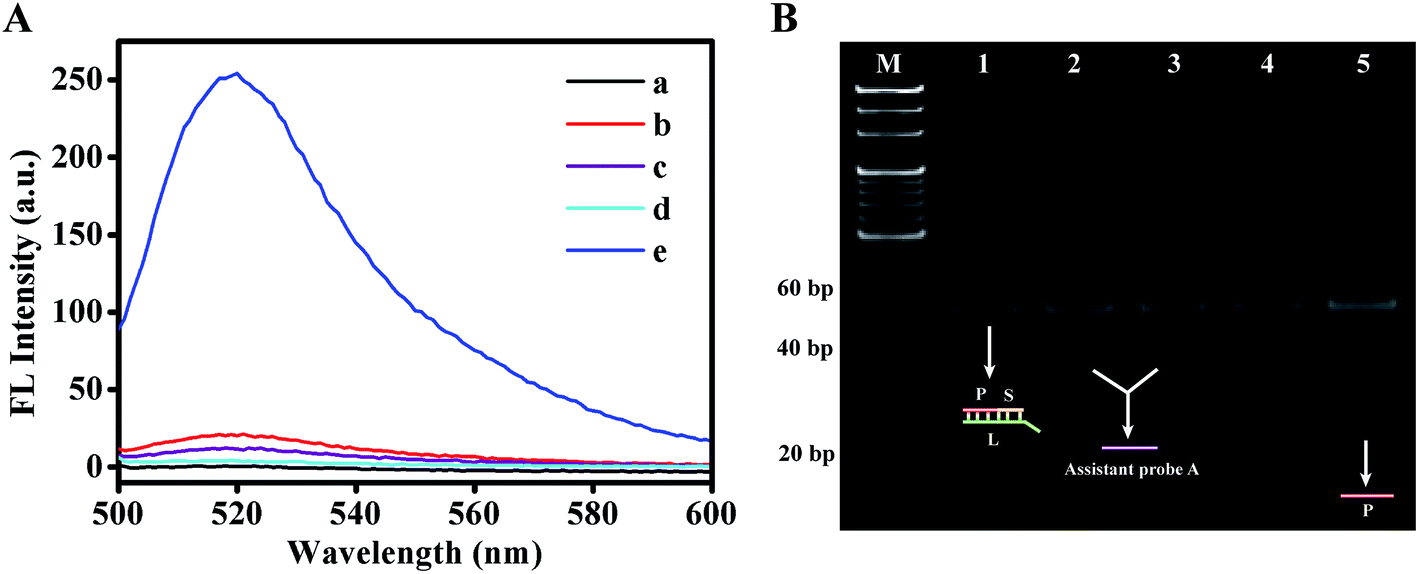 | ||
| Fig. 1 (A) The biosensing strategy was analyzed by the fluorescence method. Curve a: P–L–S; curve b: MBs-PWTs-SDs/Nb.BbvCI/P–L–S/A; curve c: target DNA/SMBs-PWTs-SDs/P–L–S/A; curve d: target DNA/SMBs-PWTs-SDs/Nb.BbvCI/P–L–S and curve e: target DNA/SMBs-PWTs-SDs/Nb.BbvCI/P–L–S/A. (B) The products were verified through 8% Native PAGE. Lane M: 20 bp DNA ladder marker; lane 1: P–L–S; lane 2: SMBs-PWTs-SDs/Nb.BbvCI/P–L–S/A; lane 3: target DNA/SMBs-PWTs-SDs/P–L–S/A; lane 4: target DNA/SMBs-PWTs-SDs/Nb.BbvCI/P–L–S; lane 5: target DNA/SMBs-PWTs-SDs/Nb.BbvCI/P–L–S/A. 10 nM target DNA was used in the experiments. | ||
To further demonstrate the validity of this strategy, native polyacrylamide gel electrophoresis was conducted. As shown in Fig. 1B, lane 1 represents the P–L–S complex probes. In the absence of target DNA (lane 2) or Nb.BbvCI (lane 3), only the bands of the P–L–S complex probes and assistant probe A were observed, indicating that no ESDRs had occurred. However, only the P–L–S complex probes could be found (lane 4) without the help of the assistant probe A in the whole amplification system; this might be attributed to lower concentration of the intermediate DNA. On the contrary, once all elements (10 nM of target DNA, SMBs-PWTs-SDs, 10 U of Nb.BbvCI, 1 μM of P–L–S complex probes and 1 μM of assistant probe A) were present simultaneously, a distinct new band (P strand) was observed (lane 5), which clearly confirmed that the target DNA could well initiate the DNA walker and trigger the following ESDR process.
3.3 Optimization of the assay parameters
To achieve the optimal detection performance of the designed fluorescent biosensor, crucial experimental variables were optimized. The value of ΔFL (ΔFL = FL − FL0) was used to estimate the biosensing performance, where FL and FL0 are the fluorescence intensities in the presence and absence of target DNA, respectively. As the ratio of the SDs and PWTs immobilized on the SMBs directly affected the efficiency of the DNA walker, the ratio of SDs and PWTs was first optimized. As depicted in Fig. 2A, the concentration of the SDs was set at 1500 nM; when the dosage of PWTs was shifted from 0, 25 nM, 50 nM, 75 nM to 100 nM, the fluorescence intensity increased correspondingly and reached a plateau at 75 nM. Therefore, 20:1 was selected as the optimal proportion for subsequent experiments.
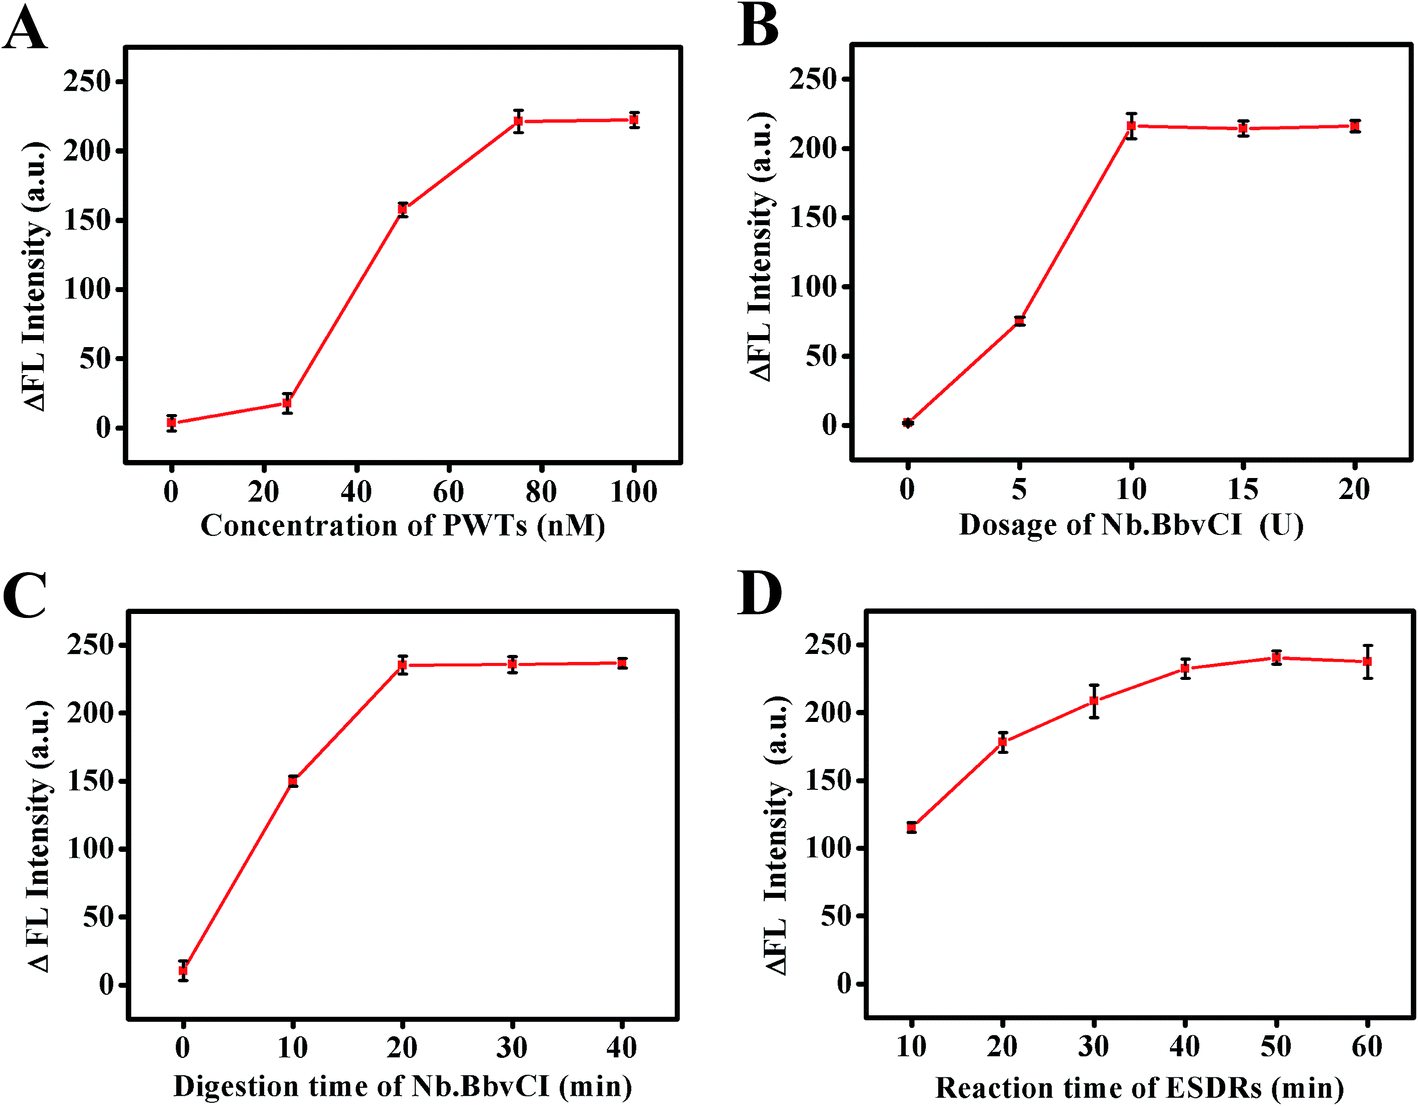 | ||
| Fig. 2 Optimization of the experimental parameters: (A) the concentration of PWTs covered on the SMBs. (B) The concentration of Nb.BbvCI. (C) The digestion time of Nb.BbvCI. (D) The reaction time of ESDRs. Herein, 10 nM target DNA was used in the experiments. Error bars represent the standard deviation of three parallel experiments. | ||
The concentration of Nb.BbvCI and the cleavage time were also important parameters that greatly influenced the performance of this strategy. It was observed that the ΔFL intensity increased remarkably with an increase in the Nb.BbvCI concentration and reached a plateau at 10 U (Fig. 2B). Moreover, the ΔFL intensity increased continually with a prolonged digestion time of Nb.BbvCI and reached a saturation value at 20 min (Fig. 2C). Hence, 10 U and 20 min were chosen as the best conditions for the walker process for the following experiments.
In addition, the incubation time for the ESDRs was studied to improve the sensing sensitivity. The influence of the ESDR incubation time on the fluorescence signal intensity is shown in Fig. 2D. As expected, the ΔFL intensity increased with an increase in reaction time and became constant at 50 min. However, because the difference in the ΔFL intensity between 40 min and 50 min was not significant, 40 min was chosen as the optimal condition for the ESDR process after comprehensive consideration.
3.4 Analytical performance of the designed biosensor
To further explore the analytical capability of our strategy, different concentrations of target DNA were monitored under the optimal conditions. As shown in Fig. 3, there was a good linear relationship between the response signal and the logarithm of the target DNA concentrations in the range from 0.1 pM to 10 nM. The resulting linear regression equation can be expressed as FL = 40.45logCTarget + 87.05 (FL indicates fluorescence signal intensity, and C indicates the concentration of BRCA1) with the correlation coefficient of 0.9946. Based on the 3σ rule, the limit of detection (LOD) for BRCA1 was calculated to be 41.44 fM. To further highlight the merits of this method, the sensitivity of this assay was compared with that of previously reported assays for the BRCA1 detection (Table S2†). The results show that the proposed robust fluorescence method has significant sensitivity and a wide dynamic concentration response range, which is attributed to the good amplification performance of the 3D DNA walker and ESDRs.
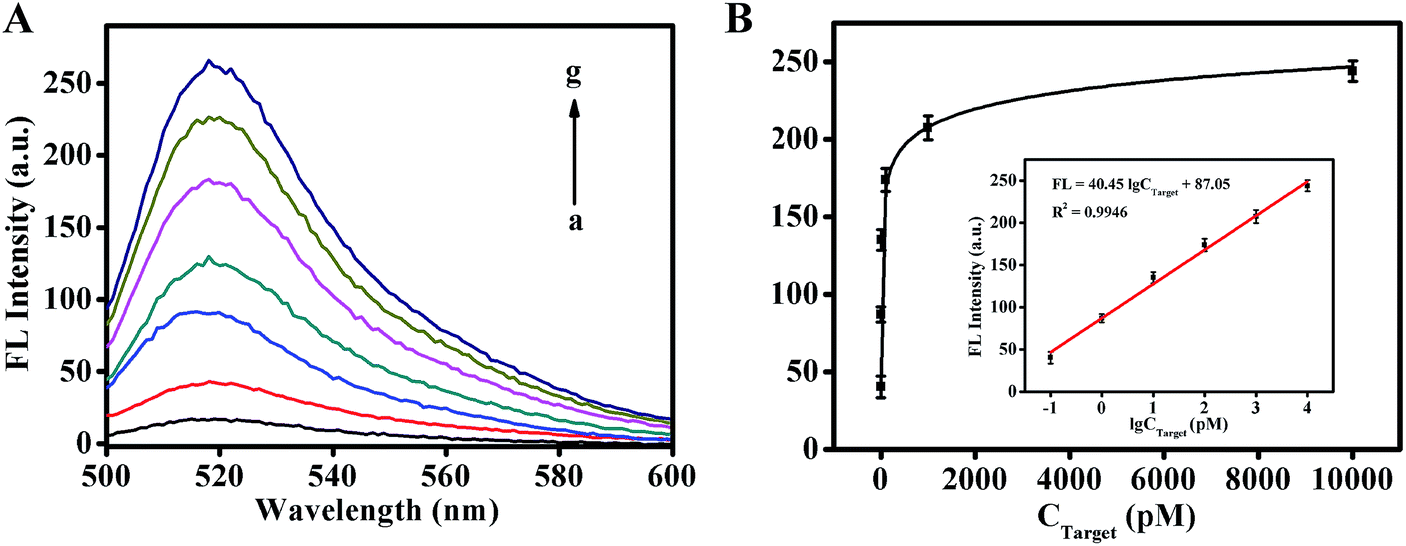 | ||
| Fig. 3 (A) The fluorescent biosensor for the detection of target DNA at 0, 0.1 pM, 1 pM, 10 pM, 0.1 nM, 1 nM and 10 nM (from a to g). (B) The calibration curve of the designed strategy for target DNA detection. Error bars represent the standard deviation of three parallel experiments. | ||
3.5 Specificity and repeatability of this proposed strategy
The specificity of the developed biosensor was studied by three distinct DNA sequences: P53, K-ras and PIK3CA. The concentrations of P53, K-ras and PIK3CA were 100 nM, which was 10-fold that of BRCA1. As shown in Fig. 4, compared with the case of the blank control, no significant change in the signal was observed in the presence of P53, K-ras or PIK3CA. However, when BRCA1 coexisted with the other three interferences, the fluorescence intensity of the mixture was almost unchanged as compared to that when only the target DNA was present. These outcomes exhibit the remarkable specificity of this method for BRCA1 detection.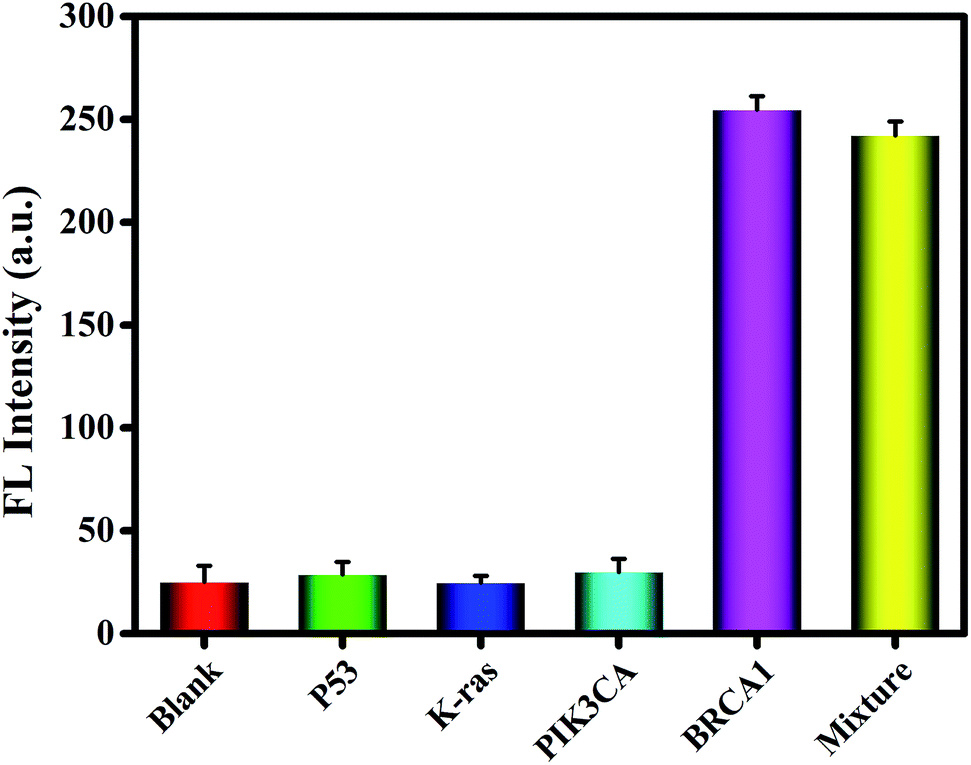 | ||
| Fig. 4 Specificity test for the present biosensor for the target assay. From left to right, the samples are represented as blank, P53, K-ras, PIK3CA, BRCA1 and BRCA1 in the presence of the other interfering substances. The concentration of each interfering substance was 100 nM, whereas that of BRCA1 was 10 nM. Error bars represent the standard deviation of three parallel experiments. | ||
In addition, repeatability and reproducibility are important parameters for evaluating the reliability of a method and therefore have also been investigated by calculating the relative standard deviation (RSD); the intra-assay and inter-assay variation have been determined by performing the assay five times with 1.0 nM and 10 pM target DNA; the RSD of the intra-assay results is 2.3% and 3.7% at 1.0 nM and 10 pM, respectively. The RSD values of the inter-assays were 4.1% and 5.5% at the abovementioned concentrations of target DNA. These results indicate the reliability of this fluorescence strategy with satisfactory repeatability and reproducibility.
3.6 Recovery test
To further assess the capability of this sensing strategy in practical applications, the target DNA was spiked into 200 pg mL−1 salmon sperm DNA to simulate a situation of real sample detection. In Table S3,† we could see that the recoveries varied from 97.3% to 102.0%, and the RSDs ranged from 5.0% to 7.5%, indicating that our proposed strategy was not compromised during a complex matrix analysis. These results clearly prove that the proposed fluorescent biosensor has the potential to become a promising tool for the BRCA1 analysis.4. Conclusion
In summary, we successfully constructed a cascade amplification strategy based on a 3D DNA walker machine with ESDRs. First, due to the robust manipulation capacity of the DNA walker and superior signal amplification capacity of ESDRs, as low as 0.1 pM target DNA could be detected within 1 h. Second, the specificity of this strategy was significantly enhanced because of the rigorous sequence design of the whole system and excellent discriminative ability of TMSDR. Third, compared with common hairpin probes, our strategy fully employs linear DNA complex probes, which ensures the stability of the probes. Fourth, the developed biosensing method has good versatility and can be extended to detect other tumor biomarkers just by changing the corresponding molecular elements. However, for the quantitative detection of real clinical samples via this biosensing method, the interference of serum matrix still needs to be overcome.Conflicts of interest
The authors have declared that no competing interest exists.Acknowledgements
This work was supported by the National Natural Science Foundation of China (81371904 and 81873980).References
- R. C. Qian, Y. Cao, L. J. Zhao, Z. Gu and Y. T. Long, Angew. Chem., Int. Ed., 2017, 56, 4802–4805 CrossRef CAS PubMed.
- J. K. Awino, S. Gudipati, A. K. Hartmann, J. J. Santiana, D. F. Cairns-Gibson, N. Gomez and J. L. Rouge, J. Am. Chem. Soc., 2017, 139, 6278–6281 CrossRef CAS PubMed.
- J. S. Wang, Y. H. Yan and D. Y. Zhang, Nat. Chem., 2017, 9, 1222–1228 CrossRef CAS PubMed.
- K. Lee, Y. Cui, L. P. Lee and J. Irudayaraj, Nat. Nanotechnol., 2014, 9, 474–480 CrossRef CAS PubMed.
- M. Liu, W. Q. Zhang, Q. Zhang, J. D. Brennan and Y. F. Li, Angew. Chem., Int. Ed., 2015, 54, 9637–9641 CrossRef CAS PubMed.
- Q. Q. Liu, J. Q. Liu, D. G. He, T. P. Qing, X. X. He, K. M. Wang and Y. F. Mao, RSC Adv., 2016, 6, 90310–90317 RSC.
- F. A. Wang, J. Elbaz, R. Orbach, N. Magen and I. Willner, J. Am. Chem. Soc., 2011, 133, 17149–17151 CrossRef CAS PubMed.
- C. Li, Y. C. Yang, B. Zhang, G. F. Chen, Z. X. Wang and G. X. Li, Part. Part. Syst. Charact., 2014, 31, 201–208 CrossRef CAS.
- F. A. Wang, C. H. Lu, X. Q. Liu, L. N. Freage and I. Willner, Anal. Chem., 2014, 86, 1614–1621 CrossRef CAS PubMed.
- Y. Chen, M. L. Yang, Y. Xiang, R. Yuan and Y. Q. Chai, Anal. Chim. Acta, 2013, 796, 1–6 CrossRef CAS PubMed.
- Y. S. Jiang, B. L. Li, J. N. Milligan, S. Bhadra and A. D. Ellington, J. Am. Chem. Soc., 2013, 135, 7430–7433 CrossRef CAS PubMed.
- M. W. Wang, Y. Y. Tang, Y. Y. Chen, Y. Cao and G. F. Chen, Anal. Chim. Acta, 2019, 1045, 77–84 CrossRef CAS PubMed.
- M. H. Liu, J. L. Fu, C. Hejesen, Y. H. Yang, N. W. Woodbury, K. Gothelf, Y. Liu and H. Yan, Nat. Commun., 2013, 4, 2127–2131 CrossRef PubMed.
- M. Qing, S. B. Xie, W. Cai, D. Y. Tang, Y. Tang, J. Zhang and R. Yuan, Anal. Chem., 2018, 90, 11439–11445 CrossRef CAS PubMed.
- C. Jung, P. B. Allen and A. D. Ellington, Nat. Nanotechnol., 2016, 11, 157–163 CrossRef CAS PubMed.
- Y. H. Ji, L. Zhang, L. Y. Zhu, J. P. Lei, J. Wu and H. X. Ju, Biosens. Bioelectron., 2017, 96, 201–205 CrossRef CAS PubMed.
- L. D. Wang, R. J. Deng and J. H. Li, Chem. Sci., 2015, 6, 6777–6782 RSC.
- X. S. Yang, D. M. Shi, S. M. Zhu, B. J. Wang, X. J. Zhang and G. F. Wang, ACS Sens., 2018, 3, 1368–1375 CrossRef CAS PubMed.
- X. M. Qu, D. Zhu, G. B. Yao, S. Su, J. Chao, H. J. Liu, X. L. Zuo, L. H. Wang, J. Y. Shi, L. H. Wang, W. Huang, H. Pei and C. H. Fan, Anal. Chim. Acta, 2017, 56, 1855–1858 CAS.
- Z. Q. Xu, L. L. Liao, Y. Q. Chai, H. J. Wang and R. Yuan, Anal. Chem., 2017, 89, 8282–8287 CrossRef CAS PubMed.
- X. L. Yang, Y. N. Tang, S. D. Mason, J. B. Chen and F. Li, ACS Nano, 2016, 10, 2324–2330 CrossRef CAS PubMed.
- J. G. Xu, Z. S. Wu, H. L. Li, Z. M. Wang, J. Q. Le, T. T. Zheng and L. E. Jia, Biosens. Bioelectron., 2016, 86, 1024–1030 CrossRef CAS PubMed.
- X. Y. Wu, Y. Q. Chai, P. Zhang and R. Yuan, ACS Appl. Mater. Interfaces, 2015, 7, 713–720 CrossRef CAS PubMed.
- Y. Zhang, L. X. Wang, F. Luo, B. Qiu, L. H. Guo, Z. Q. Weng, Z. Y. Lin and G. N. Chen, Chem. Commun., 2017, 53, 2885–2992 RSC.
- R. Wang, L. Wang, X. W. Xu and W. Jiang, Sens. Actuators, B, 2018, 268, 287–292 CrossRef CAS.
- H. P. Wu, X. Y. Zhou, W. Cheng, T. X. Yuan, M. Zhao, X. L. Duan and S. J. Ding, Analyst, 2018, 143, 4974–4980 RSC.
- D. M. Huang, X. M. Li, B. Shen, J. Li, X. J. Ding, X. Y. Zhou, B. Guo, W. Cheng and S. J. Ding, Anal. Chim. Acta, 2018, 273, 393–399 CAS.
- D. Y. Zhang, A. J. Turberfield, B. Yurke and E. Winfree, Science, 2007, 318, 1121–1125 CrossRef CAS PubMed.
- Y. Q. Wu, D. Y. Zhang, P. Yin and F. Vollmer, Small, 2014, 10, 2067–2076 CrossRef CAS PubMed.
- K. Zhang, K. Wang, X. Zhu and M. H. Xie, Anal. Chim. Acta, 2017, 949, 53–58 CrossRef CAS PubMed.
- Q. M. Feng, Y. H. Guo, J. J. Xu and H. Y. Chen, ACS Appl. Mater. Interfaces, 2017, 9, 17637–17644 CrossRef CAS PubMed.
- S. Ou, T. Xu, X. Liu, X. Y. Yu, R. Li, J. Deng, J. X. Yuan and Y. M. Chen, Sens. Actuators, B, 2018, 255, 3057–3063 CrossRef CAS.
- X. J. Qin, S. X. Xu, L. Deng, R. F. Huang and X. F. Zhang, Biosens. Bioelectron., 2016, 85, 957–963 CrossRef CAS PubMed.
Footnotes |
| † Electronic supplementary information (ESI) available. See DOI: 10.1039/c9ra02401h |
| ‡ These two authors contributed equally to this work. |
| This journal is © The Royal Society of Chemistry 2019 |