 Open Access Article
Imaging modification of colon carcinoma cells exposed to lipid based nanovectors for drug delivery: a scanning electron microscopy investigation†
Nicoletta Depalo *a,
Elisabetta Fanizzaab,
Fabio Vischiob,
Nunzio Denoraac,
Valentino Laquintanac,
Annalisa Cutrignellic,
Marinella Striccoli
 a,
Gianluigi Giannellid,
Angela Agostianoab,
Maria Lucia Curriab and
Maria Principia Scavo
 *d
*d
aInstitute for Physical-Chemical Processes (IPCF)-CNR SS Bari, Via Orabona 4, 70125 Bari, Italy
bUniversità degli Studi di Bari Aldo Moro, Dipartimento di Chimica, Via Orabona 4, 70125 Bari, Italy
cUniversità degli Studi di Bari Aldo Moro, Dipartimento di Farmacia, Scienze del Farmaco, Via Orabona 4, 70125 Bari, Italy
dPersonalized Medicine Laboratory, National Institute of Gastroenterology – Research Hospital “S. De Bellis”, Via Turi 27, Castellana Grotte, Bari, Italy. E-mail: maria.scavo@irccsdebellis.it
First published on 15th July 2019
Abstract
The adsorption at cell surfaces and cell internalization of two drug delivery lipid based nanovectors has been investigated by means of Field Emission Scanning Electron Microscopy (FE-SEM) operating at low beam voltage on two different colon carcinoma cell lines, CaCo-2 and CoLo-205, that were compared with the M14 melanoma cell line, as a reference. The cells were incubated with the investigated multifunctional nanovectors, based on liposomes and magnetic micelles loaded with 5-fluorouracil, as a chemotherapeutic agent, and a FE-SEM systematic investigation was performed, enabling a detailed imaging of any morphological changes of the drug exposed cells as a function of time. The results of the FE-SEM investigation were validated by MTS assay and immunofluorescence staining of the Ki-67 protein performed on the investigated cell lines at different times. The two nanoformulations resulted in a comparable effect on CaCo-2 and M14 cell lines, while for CoLo 205 cells, the liposomes provided an cytotoxic activity higher than that observed in the case of the micelles. The study highlighted the high potential of FE-SEM as a valuable complementary technique for imaging and monitoring in time the drug effects on the selected cells exposed to the two different nanoformulations.
1. Introduction
Multifunctional nanovectors represent innovative methods for therapy administration and are fundamental to overcoming the relevant issues associated with conventional chemotherapy, including low tumor accumulation and significant toxicity of drugs.1–10 The in vivo potential efficacy of a nanosystem, specifically designed for the treatment of a defined type of cancer, needs to be preliminarily assessed by means of a comprehensive in vitro investigation. In vitro high magnification imaging study represents an essential step to achieve a comprehensive understanding of the effect on the cell structure of the new organic and/or inorganic nanoformulations, that are proposed as innovative drug delivery systems and of their pharmacological activity. Imaging tools have been constantly improved to enhance their capability in shedding light on the nanostructure–cell interactions, thus gaining valuable insights on the nanostructure uptake mechanisms associated with cell adsorption and penetration, as well as their accumulation in subcellular compartments.11–17 Optical microscopy is extensively exploited in the life sciences to analyse the nanomaterial–biological interface, and provides an efficient tool box to monitor nanoparticle (NP) internalization in living or fixed cells, with minimal sample preparation.13,18,19 Within such a class of optical techniques, fluorescence microscopy has been demonstrated to be essential to probe and assess the NP location and distribution within cells.20–27 All-optical microscopy techniques are able to directly visualize nanostructures in cells only when they aggregate, forming clusters larger than 200 nm, due to the light diffraction limited resolution. An optical microscopy study can be combined, in a complementary approach, with in vitro investigation performed by electron microscopy techniques. Indeed, transmission electron microscopy (TEM) and scanning electron microscopy (SEM) allow the visualization of resolved single nanostructures and have been extensively used not only for the morphological characterization of nanomaterials, but also for investigating the modification of cells' biology during neoplastic cell transformation, and getting insights on the interactions between nanostructures and cells.28–31 TEM has been demonstrated to be particularly effective to image resolved NPs in thin cellular sections and for their visualization in specific subcellular compartments,32,33 although the sample preparation is highly laborious. Indeed, the preparation of ultrathin sections is crucial to achieve the desired sample thickness, thus allowing the electron beam to pass through the specimen. Conversely, SEM enables the 3D visualization of the single nanostructure/whole cell interactions. SEM is a simple and efficient investigation tool with high spatial resolution and good depth of field to be profitably applied to elucidate the NP adsorption phenomena on cell membranes and the NP ability to cross the cell membrane and be internalized. Furthermore, SEM enables the visualization of the interactions of single nanostructures in the whole cell. In particular, the FE-SEM technique equipped with an in-lens detector is able to provide topographical images of samples at very high magnifications, with virtually unlimited depth of field and sub-nanometer spatial resolution, with performance higher than regular FE-SEM, operating at low accelerating voltage and low working distance, thus limiting detrimental charging effects, that commonly occur when dealing with biological samples.34Here, 5-FU loaded liposomes and superparamagnetic iron oxide nanoparticles (SPIONs) containing micelles were prepared and their cell interactions and internalization were investigated. FE-SEM technique was used to perform a systematic characterization of cell morphology as a function of incubation time of the three cancer cell lines with the two different 5-Fluorouracil (5-FU) loaded nanoformulations. Namely, two colon cancer cell lines, the human epithelial colon cancer cell line (CaCo-2) and human metastatic colon adenocarcinoma cell line (CoLo-205), were selected and evaluated against the metastatic melanoma M14 cell line. The ensemble of the proposed cell lines, each characterized by peculiar morphology and biochemical structure of the cellular membrane, cell surface specialization and tumor aggressiveness,35–40 represent an effective model set to elucidate possible differences in the NP-cell interactions and in the cell response upon treatment with the two different drug delivery nanosystems. The clinical relevance of the two selected colon carcinoma cell lines arises from the recorded global incidence and prevalence in the world of the colorectal cancer (CRC), which is the third most common cancer type in the world, with nearly 1.5 million new cases diagnosed per year.41 Fluorouracil (5-FU) is an antimetabolite used in the treatment of various types of cancers, including CRC and melanoma. In the last decade translational nanomedicine has led to an evolution of drugs therapies, especially those using liposome and micelle based formulation.42,43 Interesting effects on inhibition of cell proliferation using this class of formulations, as organic soft nanovectors for the delivery of 5-FU or also in combination with doxorubicin, were reported.44,45
In particular, a systematic time-dependent investigation by FE-SEM technique allowed visualization of the interactions between the proposed nanoformulations and the cells, and detection of any possible morphological changes induced by treatment with the drug containing nanovectors for the three selected cell lines.
Finally, conventional MTS assay and cell proliferation assessment by immunofluorescence staining of Ki-67 antigen were carried out to validate the metabolic effects corresponding to the structural and morphological modifications highlighted by the FE-SEM study. The results clearly demonstrated that FE-SEM as a valuable and effective tool for imaging the consequences of the nanoformulations exposure on the relevant cell lines, and provided preliminary indications of the potential of the two designed drug delivery nanovectors for an efficient treatment of CRC and melanoma.
2. Experimental
2.1 Materials
Oleic acid (90%), 1-octadecene (90%), oleyl amine (70%), iron pentacarbonyl (98%), and dodecane-1,2-diol (90%), phosphotungstic acid (99.995%), cholesterol, phosphatidylcholine, stearylamine and 5-FU were purchased from Sigma-Aldrich. 1,2-Dipalmitoyl-sn-glycero-3-phosphoethanolamine-N-[methoxy(poly(ethylene glycol))-2000] (16![[thin space (1/6-em)]](https://www.rsc.org/images/entities/char_2009.gif) :
:![[thin space (1/6-em)]](https://www.rsc.org/images/entities/char_2009.gif) 0 PEG-2-PE) and 1,2-distearoyl-sn-glycero-3-phosphoethanolamine-N-[methoxy(polyethylene glycerol)-2000] (DSPE-PEG-2000) was purchased from Avanti Polar Lipids. The primary antibody Ki-67 was purchased from Santa Cruz Biotechnology. Green-fluorescent conjugated anti mouse secondary antibody (Alexa Fluor 488) and prolong gold antifade reagent containing the nuclear staining 4′,6-diamidino-2-phenylindole dichloride (DAPI) were purchased from Invitrogen. CellTiter 96 AQueous One Solution Cell Proliferation Assay (MTS) was purchased form Promega.
0 PEG-2-PE) and 1,2-distearoyl-sn-glycero-3-phosphoethanolamine-N-[methoxy(polyethylene glycerol)-2000] (DSPE-PEG-2000) was purchased from Avanti Polar Lipids. The primary antibody Ki-67 was purchased from Santa Cruz Biotechnology. Green-fluorescent conjugated anti mouse secondary antibody (Alexa Fluor 488) and prolong gold antifade reagent containing the nuclear staining 4′,6-diamidino-2-phenylindole dichloride (DAPI) were purchased from Invitrogen. CellTiter 96 AQueous One Solution Cell Proliferation Assay (MTS) was purchased form Promega.
2.2 Preparation of phospholipid based micelles loaded with 5-FU and SPIONS
Organic capped SPIONs were synthesized according to the experimental procedure reported in N. Depalo et al.3 PEG-modified phospholipid micelles loaded with 5-FU and SPIONs (SPION/5-FU/Micelles) were prepared by mixing a SPION stock solution in chloroform (160 μL, 8 × 10⁻² M), 5-FU solution in ethanol (200 μL, 1.6 × 10⁻² M) and 16![[thin space (1/6-em)]](https://www.rsc.org/images/entities/char_2009.gif) :
:![[thin space (1/6-em)]](https://www.rsc.org/images/entities/char_2009.gif) 0 PEG-2-PE solution in chloroform (150 μL, 3.5 × 10⁻² M). After the solvent evaporation by using a rotary evaporator, the dried SPION/5-FU/PEG-lipid layer was then kept under vacuum for 1 h. Subsequently, the film was hydrated by using 2 mL of phosphate buffer (PBS, 10 mM, pH 7.4). SPION/5-FU/Micelles were repeatedly heated up to 80 °C and then cooled down to room temperature (three cycles). The excess of SPIONs not incorporated in the micelles was removed by centrifugation (5000×g) for 1 minute. The solution was filtered by using 0.2 μm filters (Anotop, Whatman) and subsequently ultracentrifugated (200000×g) for 16 hours to remove the excess of drug. The SPION/5-FU/Micelles recovered as pellet were dispersed in PBS.
0 PEG-2-PE solution in chloroform (150 μL, 3.5 × 10⁻² M). After the solvent evaporation by using a rotary evaporator, the dried SPION/5-FU/PEG-lipid layer was then kept under vacuum for 1 h. Subsequently, the film was hydrated by using 2 mL of phosphate buffer (PBS, 10 mM, pH 7.4). SPION/5-FU/Micelles were repeatedly heated up to 80 °C and then cooled down to room temperature (three cycles). The excess of SPIONs not incorporated in the micelles was removed by centrifugation (5000×g) for 1 minute. The solution was filtered by using 0.2 μm filters (Anotop, Whatman) and subsequently ultracentrifugated (200000×g) for 16 hours to remove the excess of drug. The SPION/5-FU/Micelles recovered as pellet were dispersed in PBS.
2.3 Preparation of liposomes loaded with 5-FU
The liposomes were prepared as described in experimental protocols reported by Biswas.46 Briefly, liposomes were obtained by dissolving DSPE-PEG-2000 (11 μL, 3.5 × 10⁻² M) in a lipid mixture (274 μL) composed of cholesterol, phosphatidylcholine and stearylamine (1![[thin space (1/6-em)]](https://www.rsc.org/images/entities/char_2009.gif) :
:![[thin space (1/6-em)]](https://www.rsc.org/images/entities/char_2009.gif) 7
7![[thin space (1/6-em)]](https://www.rsc.org/images/entities/char_2009.gif) :
:![[thin space (1/6-em)]](https://www.rsc.org/images/entities/char_2009.gif) 2 molar ratio) in a flat bottom flask with ethanol and chloroform (1
2 molar ratio) in a flat bottom flask with ethanol and chloroform (1![[thin space (1/6-em)]](https://www.rsc.org/images/entities/char_2009.gif) :
:![[thin space (1/6-em)]](https://www.rsc.org/images/entities/char_2009.gif) 1). 5-FU aqueous solution (38 mM) was further added to the organic solvent in one shot by means of a sterile glass syringe (3 mL). The control of the liposome at nanosize was achieved by carrying out three cycles of sonication, for 3 minutes each, at room temperature. After, the solution was stirred over night at 37 °C to remove the organic phase and allow the film to dry. To reduce the size of liposomes, the formulation was extruded 5 times with 200 nm and 100 nm filter, by manual mini-extruder (Avanti Polar Lipids) and the free, non-encapsulated drug was removed by ultracentrifugation (35000×g) for 20 minutes at 4 °C. The drug containing liposomes recovered as pellet were washed with PBS (2 times). Finally, the samples were lyophilized by using a Christ freeze dryer alpha 1–4 LSC at 200 mbar and −50 °C to concentrate the samples, before their reconstitution in PBS.
1). 5-FU aqueous solution (38 mM) was further added to the organic solvent in one shot by means of a sterile glass syringe (3 mL). The control of the liposome at nanosize was achieved by carrying out three cycles of sonication, for 3 minutes each, at room temperature. After, the solution was stirred over night at 37 °C to remove the organic phase and allow the film to dry. To reduce the size of liposomes, the formulation was extruded 5 times with 200 nm and 100 nm filter, by manual mini-extruder (Avanti Polar Lipids) and the free, non-encapsulated drug was removed by ultracentrifugation (35000×g) for 20 minutes at 4 °C. The drug containing liposomes recovered as pellet were washed with PBS (2 times). Finally, the samples were lyophilized by using a Christ freeze dryer alpha 1–4 LSC at 200 mbar and −50 °C to concentrate the samples, before their reconstitution in PBS.
2.4 Encapsulation efficiency
The encapsulation efficiency (EE%) of the drug in the liposomes and micelles, respectively, was calculated according the following formula: (EE%) = (Wt/Wi) × 100, where Wt is the total amount of drug in the nanoformulations (5-FU/Liposomes and SPION/5-FU/Micelles) and Wi is the total quantity of drug added initially during preparation. The EE% in 5-FU/Liposomes and in SPION/5-FU/Micelles was evaluated by UV-Vis absorption spectroscopy (Cary Varian 5000 UV-Visible-NIR spectrophotometer). Absorbance value at 265 nm was recorded to determine the drug content. A calibration curve was obtaining by recording the absorbance of solutions of 5-FU in methanol at standard concentrations. 5-FU/Liposomes were lyophilized and treated with methanol (1![[thin space (1/6-em)]](https://www.rsc.org/images/entities/char_2009.gif) :
:![[thin space (1/6-em)]](https://www.rsc.org/images/entities/char_2009.gif) 100 dilution) to induce their breakdown, thus allowing to measure the total amount of encapsulated drug. Conversely, the micelle solution was first lyophilized, then dissolved in methanol (2 mL). The SPIONs were then removed by centrifugation (5000×g) for 10 minutes. Absorbance spectra of the samples were recorded by using, as baseline, a blank consisting of a methanol solution containing the same lipid mixture used for liposome or micelle preparation, at the same concentration of lipid components in the samples.
100 dilution) to induce their breakdown, thus allowing to measure the total amount of encapsulated drug. Conversely, the micelle solution was first lyophilized, then dissolved in methanol (2 mL). The SPIONs were then removed by centrifugation (5000×g) for 10 minutes. Absorbance spectra of the samples were recorded by using, as baseline, a blank consisting of a methanol solution containing the same lipid mixture used for liposome or micelle preparation, at the same concentration of lipid components in the samples.
2.5 In vitro drug release study
5-FU/Liposomes and SPION/5-FU/Micelles, respectively, were introduced into a dialysis tube with a cellulose ester membrane (Spectra/Por 3.5 kDa molecular weight cutoff) and incubated against PBS in a water bath (MEMMERT) at 37 °C, under gentle shaking. At defined time interval, over 15 days, the solution where the tube was immersed was removed and replaced with fresh solution. The drug concentration was determined spectrophotometrically at each sampling time by measuring the UV-Vis absorbance at 265 nm of each collected aliquot. A calibration curve was obtaining by recording the absorbance of solutions of 5-FU in aqueous PBS. Measurements were conducted three times per sample.2.6 Cell culture
The M14 melanoma cell line was from the University of California Los Angeles and derived from a metastatic amelanotic lesion.47 The CaCo-2 cell line was well-differentiated colorectal adenocarcinoma (ATCC). The CoLo205 cell line was established from ascites fluid obtained from a male patient with ATCC. For M-14 and CaCo-2, the same culture protocol was used. Briefly, Eagle's Minimum Essential Medium, (GibCo), with 10% of fetal bovine serum, 1% of penicillin/streptomycin and 1% of glutamine (all compounds from Thermo-Fisher Scientific). For CoLo-205 cell line, ATCC-formulated RPMI-1640 Medium was employed, added with 10% of fetal bovine serum, 1% of penicillin/streptomycin and 1% of glutamine. All cells were maintained at 37 °C in a humidified incubator containing 5% CO2.2.7 Cell proliferation assay
CoLo205, M-14 and CaCo-2 cells were seeded into 96-well plates at a density of 2 × 10³ cells per well. Subsequently, 5-FU/Liposomes and SPION/5-FU/Micelles, at drug concentration of 3 μM, were added to each well. The plates were incubated at 37 °C for 24 and 48 hours. Untreated cells were used as control. At the end of treatment, 20 μL of MTS reagent were added to the cells for 3 hours at 37 °C and the absorbance at 490 nm was measured by using a PerkinElmer Victor Plate Reader (Belgium). Statistical analysis was performed by using one-way analysis of variance (ANOVA) by SIGMA-STAT 3.1 and T-test. In particular, when this analysis rejected the hypothesis of the mean equality among the groups, the Holm–Sidak methods was applied.2.8 Immunofluorescence analysis
Cells were seeded into 24-well plates at a density of 10 × 103 cells per well at 37 °C and treated with 5-FU/Liposomes and SPION/5-FU/Micelles at drug concentration of 3 μM for 24 hours. Untreated cells were used as control. Subsequently, cells were washed with PBS, fixed and permeabilized for 15 minutes with 0.5% Triton X-100 in PBS. Then cells were blocked with 5% normal serum in PBS for 1 hour. Next, the cells were incubated at 4 °C with the primary antibody Ki-67 over-night, followed by washing with PBS and incubation with a specific green-fluorescent conjugated secondary IgG Alexa 488 for 1 hour. After washing with PBS, cells were mounted using prolong gold antifade reagent containing DAPI. Images were acquired by using the fluorescence microscope Eclipse Ti2 by Nikon.2.9 Dynamic light scattering analysis and ζ-potential investigation
Evaluation of hydrodynamic diameter, size distribution and colloidal stability of 5-FU/Liposomes and SPION/5-FU/Micelles was achieved by using a Zetasizer Nano ZS, Malvern Instruments Ltd., Worcestershire, UK (DTS 5.00). In particular, size and size distribution, in terms of polydispersity index (PDI), were determined by means of dynamic light scattering (DLS) measurements, after sample dilution in demineralized water. A laser Doppler velocimetry (LDV) was used to perform the ζ-potential measurements and record the surface charges of the samples after their dilution in KCl aqueous solution (1 mM). All reported data are presented as mean values ± standard deviation (three replicates).2.10 Transmission electron microscopy investigation
Morphological characterization of SPIONs, 5-FU/Liposomes and SPION/5-FU/Micelles was achieved by means of TEM investigation. A Jeol JEM-1011 microscope, working at an accelerating voltage of 100 kV, was used and TEM images were acquired by an Olympus Quemesa Camera (11 Mpx). The samples were prepared by dropping on the 400 mesh amorphous carbon-coated Cu grid a SPION chloroform dispersion or, alternatively, a micelle or liposome aqueous suspension, and letting the solvent to evaporate. For the positive staining TEM analysis, after the sample (liposome or micelle) deposition, the grid was dipped in a 2% (w/v) phosphotungstic acid solution for 15 seconds. Ultrapure water was used to remove the excess of staining agent. Finally, the sample on the grid was left to dry overnight and stored in a vacuum chamber until analysis. For the negative staining TEM investigation, after the sample (liposome or micelle) deposition, 5 μL of a 2% (w/v) phosphotungstic acid solution were cast on a grid and left for 30 seconds. Subsequently, staining agent excess was removed by blotting, at the edge of the grid, with filter paper, wetted with ultrapure water. When the sample was completely dried, the grid was kept in a vacuum chamber until observation.2.11 Field emission scanning electron microscopy investigation
M-14, CaCo-2 and CoLo205 cells were seeded on 1 cm2 silicon chips (Ted Pella Inc.) at a density of 5 × 10³ cells per well in 6-well plates and at a sub-confluent density, were exposed to liposomes or micelles formulation with a 3 μM 5-FU concentration, for 6, 9, 24 and 48 hours. For fixation procedures, the cells were treated with 3% glutaraldehyde in PBS (1 hour at 4 °C) and after incubated for 1 hour at room temperature in 1% OsO4. Afterwards, the samples were washed several time with 0.005 M of sodium cacodylate, pH 7.2 and to complete the dehydratation process gradually passed through acetone solutions of increasing concentration ranging from 20% to 100% for 10 minute each passage. After this process, samples were completely dried and finally, were coated with a thin Au film using a sputter coater (208HR High Resolution Sputter Coater, Ted Pella Inc.). The same fixation procedure was carried out after deposition on silicon chips of free 5-FU/Liposomes and SPION/5-FU/Micelles and used as control together with the untreated cells. The fixed cells were visualized by using a Zeiss Sigma FE-SEM, equipped with an in-lens secondary electron detector. The samples deposited on silicon chips were fixed to stainless-steel sample holders by using double-sided carbon tape. A uniform Au metal coating of few nanometers was deposited on the samples placed on silicon chips by using a turbomolecular pumped SC7620 Mini Sputter/Glow Discharge System of Quorum Technologies. The overall FE-SEM measurements on the samples were acquired at constant EHT value of 3.00 kV and at working distance (WD) ranging from 1.8 to 3 mm. The FE-SEM micrographs presented for each experiment were selected as representative of a set of pictures collected on each sample resulting from three replicates of the same experiment and, on the same sample in replicated analysis.3. Results
3.1 5-FU loaded lipid based nanoformulation
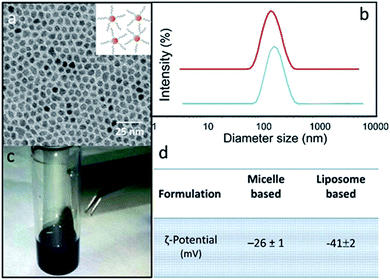
Two different lipid based nanoformulations were designed, prepared and loaded with the 5-FU, namely PEG functionalized liposomes and micelles (5-FU/Liposomes and SPION/5-FU/Micelles), in order to obtain colloidal nanovectors able to act as nanostructures suitable for their detection on cell surface by FE-SEM technique, thus allowing visualization of their interactions with cells and the time evolution of morphological changes of cells exposed to them. Compared to the therapeutic 5-FU/Liposomes, the micelles loaded with SPIONs, along with the drug cargo, are expected to be more effectively imaged by FE-SEM technique, due to the inorganic chemical nature of SPIONs, being formed of a solid, dense material entrapped in the soft micelles. The encapsulation of the robust inorganic SPIONs in the micelles should favour the retention of the original shape and volume of the soft nanovectors, that are generally characterized by a high susceptibility to shrinkage when undergoing to the drying and fixation procedure, which is strictly preliminary required for FE-SEM measurements.The scheme (Fig. 1) depicts the 5-FU/Liposomes and SPION/5-FU/Micelles, both encapsulating drug, and micelles hosting SPIONs with average diameter of about 9 nm and superparamagnetic behaviour (Fig. 2a and c). After their preparation, 5-FU/Liposomes and SPION/5-FU/Micelles were extensively characterized by means of DLS, TEM and FE-SEM in order to investigate their size uniformity and morphology. Furthermore, ζ-potential analysis was performed to evaluate the colloidal stability in aqueous media of the prepared samples.
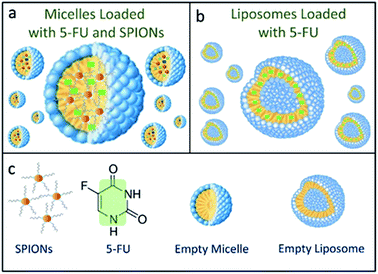 | ||
| Fig. 1 Schematic representation of SPION/5-FU/Micelles (a) and 5-FU/Liposomes (b), according to the legend reported in (c). | ||
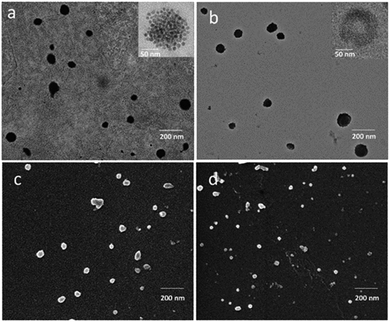
In Fig. 2b, DLS investigation provided an average hydrodynamic diameter of 145 nm (PDI = 0.212 ± 0.004) and of 185 nm (PDI = 0.238 ± 0.007) for SPION/5-FU/Micelles and 5-FU/Liposomes, respectively. The ζ-potential values reported in Fig. 2d indicated a high colloidal stability of both the lipid based nanoformulations in aqueous solution. TEM micrographs of SPION/5-FU/Micelles and 5-FU/Liposomes obtained with positive (Fig. 3a and b) and negative (inset Fig. 3a and b) staining showed, for both formulations, the presence of quite spherical nanostructures. In the case of micelle based nanoformulations, the TEM micrograph recorded after negative staining (inset Fig. 3a) points out the presence of aggregates reasonably formed of spherical, regular and uniform in shape SPIONs, encapsulated in each micelle, as clearly detectable thanks to the higher contrast of the inorganic domain respect to the organic components. In the case of liposome based nanoformulations, the bilayer typically ascribed to a liposome structure can be appreciated in the TEM micrograph recorded after negative staining (inset Fig. 3b).
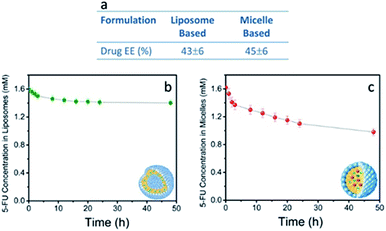
Furthermore, TEM micrographs obtained with positive staining show nanostructures with diameters ranging from 50 to 130 nm for the SPION/5-FU/Micelles (Fig. 3a) and from 60 to 170 nm for 5-FU/Liposomes (Fig. 3b), respectively. The results of the FE-SEM measurements performed on SPION/5-FU/Micelles are also in a good agreement with the TEM analysis, providing comparable diameter values (Fig. 3a and c). Conversely, in the case of liposomes, FE-SEM analysis displays spherical structures with sizes ranging from 30 to 100 nm (Fig. 2b (blue line), 3b and d). The initial concentration of 5-FU in micelles and liposomes was found to be about 1.6 mM, as determined by means of UV-Vis absorption spectroscopy. The two nanoformulations resulted characterized by comparable drug encapsulation efficiency (EE%), being of about 43% and 45% for 5-FU/Liposomes and SPION/5-FU/Micelles, respectively (Fig. 4a).
A burst in the drug release up to of 7 and 14%, for liposomes and micelles, respectively, was observed over the first 4 h. In both cases, the 5-FU was released by desorption from liposomal or micellar surface and diffusion into the PBS solution.48 The release profiles of both liposomes and micelles revealed a gradual and sustained release of 5-FU from the nanovectors up to 12% and 31% at 48 hours for 5-FU/Liposomes and SPION/5-FU/Micelles, respectively (Fig. 4b and c).
3.2 In vitro FE-SEM investigation
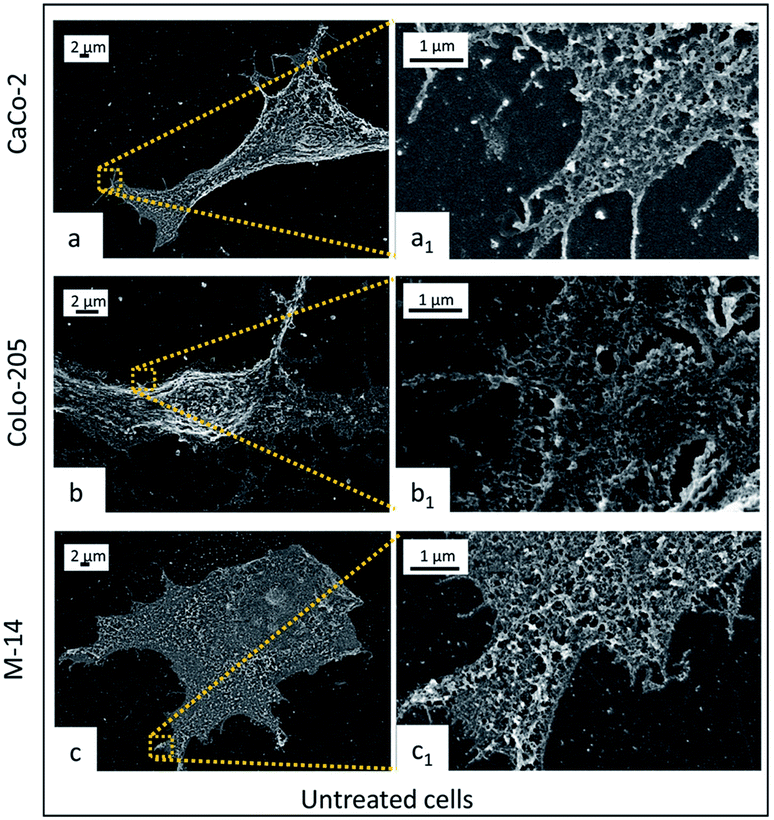
CaCo-2, CoLo-205 and M-14 cells were incubated with 5-FU/Liposomes and SPION/5-FU/Micelles to investigate the effect of the incubation time (6, 9, 24 and 48 hours) on their interactions with cells. Cells at sub-confluent density were used, since CaCo-2 and CoLo-205 cells at confluent density develop a monolayer with numerous microvilli, whose substructures could interfere with the proper observation of the NP adsorption onto cell membrane surface.36,37FE-SEM analysis performed on the untreated cells clearly highlights the difference in morphology of the three selected cell lines after undergoing the same fixation, dehydration and metallization procedure, preliminary required for the microscopy investigation. In Fig. 5, all the cell lines appear adherent cells on the substrate, indicating their healthy condition. However, CaCo-2 and M-14 cells seem completely flat, while, in the centre of the flat CoLo-205 cell body, the nucleus protrudes, assuming a clearly detectable spherical shape. Furthermore, CaCo-2 and CoLo-205 cells appear characterized by elongated narrow shape and by the presence on the surface of small pseudopodia, which are replaced by microvilli upon long term culture. Conversely, M-14 cell result large and with roughly oval shape.
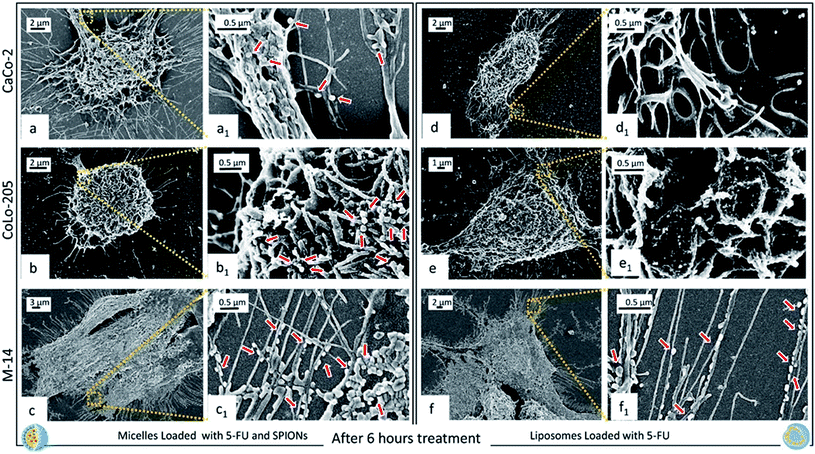
All the cell lines were treated with 5-FU/Liposomes and SPION/5-FU/Micelles, respectively, at 3 μM 5-FU concentration, for 6, 9, 24, and 48 hours. 3 μM was tested as drug concentration since this value falls within the range of clinically relevant concentrations of 5-FU (0.1 to 10 μM).49 Fig. 6 shows as, after 6 hours exposure to the two different nanoformulations, CaCo-2, CoLo205 and M-14 cells present a distinct change in morphology with respect to the controls. FE-SEM observation enables a distinct evaluation of any alteration in morphological features (size, shape, aspect ratio, nuclear/cytoplasmic ratio, number of pseudopodia, cell to cell adherence and cell adherence to culture substrates) induced by treatment with 5-FU loaded nanovectors, respect to control cells (Fig. 5).
Indeed, after 6 hours of cell incubation with 5-FU/Liposomes and SPION/5-FU/Micelles, the FE-SEM micrographs reported in Fig. 6 clearly show that, in both cases, the cells are not as flat as the respective controls, thus indicating that the exposure to the two the 5-FU based nanoformulations induces a rounding-up of the cells. A different geometry of the treated cells is evident with respect to the untreated cells (Fig. 5). In particular, the CaCo-2 and CoLo-205 cells lose their elongated shape and assume a spindle-shaped morphology, especially in the case of treatment with SPION/5-FU/Micelles (Fig. 6a, b, d and e). Conversely, the M-14 cells appear more resistant than the human colon cancer cells, since they more effectively retain their original morphology. Moreover, a substantial increase in the number of pseudopodia is observed comparing the FE-SEM micrographs of the treated cells with those obtained from the untreated ones (Fig. 5 and 6), thus indicating that the cells, although stressed after nanoformulation treatment, are still alive.49 Remarkably, the Fig. 6 allows to evaluate the differences in the cell uptake visualization of SPION/5-FU/Micelles (Fig. 6a, a1, b, b1 and c, c1) and 5-FU/Liposomes (Fig. 6d, d1, e, e1 and f, f1). For the CaCo-2 and Colo-205 cells the adsorption of liposomes based formulation at the cell surface is not so clearly detectable as observed in the case of the micelle based counterpart. In particular, individual SPION/5-FU/Micelles adherent to the membrane surface can be visibly detected, conversely to what happens in the case of liposomes, that, as evident in the close-up inset, appear fused, to different extent, with cell membrane. In M-14 cells, the behaviour of both the nanoformulations appears comparable, since SPION/5-FU/Micelles and 5-FU/Liposomes are adherent to the cell membranes but still preserve their individuality, without fusing with them (Fig. 6c, c1 and f, f1).
For all the investigated samples, the SPIONs containing micelles seem effectively to better preserve their original size respect to liposomes loaded only with drug, upon the drying and fixation process required for the FE-SEM investigation, finally resulting in a clearer visualization of the interactions cells-micelles.
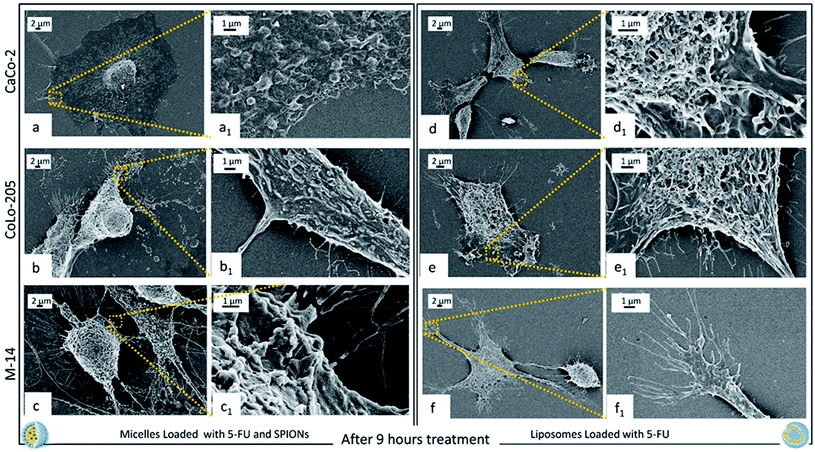
Fig. 7 shows the cell response after 9 hours of incubation with the two nanoformulations. Cell are rounded and a significant reduction of the number of pseudopodia is clearly observed, along with an induction of apoptosis, that indicate the beginning of a cell cycle arrest process, after 9 hours cell incubation with micelles and liposomes, for all the investigated cell types.50 In addition, cell membrane surface is characterized by the presence of emerging blebbings, that are typical features occurring in cells undergoing apoptotic cell death.51 At 9 hours of treatment a complete internalization of micelles and liposomes within the cell membrane can be assumed, since they are no longer detectable.
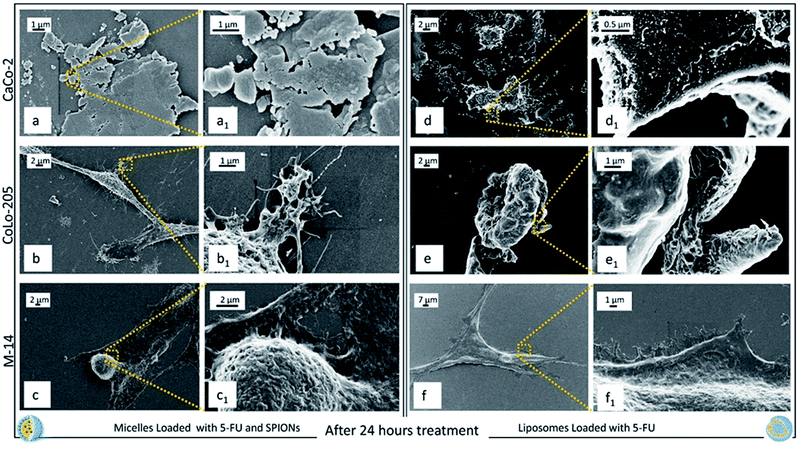
After 24 h exposure to both the nanoformulations, CaCo-2 cells appear definitely death (Fig. 8a, a1 and d, d1), since the morphology of healthy or stressed cells (Fig. 5a, a1 and 6a, d1) is completely lost and only cell fragments into apoptotic bodies can be observed. CoLo-205 cells treated with SPION/5-FU/Micelles seem to be still alive (Fig. 8b1), while 5-FU/Liposomes had a toxic effect leading to death the CoLo-205 cells, that were visible as amorphous non-living structures. Indeed, the complete loss of pseudopodia structures, that are useful also for cell adhesion, is evident (Fig. 8e and e1). The M-14 cells appear still alive upon 24 hours treatment with both the nanoformulations, since the corresponding micrographs show as the cells remain adherent to the substrate and the morphology of whole cells, though strongly altered, appears still detectable (Fig. 8c, c1 and f, f1).
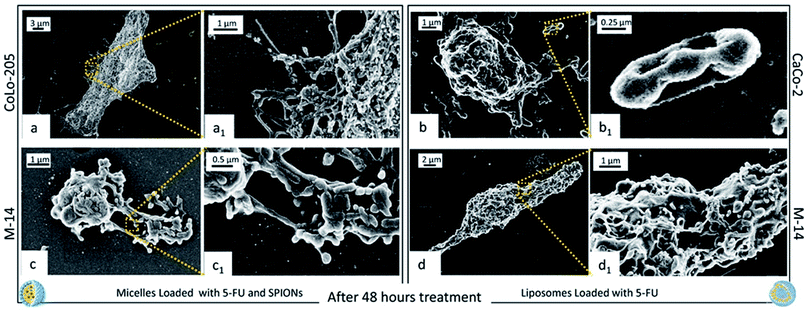
After 48 hours incubation, CaCo-2 cells treated with SPION/5-FU/Micelles could not be imaged, as cells were broken and completely fragmented, while, when treated with 5-FU/Liposomes, cells can be still imaged and appear dead (Fig. 9d and d1). Similarly, Colo-205 cells exposed to 5-FU/Liposomes were not imaged, as fully fragmented, while when treated with micelles a kind of morphology can be still detected, although a reduction in the number of pseudopodia is clearly visible (Fig. 9b and b1). Micrographs of M-14 cells after 48 hours incubation with both nanoformulations indicates that the cells are dead, with portions of the cell body and the membranes still visible (Fig. 9c, c1 and f, f1).
In the ESI† representative micrographs obtained by means of FE-SEM analysis performed on the three cell lines after their incubation with free 5-FU for 24 and 48 hours were reported, to compare the effects on the cell morphology of the drug when delivered by nanoformulations or free. In the FE-SEM micrographs reported in Fig. S1–S3 (ESI†) for each tested line, the cells appear characterized by a spindle-shaped morphology, especially in the case of CaCo-2 and CoLo-2 cells, their pseudopodia are well detectable and, consequently, the cells are alive after their treatment with free 5-FU for 24 hours. Furthermore, after 48 hours from the treatment with 5-FU, the cells, were observed, though altered in their morphology, still adherent to the substrate, and hence alive.
3.3 In vitro cell viability and proliferation study
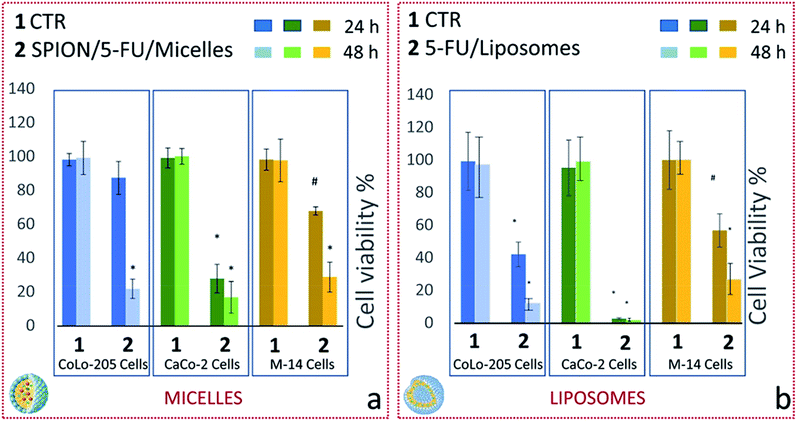
The effect of the two lipid-based nanoformulations on the metabolic activity of the three selected cell lines was also investigated by performing MTS cell proliferation assay. In particular, cell viability was evaluated after treatment of CoLo-205, CaCo-2 and M-14 cells, for 24 and 48 hours, with 5-FU/Liposomes and SPION/5-FU/Micelles, at drug concentration of 3 μM (Fig. 10).After 24 h treatment, both nanoformulations induced a substantial decrease in cell viability of CaCo-2 cells, being it strongly reduced to 28 and 0.4% (p < 0.001) for SPION/5-FU/Micelles and 5-FU/Liposomes, respectively (Fig. 10a and b, dark green histogram). Similarly, a significant reduction (p < 0.001) in cell viability, down to 40% was recorded for CoLo-205 cells treated with 5-FU/Liposomes, while, in the case of SPION/5-FU/Micelles, the vitality of CoLo-205 cells was affected only to a limited extent (decreasing down to 90%) in comparison with that of the control (Fig. 10a and b, blue histogram). Cell viability values higher than 50% were observed in the case of M-14 cells upon 24 hours treatment with both the nanoformulations, since approximately 30% and 45% reduction in cell viability (p < 0.005) was recorded for SPION/5-FU/Micelles and 5-FU/Liposomes, respectively (Fig. 10a and b, light brown histogram). After a 48 hours treatment, the MTS assay indicated, for both nanoformulations, a drop in cell viability consistently larger than 50% for all the three tested cell lines. In particular, 80 and 90% of CoLo-205 cells were dead after their treatment with SPION/5-FU/Micelles and 5-FU/Liposomes, respectively (Fig. 10a and b, light blue histogram). In the case of CaCo-2 cells, a dead cell percentage of 85% was recorded after cell incubation with SPION/5-FU/Micelles, while the treatment with FU/Liposomes induced about 100% cell death (Fig. 10a and b, light green histogram). Finally, the percentages of dead cells were of 74 and 78% for M-14 cells treated with SPION/5-FU/Micelles and 5-FU/Liposomes, respectively (Fig. 10a and b, yellow histogram).
Furthermore, the effect of SPION/5-FU/Micelles and 5-FU/Liposomes on cell viability of the three selected cell lines was also evaluated by immunofluorescence staining of Ki-67, that is a marker extensively used to investigate on cancer cell proliferation, in order to overcome the occurrence of possible over/underestimation of cell viability which may possibly affecting MTS assay.52,53
Namely, Ki-67 expression in CoLo-205, CaCo-2 and M-14 cells was analyzed after cell incubation, for 24 and 48 hours, with the two lipid based nanoformulations.
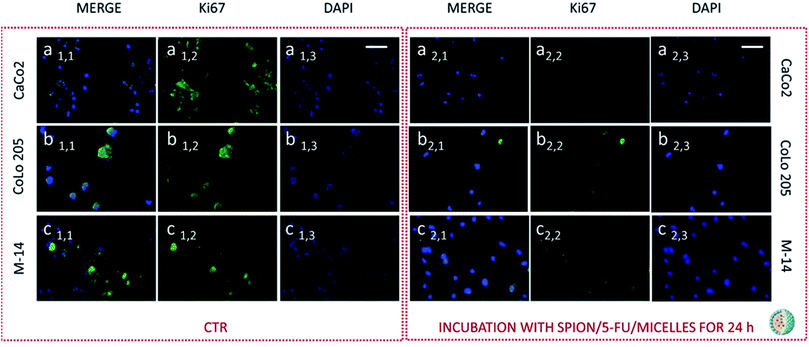
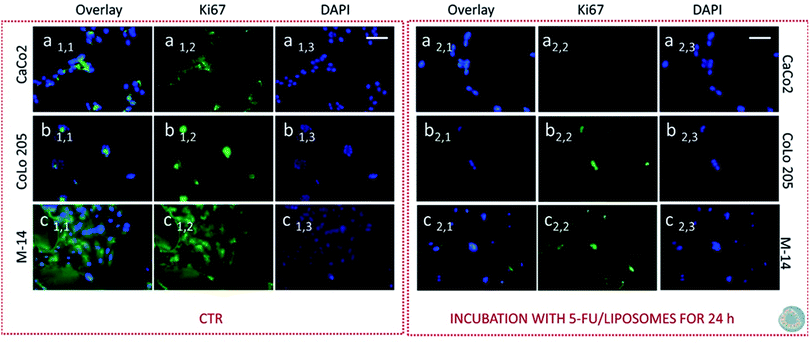
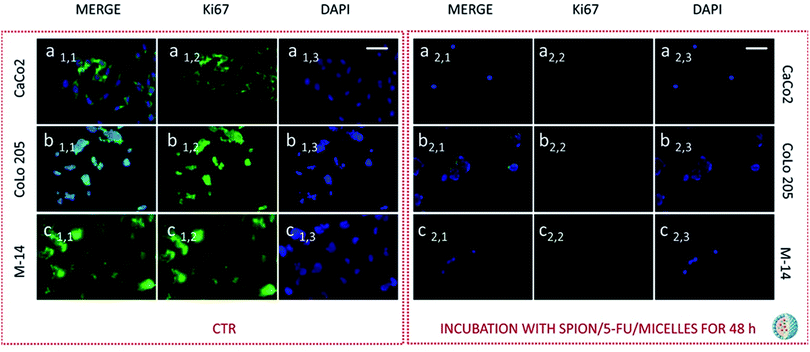
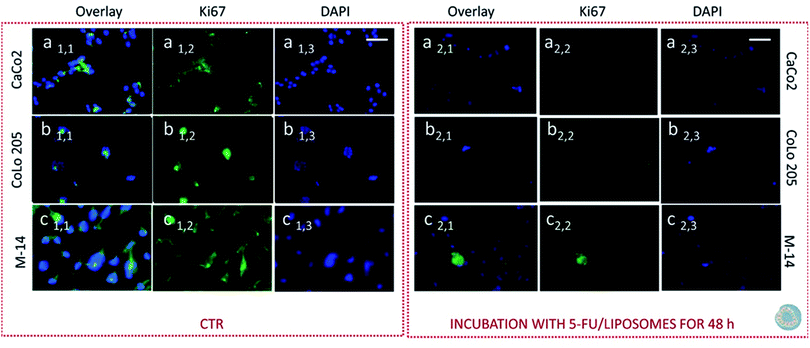
Subsequently cells were fixed and treated with primary anti-Ki67 antibody and finally with green-fluorescent labelled secondary antibody. The confocal microscopy analysis revealed that untreated cells, used as control at 24 and 48 hours, resulted Ki-67 positive, therefore indicating a proliferation state, as pointed out by the intense highly detectable green fluorescent signal in the nuclear and/or cytoplasmic regions, for all the three investigated cell lines (Fig. 11, 12, 13 and 14, Panel a1,1–a1,3, b1,1–b1,3 and c1,1–c1,3).
After 24 hours cell treatment with both the nanoformulations, a reduction of the number of cells, indicated by the blue stained nuclei, and of the green fluorescence spots was observed for all the investigated cell lines, compared to the corresponding control. In particular, the reduction of cell number and decrease of intensity of the green fluorescence signals were much more evident for CoLo-205 cells upon treatment with both the nanoformulations, while Ki67 expression decreased down to undetectable level in CaCo-205 cells, after their incubation with SPION/5-FU/Micelles and 5-FU/Liposomes (Fig. 11 and 12, Panel a2,1–a2,3 and b2,1–b2,3). Conversely, confocal microscopy images of M-14 cells revealed the presence of still considerable number of nuclei and the occurrence of highly marked green fluorescence after cell treatment with SPION/5-FU/Micelles and 5-FU/Liposomes for 24 h (Fig. 11 and 12, Panel c2,1–c2,3). After 48 hours treatment with SPION/5-FU/Micelles and 5-FU/Liposomes, all cells resulted clearly Ki-67 negative, thus indicating the cells resulted anyhow in non-proliferating and/or in cycle-arrested states (Fig. 13 and 14, Panel a2,1–a2,3, b2,1–b2,3 and c2,1–c2,3).
4. Discussion
5-FU is a chemotherapeutic drug typically used in colon and gastric cancer treatment, as the conversion of 5-FU into specific nucleotides is ideal to achieve optimal antitumor effect (Fig. 1c). 5-FU rapidly enters the cell by means of the transport mechanism, analogously to uracil.54 The anticancer effect is expressed through the inhibition of the thymidylate synthase (TS) and incorporation of its metabolites into RNA and DNA.55 However, the occurrence of several concomitant side effects represents significant drawbacks for the cancer therapy. The development of drug based nanoformulations represents a new frontier for the cancer therapy, providing a fundamental benefit and reduced side effects on cancer cell treatment.56 Here, the possibility of imaging and monitoring by means of FE-SEM systematic time course investigation, the adsorption to cellular membrane and interactions with cells of the two lipid based nanosystems, namely SPION/5-FU/Micelles and 5-FU/Liposomes (Fig. 1), is reported. In particular, the morphological changes and apoptotic effects induced by the two nanoformulations on the three different selected cancer cell lines, namely CaCo-2, CoLo-205 and M14 cells, were investigated. CaCo-2 and CoLo-205 cells are human colorectal cancer cell lines, which have been widely used as representative models to investigate tumor biology, pharmacological agents, and biomarkers.35 CaCo-2 cells are able to differentiate into a monolayer of cells like absorptive enterocytes with brush border layer typical of small intestine, useful to better understand the change of morphology when the cells was treated with drugs or other compound.36 For this reason, CaCo-2 cell line has been exploited for a range of applications, including also different studies on the potential toxic effects of drug or food metabolites, as reported in literature.37CoLo-205 cell line is characterized by unique morphological features. Namely, this cell line displays cuboidal morphology under optical microscope, but with subsequent cell passage has been reported to turn mainly into rounded shape objects clustering in suspension along with cuboidal cells in the monolayer.38 Conversely, M14 cell line represents an effective model, well suited to investigate the metastatic process in human melanoma.39 It has been reported that M 14 cells are large and characterized by an oval or short spindle-shape morphology.40 On these bases, the three cancer cell lines were selected as suitable model systems for the evaluation of drug-induced morphological cell differentiation after their treatment with the two nanoformulations. Here, 5-FU loaded liposomes and superparamagnetic iron oxide nanoparticles (SPIONs) containing micelles were prepared and their cell interactions and internalization were investigated. Micelles and liposomes are widely exploited drug delivery nanovectors and here the two proposed nanoformulations were selected as appropriate candidates to be investigated and tested for the detection of any possible differences between the cell interactions of the SPIONs loaded vector (micelles) and the SPION free counterpart (liposomes). Indeed, both the nanoformulations were found to present very comparable EE% values and hydrodynamic diameters falling in the same range (100–200 nm). In particular, TEM and SEM investigation performed on SPION/5-FU/Micelles essentially confirmed the findings achieved by DLS. Conversely, in the case of the 5-FU/Liposomes, the size values resulting from the SEM analysis are significantly smaller than those obtained by TEM and DLS investigation. Such a discrepancy can be reasonably explained taking into account the soft nature of the liposome based nanoformulations, composed of lipids and loaded with only 5-FU. As expected, liposomes shrank more than the 5-FU and SPIONs loaded micelles, due to the drying and fixation process required to perform FE-SEM characterization, that ends up in an evident final size reduction.
The micelles based nanostructures, encapsulating in their core the solid inorganic SPIONs clusters, limited their shrinkage, better preserving their pristine volume and size, in spite of the drying and fixation process on the silicon chip. The overall results obtained by the time course FE-SEM investigation performed over the cell incubation period with the nanoformulations, enabled a clear imaging of the drug induced subcellular changes, a timely and effective understanding of the cell response induced by cell treatment with SPION/5-FU/Micelles and 5-FU/Liposome, respectively. Upon 6 hours incubation of the three cell lines with each of the two nanoformulations, in all cases the cells were found rounded. Spherical nanostructures can be clearly revealed in a significant amount onto the surface of cytoplasmic membrane of the three different cell lines after cell exposure to SPION/5-FU/Micelles (Fig. 6a, a1, b, b1 and c, c1). Conversely, for the CaCo-2 and Colo-205 cells the liposome appear fused with cell membrane (Fig. 6d, d1 and e, e1). In M-14 cells (Fig. 6c, c1 and f, f1), as in the case of SPION/5-FU/Micelles, spherical 5-FU/Liposomes are still able to retain their individuality, thus resulting clearly detectable on cell membranes. Anyhow, any spherical nanostructures can be detected onto the surface of the untreated cells that were used as control (Fig. 5). Furthermore, a drug induced cell morphology modification was noticed for all tested cell lines, as pseudopods resulted much more numerous and more randomly projected with respect to the control cells, being reasonable accounted as an attempt of the cell to survive remaining anchored to the substrate. In particular, for the two metastatic cell lines, CoLo-205 and M-14 cells, pseudopods were found longer and more numerous than in the case of the primary tumor CaCo-2 cell line, being decorated with several nanostructures when treated with both the micelle and the liposome based formulation. Moreover, the nanostructures detected upon exposure to the SPION/5-FU/Micelles nanoformulation resulted larger than those imaged upon incubation with SPION free 5-FU/Liposomes based formulation, likely due to the presence of the dense solid inorganic SPIONs encapsulated in the micellar core, preventing the structure shrinkage upon fixation (Fig. 6).
After 9 hours incubation, a significant conformational alteration was detected for each cell lines, as the cells assumed a rounded shape, with appearance of blebbings and a drastic reduction of pseudopodial attachments and anchor points (Fig. 7). These peculiar features univocally indicate that the two nanoformulations, while any longer detected onto cell membranes, after 9 hours of incubation exhibited their toxic effect, as definitely assessed by the beginning of the apoptosis process. It is worth to point out as such peculiar morphological modifications, which were found to finally lead to cell death, can only be detected by means of electronic microscopy imaging, since the morphology of the nanostructures and the cell membrane surface modifications, are too small to be investigated and imaged by optical microscopy.
These results are further supported by the images recorded at 24 ad 48 hours of cell incubation with the two nanoformulations, when an even higher amount of drug is expected to be released, not only by burst effect but also as consequence of the internalization of nanoformulations. It is reasonable that the drug release occurs already starting after 9 hours, when the nanovectors no longer detectable on the cell membranes, are assumed to be completely internalized. Such phenomena take place concomitantly with the appearance of the cytotoxic effects. Already after 24 hours treatment with both the nanoformulations, CaCo-2 cells resulted dead, with no significant differences in the cell response to the micelles and the liposomes, respectively. At 24 hours, the CoLo205 cells incubated with liposomes already died, while the same cells seem to be still alive after incubation with micelles. This result suggests that the liposomes based nanoformulation seem to be more efficacious in the case of the CoLo-205 cells treatment. In the case of the M14 cells, the cell death was observed only after 48 hours, without any difference in the efficacy of the liposomes and micelles as 5-FU delivery system. Interestingly, the death of cells by FE-SEM technique can be evaluated by observing some amorphous body fragments without function and the loss of cell morphology, which represents a crucial feature for the cell survival. Interestingly, the results obtained by FE-SEM investigation on the cells treated with free 5-FU, that appeared still alive after 48 hours treatment (ESI), suggest that the anticancer effect of the 5-FU is enhanced when delivered by means the two lipid based nanovectors. Further investigation will be performed in the future to definitively validate this achievement.
The FE-SEM investigation, that visually accounts the time dependent apoptotic effects of the two proposed lipid based nanoformulations on the three investigated cancer cell lines, were validated by performing two conventional assays, namely the MTS assay and immunofluorescence staining of Ki-67 protein, that represent well-established methods to evaluate the cell viability and cell proliferation, respectively. MTS assay indicated that both the SPION/5-FU/Micelles and the 5-FU/Liposomes induced the death of more 70 and 90% CaCo-2 cells, respectively, already after 24 hours treatment. Conversely, the toxic effect of 5-FU/Liposomes on CoLo-205 cells, after 24 hours treatment, was more prominent than that of SPION/5-FU/Micelles, thus mainly corroborating the SEM results.
Remarkably, MTS assay confirmed that the treatment for 48 h with SPION/5-FU/Micelles and FU/Liposomes induced the death of the most cells, on the all three investigated cell line, according with the SEM investigation.
Furthermore, immunofluorescence staining of Ki-67 antigen in cells represented a valuable tool suited for investigating cell proliferation occurring upon cell treatments with the two lipid based nanoformulations. Ki-67 is generally described as a nuclear protein, that is involved in the regulation of cell division that is involved in the regulation of cell division.57–59 In spite of numerous studies, the exact localization of the Ki-67 antigen in cell is not fully yet understood, however its cellular distribution has been found strongly dependent on the cell-cycle.60 Recently, membranous and cytoplasmic Ki-67 expression has been described in immunohistochemical studies carried out on tissues affected by different tumors.61,62 Based on these premises, both the nuclear and cytoplasmic localization of this cell proliferation marker was observed, especially in the investigated metastatic cell lines, namely CoLo-205 and M-14 cells. Conversely, in the case of CaCo-2 cells, the localization appeared granular, polarized and nuclear. After 24 hours treatment of CaCo-2 cells with both the nanoformulations, the number of nuclei was strongly reduced with respect to the corresponding cell control, thus suggesting that several cells were dead. On the contrary, the confocal microscopy images of CoLo-205 cells treated with SPION/5-FU/Micelles for 24 hours showed the presence of considerable number of nuclei, though a weak staining of Ki-67 antigen could be still detected. In the case of CoLo-205 cells treated with 5-FU/Liposomes for 24 hours, the number of nuclei appeared strongly reduced in comparison with control cells and the green fluorescence was strongly decreased (Fig. 11 and 12, Panel a2,1–a2,3 and b2,1–b2,3). The weak green florescence observed for CoLo205 cells can be ascribed to cells in cycle-arrested state. Indeed, it has been reported that arrested cells could also stain positively for Ki-67 cells, owing to retention and slow disappearance of the protein in non-proliferating cells.63 The immunofluorescence staining of Ki-67 antigen performed on M-14 cells also confirmed that the most of them reached the cycle arrested state only after treatment with both the nanoformulations for 48 hours. The lack of any undetectable green fluorescent signal in confocal microscopy images of CaCo-2 and CoLo-205 cells after their treatment with SPION/5-FU/Micelles and FU/Liposomes for 48 hours, proved that the cells were in cycle-arrested state, thus destined to die. Therefore, the time-dependent decrease of Ki-67 expression observed by performing the protein immunofluorescence staining was also in accordance with the findings obtained MTS assay and, remarkably by FE-SEM analysis.
5. Conclusions
The presented study, combining multiple integrated microscopic techniques and complementary experiments, demonstrated that FE-SEM investigation is able to imaging cell modification upon the designed nanoformulations exposures, thus representing a prompt and valuable tool for the in vitro evaluation of cell response induced by the specific drug delivered by the two nanovectors, and, ultimately, of their chemotherapeutic effects. The obtained results point out that the proposed lipid based nanoformulations hold a great promise as efficient delivery systems, although they are worth to be more deeply investigated for their potential use in the treatment of colon cancer.More importantly and interestingly, the here described study highlighted that an extensive application of FE-SEM imaging, still not generally exploited for investigating the pharmacological effects of new nanoformulations, could be further developed for an ingenious integration with multiple, complementary established techniques to better address cancer therapy.
Conflicts of interest
There are no conflicts to declare.Acknowledgements
The work has been partially supported by the FONTANAPULIA “Fotocatalizzatori Nanostrutturati e Radiazioni UV per un'Acqua più Pulita” (CodWOBV6K5-CUPB37H170049000007, 2018-2019) and N-CHEM NanoMAX (prot. 76861 11/12/2012) Italian projects.Notes and references
- N. A. Fonseca, A. C. Gregório, Â. Valério-Fernandes, S. Simões and J. N. Moreira, Cancer Treat. Rev., 2014, 40, 626 CrossRef CAS.
- N. S. Rejinold, Y. Han, J. Yoo, H. Y. Seok, J. H. Park and Y. C. Kim, Sci. Rep., 2018, 8, 1899 CrossRef.
- N. Depalo, R. M. Iacobazzi, G. Valente, I. Arduino, S. Villa, F. Canepa, V. Laquintana, E. Fanizza, M. Striccoli, A. Cutrignelli, A. Lopedota, L. Porcelli, A. Azzariti, M. Franco, M. L. Curri and N. Denora, Nano Res., 2017, 10, 2431 CrossRef CAS.
- Y. Li, T. Y. Lin, Y. Luo, Q. Liu, W. Xiao, W. Guo, D. Lac, H. Zhang, C. Feng, S. Wachsmann-Hogiu, J. H. Walton, S. R. Cherry, D. J. Rowland, D. Kukis, C. Pan and K. S. Lam, Nat. Commun., 2014, 5, 4712 CrossRef CAS.
- A. Naveed, F. Hatem and E. Abdelhamid, Drug Discovery Today, 2012, 17, 928 CrossRef.
- N. Denora, A. Lopedota, M. Perrone, V. Laquintana, R. M. Iacobazzi, A. Milella, E. Fanizza, N. Depalo, A. Cutrignelli, A. Lopalco and M. Franco, Acta Biomater., 2016, 43, 170 CrossRef CAS.
- A. Lopedota, A. Cutrignelli, V. Laquintana, N. Denora, R. M. Iacobazzi, M. Perrone, E. Fanizza, M. Mastrodonato, D. Mentino, A. Lopalco, N. Depalo and M. Franco, Pharm. Res., 2016, 33, 2195 CrossRef CAS.
- N. Depalo, M. Corricelli, I. De Paola, G. Valente, R. M. Iacobazzi, E. Altamura, D. Debellis, D. Comegna, E. Fanizza, N. Denora, V. Laquintana, F. Mavelli, M. Striccoli, M. Saviano, A. Agostiano, A. Del Gatto, L. Zaccaro and M. L. Curri, ACS Appl. Mater. Interfaces, 2017, 9, 43113 CrossRef CAS.
- J. Shi, P. W. Kantoff, R. Wooster and O. C. Farokhzad, Nat. Rev. Cancer, 2017, 17, 20 CrossRef CAS PubMed.
- A. Z. Mirza and F. A. Siddiquil, Int. Nano Lett., 2014, 4, 94 CrossRef.
- R. Tantra and A. Knight, Nanotoxicology, 2011, 5, 381 CrossRef CAS.
- M. Costanzo, F. Carton, A. Marengo, G. Berlier, B. Stella, S. Arpicco and M. Malatesta, Eur. J. Histochem., 2016, 60, 2640 CAS.
- G. Rago, B. Bauer, F. Svedberg, L. Gunnarsson, M. B. Ericson, M. Bonn and A. Enejder, J. Phys. Chem. B, 2011, 115, 5008 CrossRef CAS.
- K. T. Thurn, E. M. B. Brown, A. Wu, S. Vogt, B. Lai, J. Maser, T. Paunesku and G. E. Woloschak, Nanoscale Res. Lett., 2007, 2, 430 CrossRef CAS.
- J. F. Zimmerman, R. Parameswaran, G. Murray, Y. Wang, M. Burke and B. Tian, Sci. Adv., 2016, 2, e1601039 CrossRef.
- A. P. R. Johnston, ACS Sens., 2017, 2, 4 CrossRef CAS.
- S. Bibi, R. Kaur, M. Henriksen-Laceya, S. E. Mc Neila, J. Wilkhua, E. Lattmann, D. Christensen, A. R. Mohammeda and Y. Perrie, Int. J. Pharm., 2011, 417, 138 CrossRef CAS.
- P. H. Hemmerich and A. H. von Mikecz, PLoS One, 2013, 8, e62018 CrossRef CAS.
- F. Moser, G. Hildenbrand, P. Müller, A. A. Saroori, A. Biswas, M. Bach, F. Wenz, C. Cremer, N. Burger, M. R. Veldwijk and M. Hausmann, Biophys. J., 2016, 110, 947 CrossRef CAS.
- M. L. Pati, E. Fanizza, S. Hager, D. Groza, P. Heffeter, A. G. Laurenza, V. Laquintana, M. L. Curri, N. Depalo, C. Abate and N. Denora, Mol. Biopharm., 2018, 15, 458 CrossRef CAS.
- E. Fanizza, R. M. Iacobazzi, V. Laquintana, G. Valente, G. Caliandro, M. Striccoli, A. Agostiano, A. Cutrignelli, A. Lopedota, M. L. Curri, M. Franco, N. Depalo and N. Denora, Nanoscale, 2016, 8, 3350 RSC.
- G. Valente, N. Depalo, I. de Paola, R. M. Iacobazzi, N. Denora, V. Laquintana, R. Comparelli, E. Altamura, T. Latronico, M. Altomare, E. Fanizza, M. Striccoli, A. Agostiano, M. Saviano, A. Del Gatto, L. Zaccaro and M. L. Curri, Nano Res., 2016, 9, 644 CrossRef CAS.
- T. Latronico, N. Depalo, G. Valente, E. Fanizza, V. Laquintana, N. Denora, A. Fasano, M. Striccoli, M. Colella, A. Agostiano, M. L. Curri and G. M. Liuzzi, PLoS One, 2016, 11, e0153451 CrossRef.
- L. Shang, K. Nienhaus, X. Jiang, L. Yang, K. Landfester, V. Mailänder, T. Simmet and G. U. Nienhaus, Beilstein J. Nanotechnol., 2014, 5, 2388 CrossRef.
- K. Kirschbaum, J. K. Sonner, M. W. Zeller, K. Deumelandt, J. Bode, R. Sharma, T. Krüwel, M. Fischer, A. Hoffmann, M. Costa da Silva, M. U. Muckenthaler, W. Wick, B. Tews, J. W. Chen, S. Heiland, M. Bendszus, M. Platten and M. O. Breckwoldt, Proc. Natl. Acad. Sci. U. S. A., 2016, 113, 13227 CrossRef CAS.
- C. Gottstein, G. Wu, B. J. Wong and J. A. Zasadzinski, ACS Nano, 2013, 7, 4933 CrossRef CAS.
- N. Depalo, V. De Leo, M. Corricelli, R. Gristina, G. Valente, E. Casamassima, R. Comparelli, V. Laquintana, N. Denora, E. Fanizza, M. Striccoli, A. Agostiano, L. Catucci and M. L. Curri, J. Mater. Chem. B, 2015, 7, 1471 Search PubMed.
- E. W. Liu, X. Zhou, Z. Mao, D. Yu, B. Wangnand and C. Gao, Soft Matter, 2012, 8, 9235 RSC.
- A. Goldstein, Y. Soroka, M. Frušić-Zlotkin, I. Popov and R. Kohen, J. Microsc., 2014, 256, 237 CrossRef CAS.
- N. Hondow, M. R. Brown, T. Starborg, A. G. Monteith, R. Brydson, H. D. Summers and Y. Brown, J. Microsc., 2016, 261, 167 CrossRef CAS.
- L. Hartsuiker, P. Vanes, W. Petersen, T. G. Van Leeuwen, L. W. M. M. Terstappen and C. Otto, J. Microsc., 2011, 244, 187 CrossRef CAS.
- X. Chen, C. B. Chen, C. N. B. Udalagama, M. Ren, K. E. Fong, L. Y. L. Yung, P. Giorgia, A. Bettiol and F. Watt, Biophys. J., 2013, 104, 1419 CrossRef CAS.
- S. Siddhanta, C. Zheng, C. Narayana and I. Barman, Chem. Sci., 2016, 7, 3730 RSC.
- J. Pawley, Scanning, 1997, 19, 324 CAS.
- D. Mouradov, C. Sloggett, R. N. Jorissen, C. G. Love, S. Li, A. W. Burgess, D. Arango, R. L. Strausberg, D. Buchanan, S. Wormald, L. O'Connor, J. L. Wilding, D. Bicknell, I. P. M. Tomlinson, W. F. Bodmer, J. M. Mariadason and O. M. Sieber, Cancer Res., 2014, 74, 3238 CrossRef CAS.
- J. Fogh, J. C. Wright and J. D. Loveless, J. Natl. Cancer Inst., 1977, 21, 393 Search PubMed.
- A. S. Tang, P. J. Chikhale, P. K. Shah and R. T. Borchardt, Pharm. Res., 1993, 10, 1620 CrossRef CAS.
- Y. Geng, S. Chandrasekaran, S. Agastin, J. Li and M. R. King, Cell. Mol. Bioeng., 2014, 7, 35 CrossRef CAS PubMed.
- M. Katano, R. E. Saxton, A. J. Cochran and R. F. Irie, J. Cancer Res. Clin. Oncol., 1984, 108, 197 CrossRef CAS.
- C. Korch, E. M. Hall, W. G. Dirks, M. Ewing, M. Faries, M. Varella-Garcia, S. Robinson, D. Storts, J. A. Turner, Y. Wang, E. C. Burnett, L. Healy, D. Kniss, R. M. Neve, R. W. Nims, Y. A. Reid, W. A. Robinson and A. Capes-Davis, Int. J. Cancer, 2018, 142, 561 CrossRef CAS PubMed.
- J. Ferlay, I. Soerjomataram, M. Ervik, R. Dikshit, S. Eser, C. Mathers, M. Rebelo, D. M. Parkin, D. Forman and F. Bray, Int. J. Cancer, 2015, 136, E359 CrossRef CAS.
- M. M. Chen, Y. Y. Liu, G. H. Su, F. F. Song, Y. Liu and Q. Q. Zhang, Int. J. Nanomed., 2017, 12, 4225 CrossRef CAS.
- L. Houdaihed, J. C. Evans and C. Allen, Mol. Biopharm., 2017, 14, 2503 CrossRef CAS.
- T. E. Nakajima, M. Yasunaga, Y. Kano, F. Koizum, K. Kato, T. Hamaguchi, Y. Yamada, K. Shirao, Y. Shimada and Y. Matsumura, Int. J. Cancer, 2000, 122, 2148 CrossRef.
- K. M. Camacho, S. Menegatti, D. R. Vogus, A. Pusuluri, Z. Fuchs, M. Jarvis, M. Zakrewsky, M. A. Evans, R. Chen and S. Mitragotri, J. Controlled Release, 2016, 10, 154 CrossRef.
- S. Biswas, N. S. Dodwadkar, R. R. Sawant and V. P. Torchilin, Bioconjugation, 2011, 22, 2005 CrossRef CAS.
- D. O. Chee, A. W. Boddie, J. A. Roth, E. C. Holmes and D. L. Morton, Cancer Res., 1976, 36, 1503 CAS.
- X. Huang and C. S. Brazel, J. Controlled Release, 2001, 73, 121 CrossRef CAS.
- E. Ojima, Y. Inoue, H. Watanabe, J. Hiro, Y. Toiyama, C. Miki and M. Kusunoki, Oncol. Rep., 2006, 16, 1085 CAS.
- G. Kroemer, L. Galluzzi, P. Vandenabeele, J. Abrams, E. S. Alnemri, E. H. Baehrecke, M. V. Blagosklonny, W. S. El-Deiry, P. Golstein, D. R. Green, M. Hengartner, R. A. Knight, S. Kumar, S. A. Lipton, W. Malorni, G. Nuñez, M. E. Peter, J. Tschopp, J. Yuan, M. Piacentini, B. Zhivotovsky and G. Melino, Cell Death Differ., 2009, 16(3), 11 Search PubMed.
- E. J. Mahdi, A. M. Alshahrani, A. A. Abdulsatar and J. G. Mahdi, Journal of Microscopy and Ultrastructure, 2014, 2, 20 CrossRef.
- J. Gerdes, Semin. Cancer Biol., 1990, 1, 199 CAS.
- A. A. Stepanenko and V. V. Dmitrenko, Gene, 2015, 574, 193 CrossRef CAS.
- B. Daniel, D. Longley, D. P. Harkin and P. G. Johnston, Nature, 2003, 3, 330 Search PubMed.
- D. V. Santi, C. S. McHenry and H. Sommer, Biochemistry, 1974, 13, 471 CrossRef CAS.
- M. P. Scavo, E. Gentile, J. Wolfram, J. Gu, M. Barone, M. Evangelopoulos, J. O. Martinez, X. Liu, C. Celia, E. Tasciotti, E. Vilar and H. Shen, Colloids Surf., B, 2015, 136, 694 CrossRef CAS.
- T. Scholzen and J. Gerdes, J. Cell. Physiol., 2000, 182, 311 CrossRef CAS.
- M. Duchrow, J. Gerdes and C. Schlüter, Cell Proliferation, 1994, 27, 235 CrossRef CAS.
- S. Etemad-Moghadam, S. E. Fouladdel, E. Azizi and M. Alaeddini, J BUON, 2013, 18, 1062 CAS.
- N. Braun, T. Papadopoulos, K. Hans and H. K. Miiller-Hermelink, Virchows Arch. B, 1988, 56, 25 CrossRef CAS.
- D. Faratian, A. Munro, C. Twelves and J. M. S. Bartlett, Histopathology, 2009, 54, 254 CrossRef.
- M. Tsurusawa and T. Fujimoto, Cytometry, 1995, 20, 146 CrossRef CAS.
- M. G. van Oijen, R. H. Medema, P. J. Slootweg and G. Rijksen, Am. J. Clin. Pathol., 1998, 110, 24 CrossRef CAS.
Footnote |
| † Electronic supplementary information (ESI) available: FE-SEM analysis performed on the three different cell lines, after their incubation with free 5-FU for 24 and 48 hours. See DOI: 10.1039/c9ra02381j |
| This journal is © The Royal Society of Chemistry 2019 |

